. 2022 Feb 28;57(4):480-495.e6.
doi: 10.1016/j.devcel.2022.01.015. Epub 2022 Feb 11.

Matrix remodeling controls a nuclear lamin A/C-emerin network that directs Wnt-regulated stem cell fate

Affiliations

Matrix remodeling controls a nuclear lamin A/C-emerin network that directs Wnt-regulated stem cell fate

Yi Tang et al. Dev Cell. .

Abstract

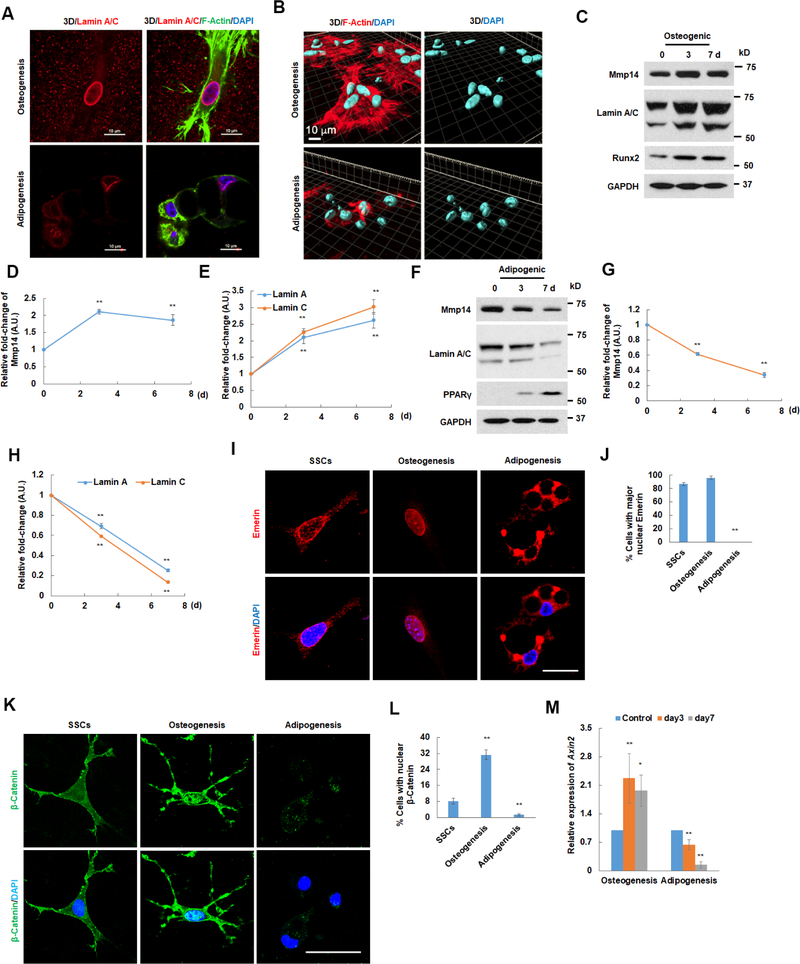
Skeletal stem cells (SSCs) reside within a three-dimensional extracellular matrix (ECM) compartment and differentiate into multiple cell lineages, thereby controlling tissue maintenance and regeneration. Within this environment, SSCs can proteolytically remodel the surrounding ECM in response to growth factors that direct lineage commitment via undefined mechanisms. Here, we report that Mmp14-dependent ECM remodeling coordinates canonical Wnt signaling and guides stem cell fate by triggering an integrin-activated reorganization of the SCC cytoskeleton that controls nuclear lamin A/C levels via the linker of nucleoskeleton and cytoskeleton (LINC) complexes. In turn, SSC lamin A/C levels dictate the localization of emerin, an inner nuclear membrane protein whose ability to regulate β-catenin activity modulates Wnt signaling while directing lineage commitment in vitro and in vivo. These findings define a previously undescribed axis wherein SSCs use Mmp14-dependent ECM remodeling to control cytoskeletal and nucleoskeletal organization, thereby governing Wnt-dependent stem cell fate decisions.

Keywords: Mmp14; Wnt; adipogenesis; beta-catenin; collagen; emerin; extracellular matrix; lamin; matrix metalloproteinase; osteogenesis; stem cells.


Conflict of interest statement

Declaration of interests The authors declare no competing interests.

Figures

Figure 1.
Figure 1.
ECM remodeling regulates Wnt signaling. A. Immunofluorescence staining of cleaved collagen neoepitope (Col1-3/4C antibody, green), F-actin (red) and DAPI (blue) in SSCs isolated from Mmp14+/+ or Mmp14−/− mice cultured in 3D collagen gels and incubated without or with BB-94 (5 μM) for 48 hr as assessed by confocal imaging. Right panel: quantitation of the cleaved collagen. Scale bar: 8 μm. Mean±s.e.m. (n=3) by ANOVA, **p<0.01. B. Heat map of Wnt signaling pathway-associated transcripts detected in SSCs isolated from Mmp14+/+ or Mmp14−/− mice, and cultured in 3D collagen gels for 48 hr. Results are from 2 representative exps. C. Western blot of active (non-phosphorylated) β-catenin in SSCs isolated from Mmp14+/+ or Mmp14−/− mice and cultured in 3D collagen gels without or with recombinant Wnt-3a (100 ng/ml) for the indicated times. Right panel: Quantitation of β-catenin levels (β-catenin in Mmp14+/+ cells at time 0 set to a value of 1). Mean±s.e.m. (n=3) by Student’s t test, **p<0.01. D. Z-stack confocal images of active β-catenin in SSCs from (C) treated without or with Wnt-3a (100 ng/ml) for 4 hr. Scale bar: 10 μm. Right panel: quantitation of nuclear β-catenin+ cells. Mean±s.e.m. (n=3 with 50 cells randomly scored/exp) by ANOVA, **p<0.01. E. RT-PCR of Wnt signaling target genes in SSCs from (C) cultured with Wnt-3a (100 ng/ml) for 4 hr. Mean±s.e.m. (n=3) by Student’s t test, **p<0.01. F. Western blot of active β-catenin in SSCs isolated from Mmp14+/+ or Mmp14−/− mice and cultured in 2D without or with Wnt-3a (100 ng/ml) for indicated times. Right panel: quantitation of β-catenin levels (β-catenin in Mmp14+/+ cells at time 0 set as 1). Mean±s.e.m. (n=3) by Student’s t test, **p<0.01. G. RT-PCR of Wnt-targeted genes in SSCs from (F) cultured with Wnt-3a (100 ng/ml) for 4 hr. Mean±s.e.m. (n=3) by Student’s t test, **p<0.01. H. Histology of parietal bone from P0 Mmp14+/+ or Mmp14−/− mice. Scale bar: 100 μm. B: bone, S: Suture. Results representative of 3 exps performed. I. Z-stack confocal images of active β-catenin in parietal bone from P0 Mmp14+/+ or Mmp14−/−. Scale bar: 25 μm. B: bone, S: Suture. Right panel: quantitation of nuclear β-catenin-positive cells. (n=6; 100 cells randomly imaged in each suture) by Student’s t test, **p<0.01. J. Western blot of active β-catenin in calvaria lysates from P0 Mmp14+/+ or Mmp14−/− mice. Right panel: quantitation of β-catenin levels. Mean±s.e.m. (n=3) by Student’s t test, **p<0.01. K. RT-PCR of Wnt signaling target genes in calvarial extracts from P0 Mmp14+/+ or Mmp14−/− mice. Mean±s.e.m. (n=6) as assessed by Student’s t test, ** p<0.01.
Figure 2.
Figure 2.
ECM remodeling regulates Wnt signaling by triggering cytoskeletal reorganization. A. Schematic of PEG-based hydrogel harboring MMP -sensitive or -insensitive peptides cross-linked to a PEG backbone decorated with cell-adhesive RGD. B. Western blot of active β-catenin in Mmp14+/+ SSCs cultured in degradable or non-degradable PEG-based hydrogels with or without Wnt-3a (100 ng/ml) for 4 hr. Right panel: Quantitation of β-catenin levels (cells cultured in degradable gels without Wnt-3a are set to a value of 1). Mean±s.e.m. (n=3) by ANOVA, **p<0.01. C. RT-PCR of Wnt target genes in SSCs from (B) cultured with Wnt-3a (100 ng/ml) for 4 hr. Mean±s.e.m. (n=3) by Student’s t test, ** p<0.01. D. Z-stack confocal images of active integrin β1 in SSCs isolated from Mmp14+/+ or Mmp14−/− mice cultured in 3D collagen gels for 4 hr. Scale bar: 5 μm. Results representative of 3 exps performed. E. Z-stack confocal images of phalloidin-stained SSCs isolated from Mmp14+/+ or Mmp14−/− mice and cultured in 3D collagen gel for 48 hr. Scale bar: 10 μm. Results representative of 3 exps performed. F. Z-stack confocal images of phalloidin-stained SSCs isolated from Mmp14+/+ or Mmp14−/− mice and cultured in 3D PEG hydrogels (MMP- degradable or non-degradable) for 7 d. Scale bar: 10 μm. Results representative of 3 exps performed. G. Z-stack confocal images of phalloidin-stained SSCs isolated from Mmp14+/+ or Mmp14−/− mice and cultured atop 2D glass surfaces for 48 hr. Scale bar: 10 μm. Results representative of 3 exps performed. H. Z-stack confocal images of phalloidin-stained Mmp14+/+ SSCs cultured in 3D collagen gels with control IgG or anti-integrin β1 antibody (0.5 μg/ml) for 48 hr. Results representative of 3 exps performed. Scale bar: 5 μm. I. Z-stack confocal images of phalloidin-stained Mmp14+/+ SSCs cultured in 3D collagen gel and treated without (control) or with cytochalasin D (1 μM) for 36 hr. Results representative of 3 exps performed. Scale bar: 5 μm. J. Western blot of active β-catenin in SSCs cultured in 3D collagen gels with control IgG or an anti-integrin-β1 antibody (0.5 μg/ml) for 24 hr and then treated without or with Wnt-3a (100 ng/ml) for 4 hr. Right panel: Quantitation of β-catenin levels (cells treated with IgG in the absence of Wnt-3a are set to a value of 1). Mean±s.e.m. (n=3) as by ANOVA, **p<0.01. K. RT-PCR of Wnt target genes in SSCs from (J) cultured with Wnt-3a (100 ng/ml) for 4 hr. Mean±s.e.m. (n=3) by Student’s t test, ** p<0.01. L. Western blot of active β-catenin in Mmp14+/+ SSCs cultured in 3D collagen gels with cytochalasin D (1 μM) for 36 hr and treated without or with Wnt-3a (100 ng/ml) for the indicated times. Results representative of 3 exps performed. M. Quantitation of β-catenin levels for (L) with control group at time 0 set as 1. Mean±s.e.m. (n=3) by Student’s t test, **p<0.01. N. RT-PCR of Wnt signaling target genes in SSCs from (L) cultured with Wnt-3a (100 ng/ml) for 4 hr. Mean±s.e.m. (n=3) by Student’s t test, ** p<0.01. O. Z-stack confocal images of phalloidin-stained SSCs isolated from Mmp14−/− mice, transduced with a control lentiviral vector (EV) or a vector expressing an activated integrin-β1 mutant (G429N) and cultured in 3D collagen gels for 48 hr. Scale bar: 10 μm. Results representative of 3 exps performed. P. Western blot of active β-catenin in SSCs from (O) treated without or with Wnt-3a (100 ng/ml) for 4 hr. Right panel: Quantitation of β-catenin levels (EV group cultured without Wnt-3a treatment set to a value of 1). Mean±s.e.m. (n=3) by ANOVA, **p<0.01. Q. RT-PCR of Wnt target genes in SSCs from (O) cultured with Wnt-3a (100 ng/ml) for 4 hr. Mean±s.e.m. (n=3) by Student’s t test, ** p<0.01.
Figure 3.
Figure 3.
LINC complexes couple nucleo- and cyto- skeletal organization with ECM remodeling to regulate Wnt signaling. A. Z-stack confocal imaging of lamin A/C in SSCs isolated from Mmp14+/+ or Mmp14−/− mice, cultured in 3D collagen gels and treated without or with BB-94 (5 μM) for 48 hr. Lower panel: Normalized fluorescence intensity profiles of lamin A/C along the yellow line crossing nuclei are shown. Scale bar: 10 μm. Results representative of 3 exps performed. B. Western blot of lamin A/C and phosphorylated lamin A/C (P-Lamin A/C) in cells from (A). Right panel: Quantitation of protein levels. Mean±s.e.m. (n=3) by ANOVA, **p<0.01. C. Z-stack confocal imaging of lamin B1 in SSCs isolated from Mmp14+/+ or Mmp14−/− mice and cultured in 3D collagen gels for 48 hr. Scale bar: 10 μm. Results representative of 3 exps performed. D. Western blot quantitation of lamin B1 and B2 expression in SSCs isolated from Mmp14+/+ or Mmp14−/− mice and cultured in 3D collagen gels for 48 hr. Mean±s.e.m. (n=3) by Student’s t test, **p<0.01. E. Western blot of lamin A/C and P-lamin A/C in Mmp14+/+ SSCs cultured in degradable or non-degradable PEG-based hydrogels for 7 d. Results representative of 3 exps performed. F. Quantitation of lamin A/C and P-lamin A/C in cells from (E). Mean±s.e.m. (n=3) by Student’s t test, **p<0.01. G. Z-stack confocal imaging of phalloidin-stained SSCs isolated from Mmp14+/+ mice and transduced with retroviral expression vectors encoding DNKASH-PPPL or a dominant-negative KASH (DNKASH) and cultured in 3D collagen gels for 48 hr. Scale bar: 10 μm. Right panel: Quantitation of F-actin in 10 randomly selected cells analyzed from each of 3 independent exps, ** p<0.01. H. Western blot of lamin A/C and P-lamin A/C in SSCs from (G). Results representative of 3 exps performed. I. Quantitation of lamin A/C and phosphorylated lamin A/C (P-Lamin A/C) expression in cells from (H). Mean±s.e.m. (n=3) by Student’s t test, **p<0.01. J. Z-stack confocal imaging of active β-catenin in SSCs from (G) treated with or without Wnt-3a (100 ng/ml) for 4hr. Scale bar: 10 μm. Results representative of 3 exps performed. K. Quantitation of nuclear β-catenin positive cells from (J). Mean±s.e.m. (n=3 using 50 randomly scored cells/exp) by ANOVA, **p<0.01. L. Western blot of active β-catenin in SSCs expressing a constitutively active β1 integrin mutant transduced with retroviral DNKASH-PPPL or DNKASH and cultured in 3D collagen gels for 48 hr. Cells were treated without or with Wnt-3a (100 ng/ml) for 4 hr. Results representative of 3 exps performed. M. Quantitation of β-catenin levels for (L) with the DNKASH-PPPL group cultured without Wnt-3a set to a value of 1. Mean±s.e.m. (n=3) by ANOVA, **p<0.01. N. Western blot quantitation of lamin A/C expression in SSCs expressing an active β1 integrin mutant were transduced with DNKASH-PPPL or DNKASH retroviral expression vectors and cultured in 3D collagen gels for 48 hr. Mean±s.e.m. (n=3) by Student’s t test, **p<0.01. O. Z-stack confocal imaging of lamin A/C in parietal bone from P0 Mmp14+/+ or Mmp14−/− mice. Scale bar: 15 μm). B: Bone, S: Suture. Results representative of 3 exps performed. P. Western blot quantitation of lamin A/C in protein lysates of calvaria recovered from P0 Mmp14+/+ or Mmp14−/− mice. Mean±s.e.m. (n=3) by Student’s t test, **p<0.01.
Figure 4.
Figure 4.
Lamin A/C regulates Wnt signaling to control SSC differentiation. A. A 3-month-old Lmnaf/f/Dermo1-Cre mouse and its control littermate (Lmnaf/f). B. Osteoclast-specific TRAP/Fast Green staining of femurs from a 3 month-old Lmnaf/f/Dermo1-Cre mouse and control littermate (Lmnaf/f). Scale bar: 100 μm. Results representative of 3 exps performed. C. Quantitation of osteoclast numbers in sections from images shown in (B). Number of Osteoclasts/Perimeter (mm) (N.Oc/Pm (mm)) are shown. Mean±s.e.m. (n=6) as by Student’s t test, * p<0.05. D. Alizarin Red/Alcian Blue staining of skulls isolated from P2 Lmnaf/f and Lmnaf/f /Dermo1Cre mice. Scale bar: 2 mm. White dotted line indicates the suture area: S. Results representative of 3 exps performed. E. Z-stack confocal imaging of active β-catenin in parietal bone from P2 Lmnaf/f and Lmnaf/f /Dermo1Cre mice. Scale bar: 50 μm. (B: Bone, S: Suture). Results representative of 3 exps performed. F. Western blot and quantitation of active β-catenin in lysates recovered from calvaria of P2 Lmnaf/f and Lmnaf/f/Dermo1Cre mice. Mean±s.e.m. (n=3) by Student’s t test, **p<0.01. G. Relative expression of Wnt target genes in calvarial extracts from P2 Lmnaf/f and Lmnaf/f/Dermo1Cre mice. Mean±s.e.m. (n=6) by Student’s t test, ** p<0.01. H. Histology of tibia from 3-month old Lmnaf/f and Lmnaf/f /Dermo1Cre conditional knockout mice. Lower panels show high magnification images highlighting adipogenesis. Scale bar: 100 μm. Results representative of 3 exps performed. I. Relative mRNA expression of adipogenic and osteogenic markers in bone marrow RNA isolated from 3 month-old Lmnaf/f and Lmnaf/f/Dermo1Cre mice. Mean±s.e.m. (n=6) by Student’s t test, ** p<0.01. J. Western blot of active β-catenin in SSCs from Lmna+/+ or Lmna−/− mice incubated alone or with Wnt-3a (100 ng/ml) for indicated times. Results are representative of 3 exps performed. K. Quantitation of β-catenin levels for (J) with β-catenin in Lmna+/+ cells at time 0 set at 1. Mean±s.e.m. (n=3) by Student’s t test, **p<0.01. L. Z-stack confocal imaging of active β-catenin in SSCs isolated from Lmna+/+ or Lmna−/− mice and cultured in 3D collagen gels treated with Wnt-3a (100 ng/ml) for 4 hr. Scale bar: 10 μm. Results are representative of 3 exps performed. M. Quantitation of nuclear β-catenin+ cells from (L). Mean±s.e.m. (n=3 with 50 randomly selected cells scored/experiment) by ANOVA, **p<0.01. N. Relative mRNA expression of Wnt target genes in SSCs from (L) treated with Wnt-3a (100 ng/ml) for 4 hr. Mean±s.e.m. (n=3) by Student’s t test, ** p<0.01.
Figure 5.
Figure 5.
Nucleoskeletal control of emerin/β-catenin complexes regulates Wnt signaling and SSC differentiation. A. Z-stack confocal imaging of emerin in SSCs isolated from Lmna+/+ or Lmna−/− mice and cultured atop 2D atop glass surfaces for 48 hr. Right panels: Normalized fluorescence intensity profiles of emerin (red) and DAPI (blue) along the yellow line crossing cells are shown. Scale bar: 10 μm. Results representative of 3 exps performed. B. Z-stack confocal images of emerin and lamin A/C in SSCs isolated from Mmp14+/+ or Mmp14−/− mice and cultured in 3D collagen for 48 hr are shown for the first 3 sets of panels. Single confocal plane images of emerin are shown in the far right panels. Scale bar: 10 μm. Results representative of 3 exps performed. C. Immunoprecipitation of emerin/β-catenin complexes in SSCs isolated from Lmna+/+ or Lmna−/− mice and cultured in 3D collagen gels for 48 hr. Right panel: Quantitation of emerin/β-catenin complexes. Mean±s.e.m. (n=3) by Student’s t test, **p<0.01. D. Immunoprecipitation of emerin/β-catenin complexes in SSCs isolated from Mmp14+/+ or Mmp14−/− mice and cultured in 3D collagen gels for 48 hr. Right panel: Quantitation of emerin/β-catenin complexes. Mean±s.e.m. (n=3) by Student’s t test, **p<0.01. E. Western blot of active β-catenin in SSCs transfected with control (GFP) or emerin siRNAs and cultured in in 3D collagen gels without or with Wnt-3a (100 ng/ml) for 4 hr. Results representative of 3 exps performed. F. Quantitation of β-catenin levels for (E) with si-GFP group cultured without Wnt-3a treatment set at 1. Mean±s.e.m. (n=3) by ANOVA, *p<0.05, **p<0.01. G. Relative mRNA expression of Wnt target genes in SSCs transfected with control (GFP) or emerin siRNAs and cultured in 3D collagen gels without or with Wnt-3a (100 ng/ml) for 4 hr. Mean±s.e.m. (n=3) by Student’s t test, ** p<0.01. H. Z-stack confocal imaging of emerin in SSCs isolated from Mmp14−/− mice and transduced with an empty (EV) or GFP-LMNA expression vector and cultured in 3D collagen gels for 48 hr. Scale bar: 10 μm. Right panel: Quantitation of percent cells with distinct nuclear emerin staining. Mean±s.e.m. (n=3 with 30 randomly scored cells counted/exp) by Student’s t test, ** p<0.01. I. Z-stack confocal imaging of active β-catenin in SSCs from (H) treated with 100 ng/ml Wnt-3a for 4 hr. Scale bar: 10 μm. Results representative of 3 exps performed. J. Quantitation of the percent cells with nuclear-stained β-catenin for (I). Mean±s.e.m. (n=3 with 50 randomly scored cells counted/exp) by Student’s t test, ** p<0.01. K. Relative mRNA expression of Wnt target genes in SSCs from (I). Mean±s.e.m. (n=3) by Student’s t test, ** p<0.01. L. Western blot of active β-catenin in SSCs isolated from Emd+/+ mice, transduced with an empty (EV) or GFP-LMNA expression vector, cultured in 3D collagen gels for 48 hr, and treated with 100 ng/ml Wnt-3a for 4 hr. Scale bar: 10 μm. Right panel: Quantitation of β-catenin levels with the EV group cultured without Wnt-3a treatment set at 1. Mean±s.e.m. (n=3) by ANOVA, **p<0.01. M. Western blot of active β-catenin in SSCs isolated from Emd−/− mice, transduced with an empty (EV) or GFP-LMNA expression vector, cultured in 3D collagen gels for 48 hr and treated with 100 ng/ml Wnt-3a for 4 hr. Scale bar: 10 μm. N. Quantitation of β-catenin levels in (M) with the EV group cultured without Wnt-3a set at 1. Mean±s.e.m. (n=3) by ANOVA, **p<0.01. O. Left panel: Schematic representation of the experimental design. Right panel: Mmp14+/+ or Mmp14−/− SSCs were transduced with an empty (EV) or a GFP-LMNA expression vector, embedded in collagen gels, and implanted subcutaneously into nude mice. Control: collagen gel alone implanted into the nude mice. Three weeks later, implants were harvested, fixed and H&E-stained. Scale bar: 100 μm. Results representative of n=6 exps.
Figure 6.
Figure 6.
Modulating Mmp14 activity, lamin A/C levels, emerin localization and Wnt signaling during osteogenic versus adipogenic commitment. A. Z-stack confocal imaging of lamin A/C and F-actin in SSCs cultured in 3D collagen under osteogenic or adipogenic conditions for 7 d. Scale bar: 10 μm. Results representative of 3 exps performed. B. Z-stack confocal imaging of phalloidin- and DAPI- stained SSCs from (A) in tandem with nuclear shape changes as shown in 3D reconstructions assembled by Imaris software. Scale bar: 10 μm. Results representative of 3 exps performed. C. Western blot of Mmp14 and lamin A/C in SSCs cultured in 3D collagen with osteogenic induction for the indicated times. Results representative of 3 exps performed. D. Quantitation of Mmp14 levels for (C) with time 0 values set at 1. Mean±s.e.m. (n=3) by ANOVA, **p<0.01. E. Quantitation of lamin A/C levels for (C) with time 0 set to a value of 1. Mean±s.e.m. (n=3) by ANOVA, **p<0.01. F. Western blot of Mmp14 and lamin A/C in SSCs cultured in 3D collagen with adipogenic induction for the indicated times. Results representative of 3 exps performed. G. Quantitation of Mmp14 levels for (F) with time 0 set to a value 1. Mean±s.e.m. (n=3) by ANOVA, **p<0.01. H. Quantitation of lamin A/C levels for (F) with time 0 set to a value of 1. Mean±s.e.m. (n=3) by ANOVA, **p<0.01. I. Z-stack confocal images of emerin in SSCs cultured in 3D collagen under osteogenic or adipogenic conditions for 7 d. Scale bar: 7.5 μm. Results representative of 3 exps performed. J. Quantitation of the percent cells with distinct nuclear-stained emerin for (I). Mean±s.e.m. (n=3 with 30 randomly scored cells scored/exp) by ANOVA, ** p<0.01. K. Z-stack confocal images of active β-catenin in SSCs cultured in 3D collagen under osteogenic or adipogenic conditions for 7 d. Scale bar: 10 μm. Results representative of 3 exps performed. L. Quantitation of the percent cells with nuclear-stained β-catenin in (K). Mean±s.e.m. (n=3 with 50 randomly scored cells scored/exp) by ANOVA, ** p<0.01. M. Axin2 expression in SSCs cultured in 3D collagen under osteogenic or adipogenic conditions for the indicated times. Mean±s.e.m. (n=3) by Student’s t test, * p<0.05, ** p<0.01.
Figure 7.
Figure 7.
Schematic model. Mmp14-dependent ECM remodeling by SSCs triggers coordinated cell spreading and shape changes that lead to integrin activation and the induction of an F-actin/LINC/lamin A/C cascade that localizes emerin to the nuclear envelope, creating conditions permissive for nuclear β-catenin trafficking and the Wnt signaling programs necessary for osteogenic commitment. Alternatively, when adipogenic signals repress (or fail to trigger) Mmp14 activity, ECM remodeling is downregulated, thereby blunting the integrin signaling cascade and F-actin/LINC/lamin A/C mechanotransduction. As lamin A/C levels fall, emerin diffuses from the nuclear envelope into the ER where it serves as a β-catenin sink, thereby inhibiting Wnt signaling to allow adipogenesis to proceed.

References

    1. Alisafaei F, Jokhun DS, Shivashankar GV, and Shenoy VB (2019). Regulation of nuclear architecture, mechanics, and nucleocytoplasmic shuttling of epigenetic factors by cell geometric constraints. Proc Natl Acad Sci U S A 116, 13200–13209. - PMC - PubMed
    1. Baron R, and Kneissel M (2013). WNT signaling in bone homeostasis and disease: from human mutations to treatments. Nat Med 19, 179–192. - PubMed
    1. Baryawno N, Przybylski D, Kowalczyk MS, Kfoury Y, Severe N, Gustafsson K, Kokkaliaris KD, Mercier F, Tabaka M, Hofree M, et al. (2019). A cellular taxonomy of the bone marrow stroma in homeostasis and leukemia. Cell 177, 1915–1932. - PMC - PubMed
    1. Bermeo S, Vidal C, Zhou H, and Duque G (2015). Lamin A/C acts as an essential factor in mesenchymal stem cell differentiation through the regulation of the dynamics of the Wnt/beta-catenin pathway. J Cell Biochem 116, 2344–2353. - PubMed
    1. Buxboim A, Swift J, Irianto J, Spinler KR, Dingal PC, Athirasala A, Kao YR, Cho S, Harada T, Shin JW, et al. (2014). Matrix elasticity regulates lamin-A,C phosphorylation and turnover with feedback to actomyosin. Curr Biol 24, 1909–1917. - PMC - PubMed

Publication types

MeSH terms