. 2022 May:59:101456.
doi: 10.1016/j.molmet.2022.101456. Epub 2022 Feb 9.

Skeletal muscle undergoes fiber type metabolic switch without myosin heavy chain switch in response to defective fatty acid oxidation

Affiliations

Skeletal muscle undergoes fiber type metabolic switch without myosin heavy chain switch in response to defective fatty acid oxidation

Andrea S Pereyra et al. Mol Metab. 2022 May.

Abstract

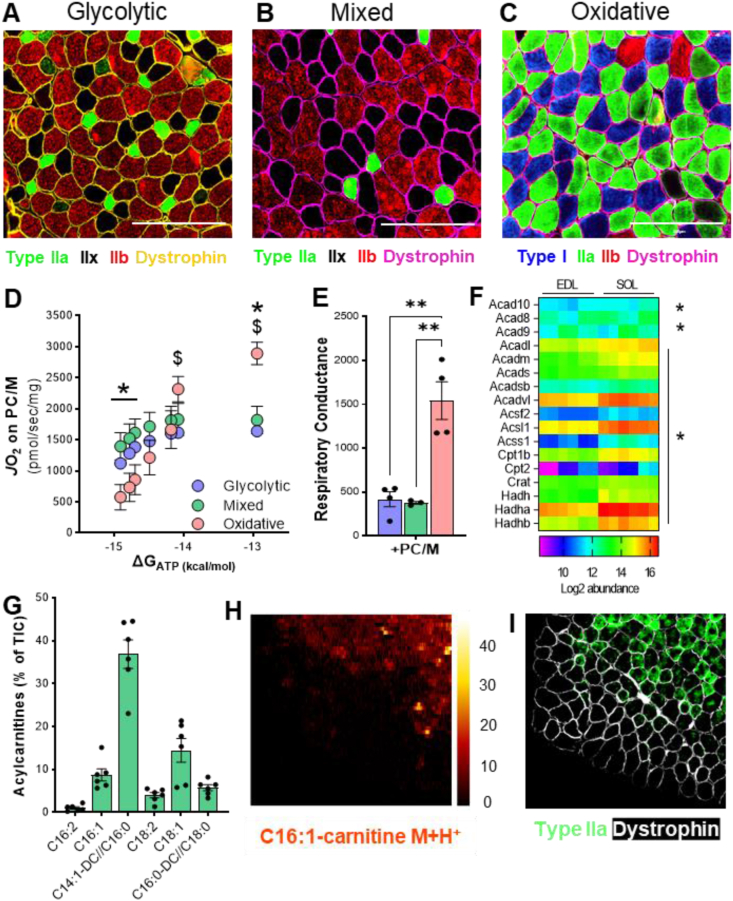
Objective: Skeletal muscle is a heterogeneous and dynamic tissue that adapts to functional demands and substrate availability by modulating muscle fiber size and type. The concept of muscle fiber type relates to its contractile (slow or fast) and metabolic (glycolytic or oxidative) properties. Here, we tested whether disruptions in muscle oxidative catabolism are sufficient to prompt parallel adaptations in energetics and contractile protein composition.

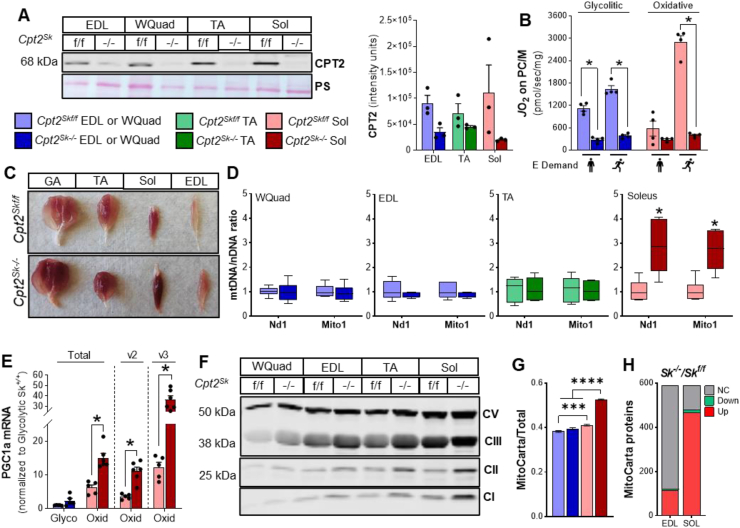
Methods: Mice with defective mitochondrial long-chain fatty acid oxidation (mLCFAO) in the skeletal muscle due to loss of carnitine palmitoyltransferase 2 (Cpt2Sk-/-) were used to model a shift in muscle macronutrient catabolism. Glycolytic and oxidative muscles of Cpt2Sk-/- mice and control littermates were compared for the expression of energy metabolism-related proteins, mitochondrial respiratory capacity, and myosin heavy chain isoform composition.

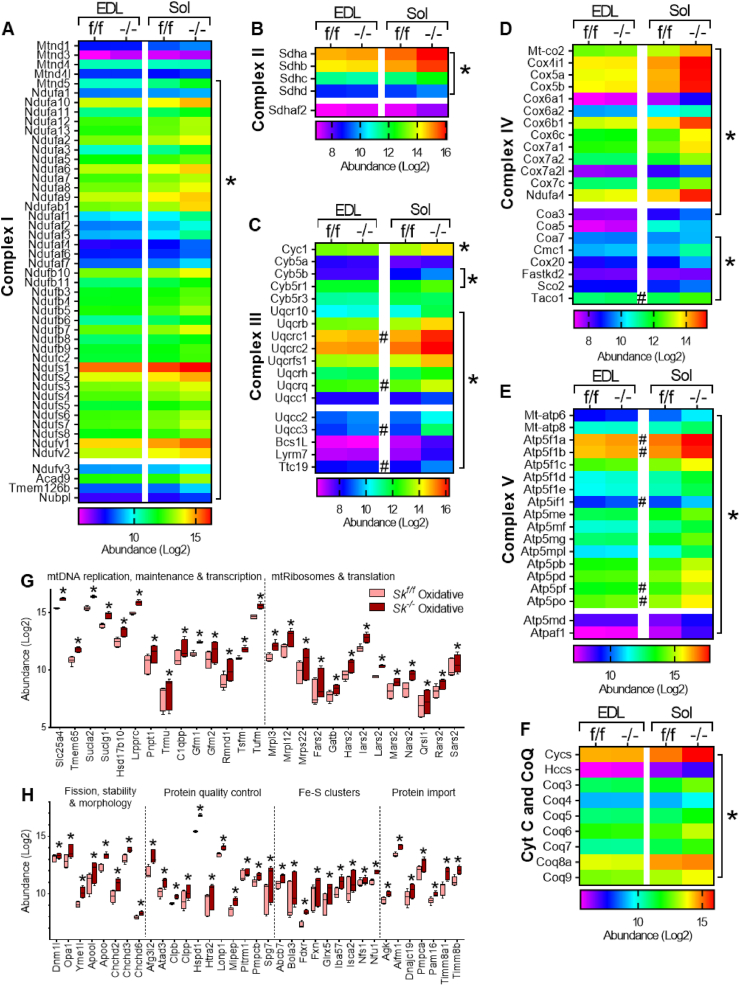
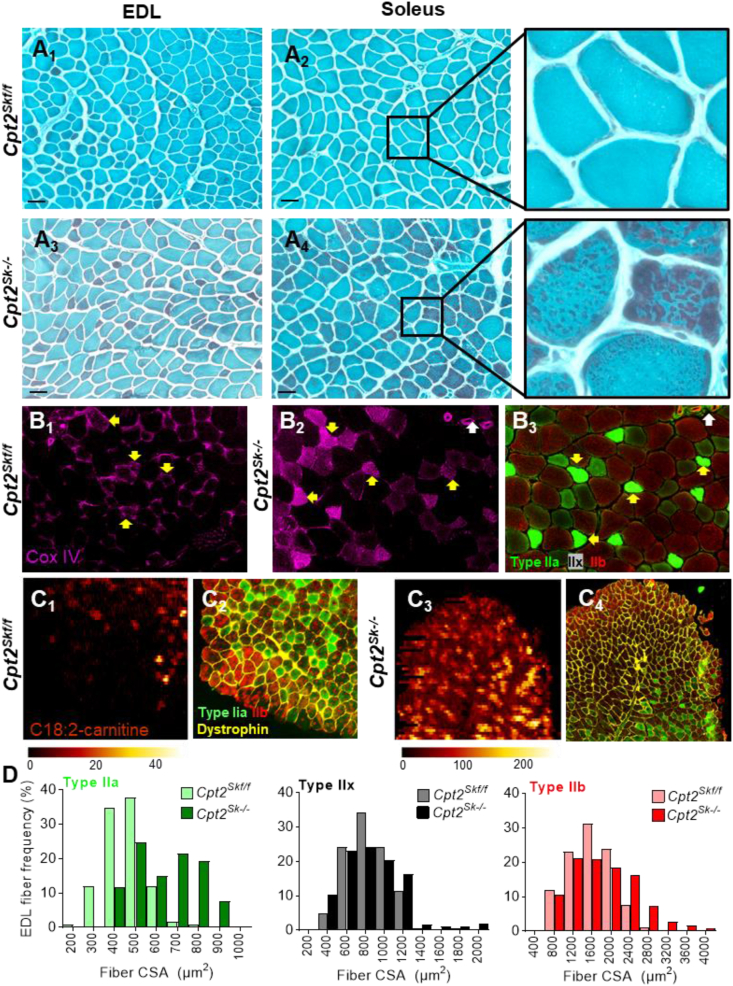
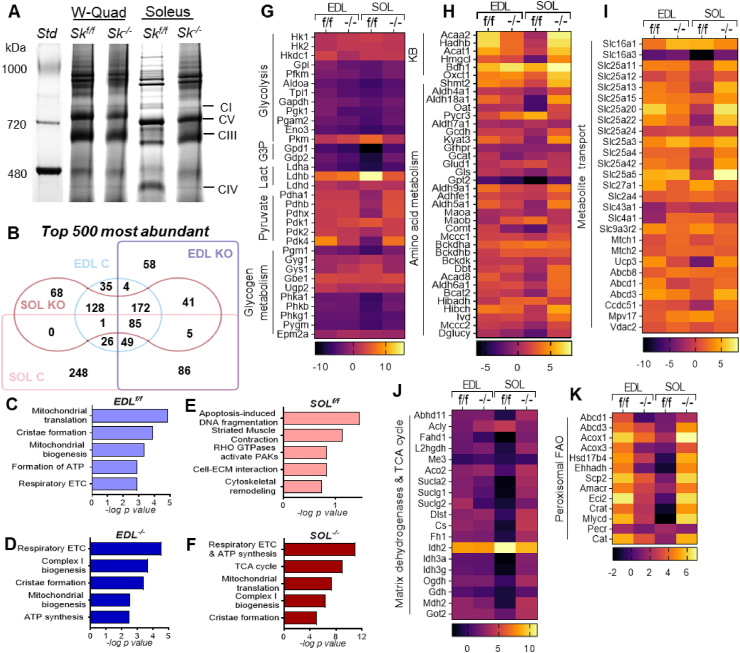
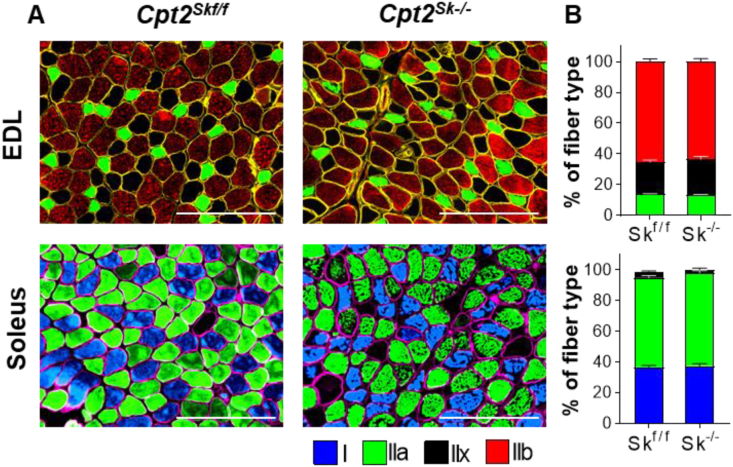
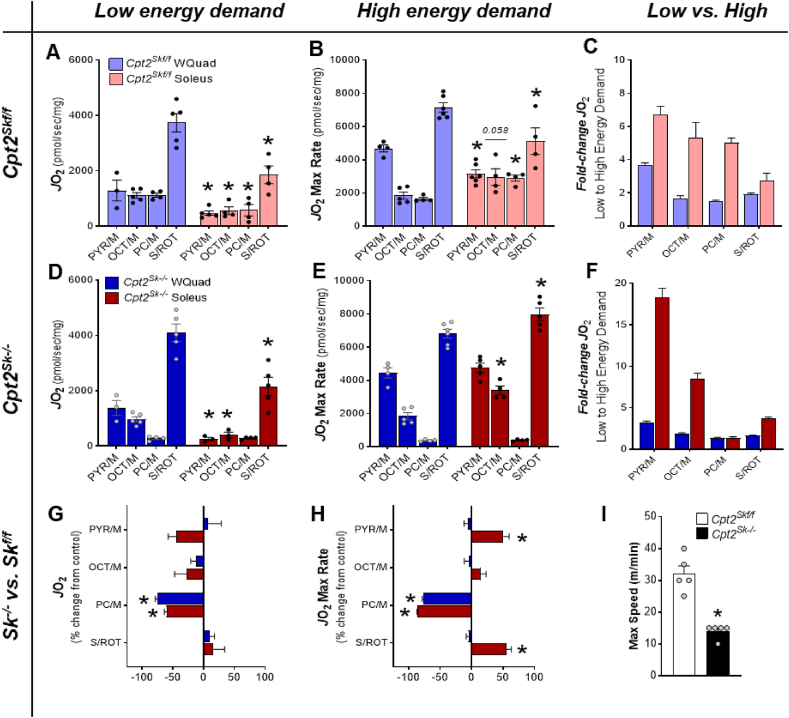
Results: Differences in bioenergetics and macronutrient utilization in response to energy demands between control muscles were intrinsic to the mitochondria, allowing for a clear distinction of muscle types. Loss of CPT2 ablated mLCFAO and resulted in mitochondrial biogenesis occurring most predominantly in oxidative muscle fibers. The metabolism-related proteomic signature of Cpt2Sk-/- oxidative muscle more closely resembled that of glycolytic muscle than of control oxidative muscle. Respectively, intrinsic substrate-supported mitochondrial respiration of CPT2 deficient oxidative muscles shifted to closely match that of glycolytic muscles. Despite this shift in mitochondrial metabolism, CPT2 deletion did not result in contractile-based fiber type switching according to myosin heavy chain composition analysis.

Conclusion: The loss of mitochondrial long-chain fatty acid oxidation elicits an adaptive response involving conversion of oxidative muscle toward a metabolic profile that resembles a glycolytic muscle, but this is not accompanied by changes in myosin heavy chain isoforms. These data suggest that shifts in muscle catabolism are not sufficient to drive shifts in the contractile apparatus but are sufficient to drive adaptive changes in metabolic properties.

Keywords: Bioenergetics; Carnitine palmitoyltransferase 2; Fatty acid oxidation; Fiber-typing; Mitochondrial biogenesis; Skeletal muscle.


Figures

Figure 1
Figure 1
Muscle fiber type composition is a major determinant in fatty acid-supported mitochondrial respiration. (A), (B), (C) Representative imaging of muscle fiber typing via Myosin Heavy Chain (MyHC) immunohistochemistry in predominately glycolytic (EDL), mixed (TA), and oxidative (Soleus) muscles. Magnification 20X. Scale bar 200 μm. (D) Mitochondrial respiration (JO2) across a continuum of ATP free energy (ΔGATP) and (E) respiratory conductance in predominantly glycolytic, mixed, and oxidative muscles energized with palmitoylcarnitine/malate (PC/M). (F) Heatmap of abundance of proteins involved in mitochondrial fatty acid oxidation in glycolytic (EDL) and oxidative (SOL) muscles. (G) Relative abundance of long-chain acylcarnitines (LCACs) in mixed TA muscle. (H) Digital reconstitution of mass spectroscopy-based lipid scanning (nano-DESI) of palmitoleyl-carnitine (C16:1) in mixed TA muscle and (I) immunostaining for myosin heavy chain type 2A (green) and dystrophin (white) on consecutive muscle section. For (D), (E), and (G), data is presented as Mean ± SEM; n = 3–6 and ∗P ≤ 0.05 by 2-way ANOVA. For (F), data is presented as log2 abundance; n = 6 and ∗P ≤ 0.05 of adjusted p-value calculated by Benjamini Hochberg FDR correction.
Figure 2
Figure 2
Loss of carnitine palmitoyltransferase 2 in skeletal muscle prevents mLCFAO and induces mitochondrial biogenesis. (A) Western blot for CPT2 on glycolytic (EDL and White Quadriceps), mixed (TA), and oxidative (Soleus) muscle homogenates (representative image and quantitation). (B) Mitochondrial respiration (JO2) at minimum (standing icon) and maximum (running icon) energy demands in predominantly glycolytic and oxidative muscles energized with palmitoylcarnitine/malate (PC/M). (C) Representative image of Gastrocnemius (GA), Tibialis Anterior (TA), Soleus (Sol), and Extensor Digitorium Longus muscles from control (top row) and Cpt2Sk−/− (bottom row) mice. (D) Quantitation of mitochondrial DNA (mtDNA) by levels of NADH Dehydrogenase 1 (Nd1), and Mito1 relative to nuclear DNA (nDNA) in different muscles of control and Cpt2Sk−/− mice. (E) Relative mRNA levels of PCG1α total, variant 2 (v2), and variant 3 (v3) in glycolytic and oxidative muscles from control and Cpt2Sk−/− mice. (F) Western blot for individual subunits of the mitochondrial OXPHOS complexes. (G) Enrichment of MitoCarta 3.0 positive proteins relative to the muscle total proteome as determined by quantitative proteomics in glycolytic (EDL) and oxidative (Soleus) muscle. (H) Differential expression of MitoCarta 3.0 positive proteins between control and Cpt2Sk−/− in glycolytic (EDL) and oxidative (SOL) muscles. Data is presented as Mean ± SEM except for (D) which also displays min and max values. For (B), (D), and (E), n = 4–6 and ∗P ≤ 0.05 by 2-way ANOVA. For (G), n = 6 and ∗P ≤ 0.05 by 1-way ANOVA.
Figure 3
Figure 3
CPT2 deficiency triggers major mitochondrial response in a muscle-type-specific manner. (A), (B), (C), (D), (E), (F) Heatmaps of expression abundance of proteins related to electron transport chain complexes subunits and assembly factors in glycolytic (EDL) and oxidative (Sol) muscles of control and Cpt2Sk−/− mice. (G), (H) Abundance of proteins involved in mitochondrial processes in control and Cpt2Sk−/− oxidative muscle. For (A) to (F), data is presented as an average of 6 biological replicates. For (G) and (H), data is presented as Median with Min and Max values; n = 6. #Adjusted p-value P ≤ 0.05 for EDL between genotypes and ∗ adjusted p-value P ≤ 0.05 for Soleus between genotypes as calculated by Benjamini Hochberg FDR correction.
Figure 4
Figure 4
Differential muscle mitochondrial biogenesis, acylcarnitine accumulation, and fiber enlargement in Cpt2Sk−/−mice is fiber-type-specific. (A1 to A4) Representative Gomori staining of mitochondria (red) in muscle fibers (light blue) of glycolytic (EDL) and oxidative (Soleus) muscles for both genotypes. Far-right column contains magnified images of A2 and A4. Magnification 20X. Scale bar = 100 μm. (B) cytochrome c oxidase protein (COX IV) immunodetection of (B1) control and (B2) Cpt2Sk−/− EDL muscle and (B3) matched myosin heavy chain immunodetection of Cpt2Sk−/− EDL. White arrows indicate the same anatomic structure in B2 and B3. Yellow arrows indicate type IIa myofibers. (C) Digital reconstitution of mass spectroscopy-based lipid scanning (nano-DESI) of linoleoyl-carnitine (C18:2) and matched myosin heavy chain immunodetection of Control (C1,2) and Cpt2Sk−/− (C3,4) TA muscle. (D) Distribution of fiber cross-sectional area (CSA) of control and Cpt2Sk−/− EDL analyzed for Type IIa, IIx, and IIb fibers independently. Data is presented here as the mean of 3 biological replicates per fiber type and genotype.
Figure 5
Figure 5
Loss of CPT2 shifts oxidative muscle proteome towards a glycolytic-like protein signature. (A) Representative image of Native-PAGE of mitochondria lysates to demonstrate OXPHOS complexes in control and Cpt2Sk−/− muscles. (B) Venn diagram demonstrating overlap among the top-500 most abundant proteins in glycolytic (EDL) and oxidative (Soleus) muscle from control and Cpt2Sk−/− mice. (C–F) Pathway analysis for the top-500 most abundant proteins arranged by -log p value. (G–K) Heatmaps of abundance of proteins relative to the tissue mean related to macronutrient catabolism and metabolite transport in glycolytic (EDL) and oxidative (SOL) muscles of control and Cpt2Sk−/− mice; data is presented as average of 6 biological replicates per muscle type and genotype.
Figure 6
Figure 6
CPT2 deficiency does not induce myosin heavy chain isoform switching. (A) Representative images and (B) quantification of control and Cpt2Sk−/− muscles by immunofluorescent detection of myosin heavy chain isoforms: MyHC-β (Type I, blue), MyHC-2B (Type IIb, red), MyHC-2A (Type IIa, green), or no stain (Type IIx, black). Myofiber perimeter is demonstrated with dystrophin (yellow or pink). EDL, extensor digitorum longus. Data are presented as mean ± SEM. N = 3. Magnification 20X. Scale bar = 200 μm.
Figure 7
Figure 7
Bioenergetic adaptations in Cpt2Sk−/−oxidative muscles result in a glycolytic metabolic phenotype. (A) Maximum rates of substrate-supported oxygen consumption (JO2) in isolated mitochondria from control glycolytic and oxidative muscles under low energy demands; PC = palmitoylcarnitine, OCT = octanoylcarnitine, PYR = pyruvate, S = succinate, M = malate, and ROT = rotenone. (B) Same as A but under high energy demands. (C) Oxygen consumption fold-change from low to high energy demands in control glycolytic and oxidative muscle mitochondria. (D) Same as A for mitochondria isolated from Cpt2Sk−/− glycolytic and oxidative muscles. (E) Same as D under high energy demands. (F) Same as C for Cpt2Sk−/− mitochondria. (G) Comparison of mitochondrial oxygen consumption rates at low energy demands between genotypes for glycolytic and oxidative muscles presented as Cpt2Sk−/− percentage change from control. (H) Same as G under high energy demands. (I) Max speed reached during a high-intensity treadmill-based exercise test. All data are presented as Mean ± SEM. For (A) to (F), n = 3–6 and ∗P ≤ 0.05 by T-test between glycolytic and oxidative muscle mitochondria for each substrate within the same genotype. For (G) and (H), n = 3–6 and ∗P ≤ 0.05 by T-test between control and Cpt2Sk−/− muscle mitochondria for each substrate within the same energy demand. For (I) n = 5 and ∗P ≤ 0.05 by T-test between genotypes.

References

    1. Blaauw B., Schiaffino S., Reggiani C. Mechanisms modulating skeletal muscle phenotype. Comprehensive Physiology. 2013;3(4):1645–1687. - PubMed
    1. Schiaffino S., Reggiani C. Fiber types in mammalian skeletal muscles. Physiological Reviews. 2011;91(4):1447–1531. - PubMed
    1. Venhoff N., Lebrecht D., Pfeifer D., Venhoff A.C., Bissé E., Kirschner J., et al. Muscle-fiber transdifferentiation in an experimental model of respiratory chain myopathy. Arthritis Research and Therapy. 2012;14(5):R233. - PMC - PubMed
    1. Pereyra AS, Harris KL, Soepriatna AH, Waterbury QA, Bharathi SS, Zhang Y, et al. Octanoate is differentially metabolized in liver and muscle and fails to rescue cardiomyopathy in CPT2 deficiency. The Journal of Lipid Research. 2021:100069. - PMC - PubMed
    1. Pereyra A.S., Rajan A., Ferreira C.R., Ellis J.M. Loss of muscle carnitine palmitoyltransferase 2 prevents diet-induced obesity and insulin resistance despite long-chain acylcarnitine accumulation. Cell Reports. 2020;33(6):108374. - PMC - PubMed

Publication types