. 2022 Mar 8;55(3):542-556.e5.
doi: 10.1016/j.immuni.2022.01.017. Epub 2022 Jan 26.

Immuno-proteomic profiling reveals aberrant immune cell regulation in the airways of individuals with ongoing post-COVID-19 respiratory disease

Affiliations

Immuno-proteomic profiling reveals aberrant immune cell regulation in the airways of individuals with ongoing post-COVID-19 respiratory disease

Bavithra Vijayakumar et al. Immunity. .

Abstract

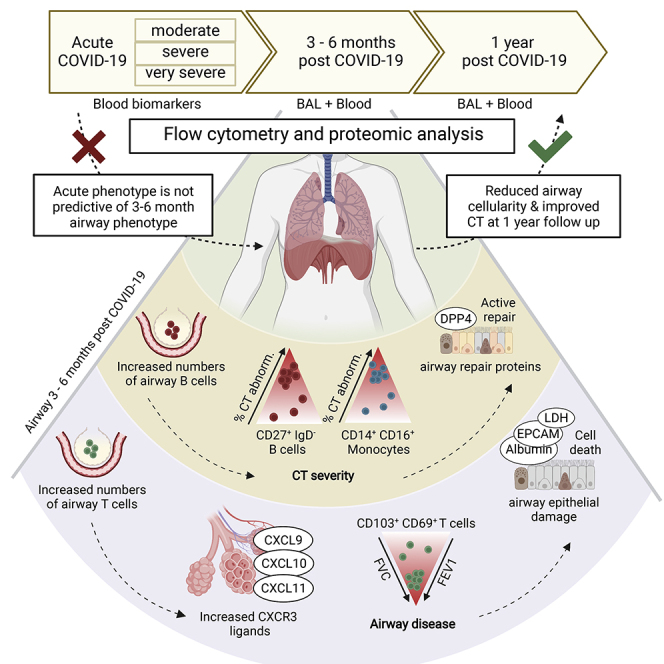
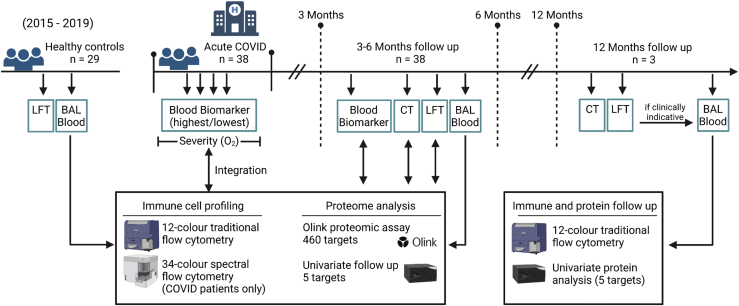
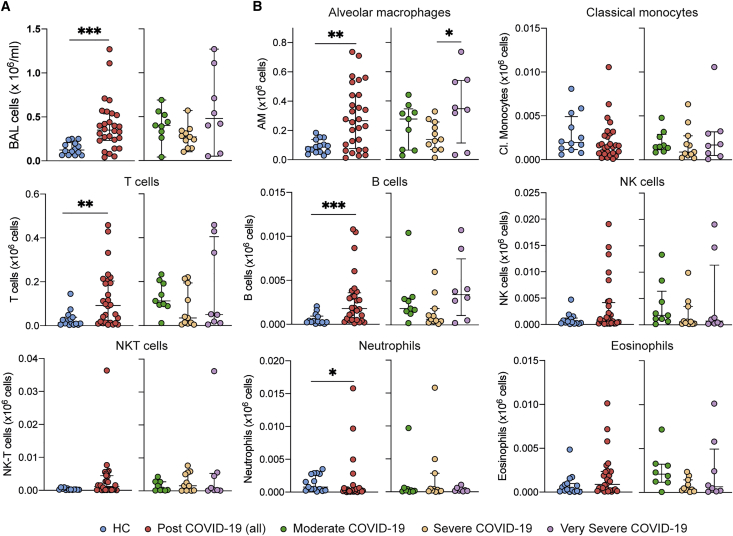
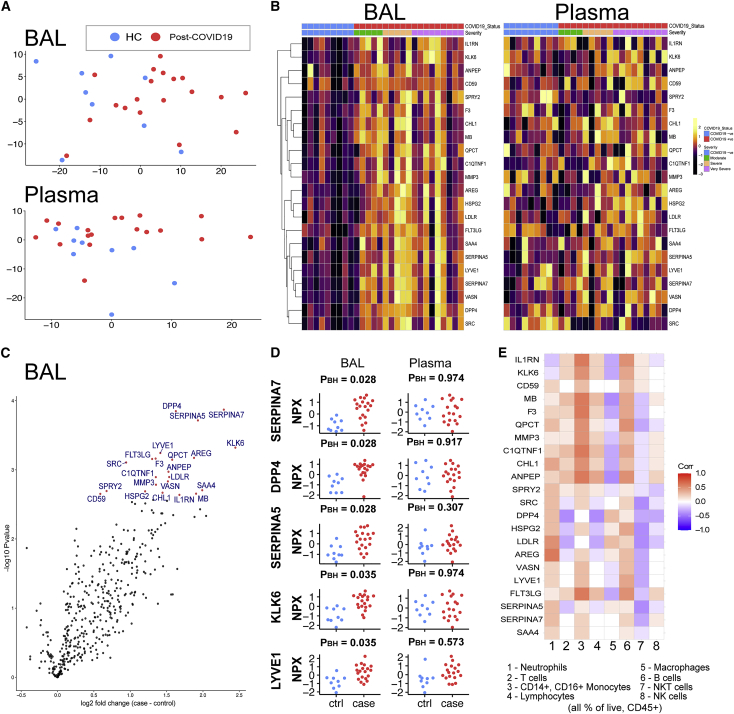
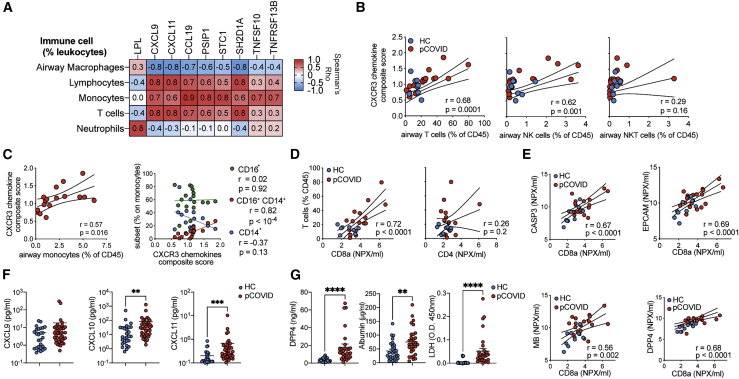
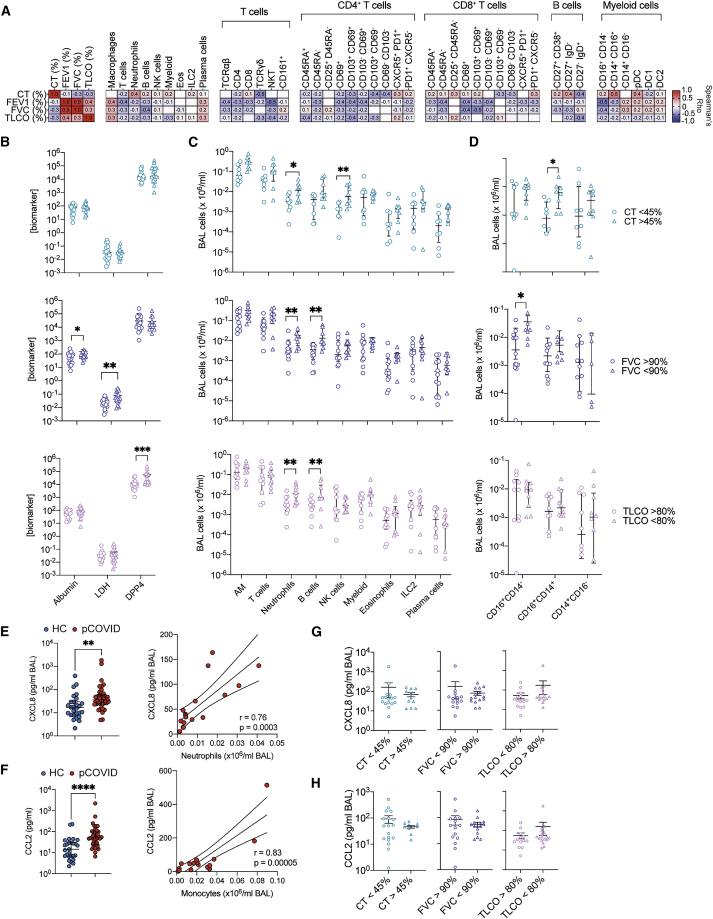
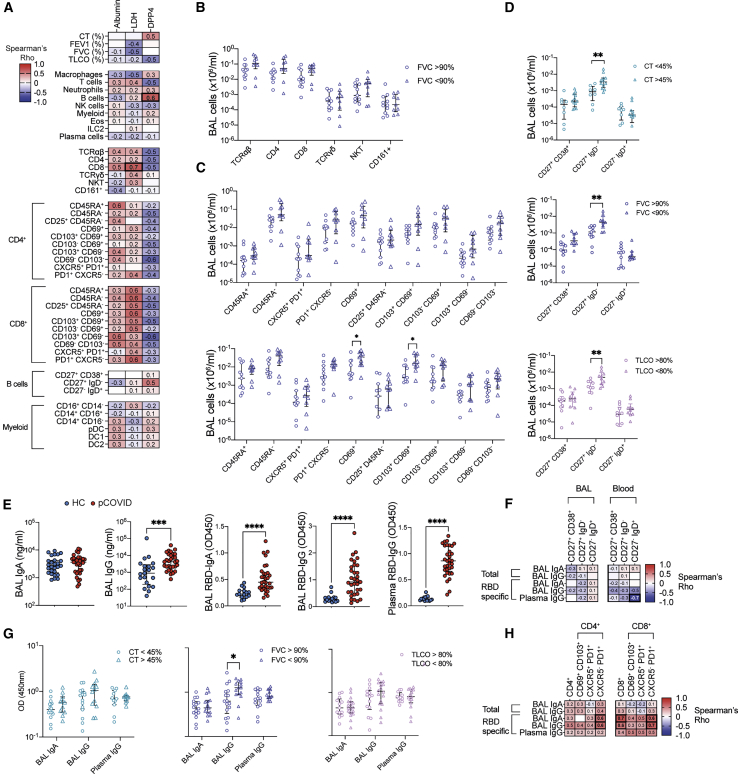
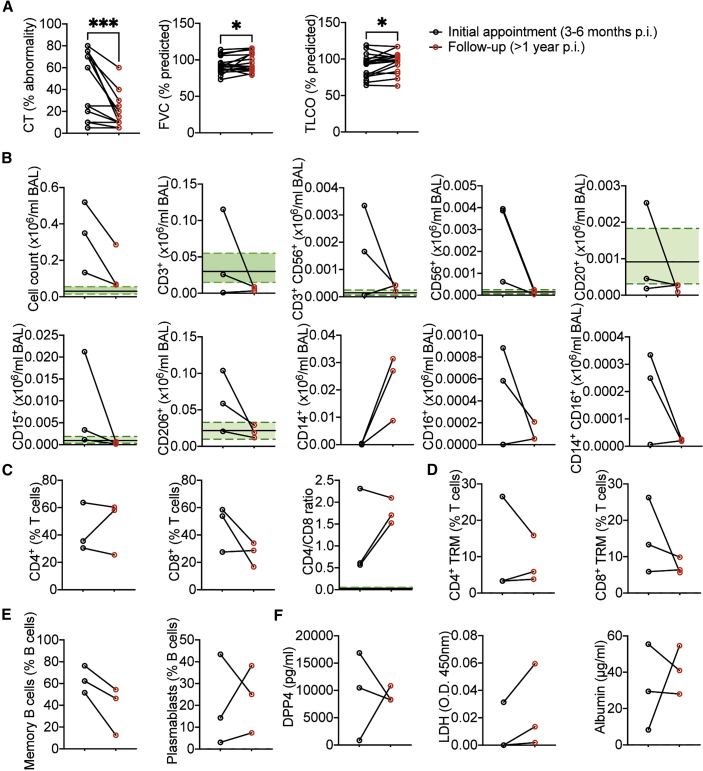
Some patients hospitalized with acute COVID-19 suffer respiratory symptoms that persist for many months. We delineated the immune-proteomic landscape in the airways and peripheral blood of healthy controls and post-COVID-19 patients 3 to 6 months after hospital discharge. Post-COVID-19 patients showed abnormal airway (but not plasma) proteomes, with an elevated concentration of proteins associated with apoptosis, tissue repair, and epithelial injury versus healthy individuals. Increased numbers of cytotoxic lymphocytes were observed in individuals with greater airway dysfunction, while increased B cell numbers and altered monocyte subsets were associated with more widespread lung abnormalities. A one-year follow-up of some post-COVID-19 patients indicated that these abnormalities resolved over time. In summary, COVID-19 causes a prolonged change to the airway immune landscape in those with persistent lung disease, with evidence of cell death and tissue repair linked to the ongoing activation of cytotoxic T cells.

Keywords: COVID-19; SARS-CoV-2; T cells; airways; long COVID; proteomics; respiratory tract; respiratory viral infection; tissue-resident memory.


Conflict of interest statement

Declaration of interests The authors declare no competing interests.

Figures

None
Graphical abstract
Figure 1
Figure 1
Schematic of techniques performed on airway and blood samples Schematic showing samples collected from healthy control donors (recruited 2015–2019 pre COVID-19) and from COVID-19 patients. COVID-19 patients were recruited for this study if presenting with ongoing respiratory symptoms 3 months post hospital discharge and CT and LFT were performed. Bronchoscopy was performed when clinically indicative (n = 38). Peripheral blood for subsequent analysis was obtained at time of bronchoscopy. Blood biomarker tests were performed during hospitalization and at the first follow-up visit. Immune cell profiling and proteome analysis was performed on airway (BAL) and peripheral blood (plasma) samples from healthy controls and post COVID-19 patients (3–6 months post hospitalization) using traditional and spectral flow cytometry, Olink high-throughput proteomic assay and univariate protein analysis. Immune and proteome data were integrated with acute severity and blood biomarkers during hospitalization and at first follow-up. Patients were followed-up to 12 months post-discharge. When clinically indicative a bronchoscopy was performed at this time point (n = 3). Immune cell and univariate protein analyses were performed on airway and peripheral blood (plasma) samples at this time point. LFT, lung function test; BAL, bronchoalveolar lavage; CT, computed tomography scan.
Figure 2
Figure 2
Immune cell profile is altered in post-COVID-19 BAL over 80 days after discharge (A) Left: total number of cells in BAL from healthy controls and post COVID-19 patients. Right: total number of cells in BAL from post-COVID-19 patients, stratified according to severity of the acute illness. (B) Total cell numbers of immune populations (×106/mL) in BAL from healthy controls and post-COVID-19 patients, based on gating shown in STAR Methods and Figure 1. (A and B) Data are presented as mean ± SEM. Healthy controls, n = 16; post-COVID-19 patients, n = 28, moderate n = 9, severe n = 11, very severe n = 8. Statistical significance was tested by Mann-Whitney U test or one-way ANOVA + Tukey’s multiple comparison test. p < 0.05, ∗∗p < 0.01, ∗∗∗p < 0.005. See also Figure S1.
Figure 3
Figure 3
A distinct proteome is present in the post-COVID-19 airway 436 proteins in BAL and plasma were measured using Olink immunoassays in post-COVID-19 patients (n = 19) and healthy controls (n = 9). (A) Principal component analysis (PCA) of BAL and plasma proteomes: each point represents a sample. (B) Left: heatmap displaying Z score normalized protein abundance for the 22 proteins that were significantly differentially abundant (5% FDR) between post-COVID-19 and healthy controls in BAL. Samples have been ordered by case control status and then by peak severity during acute COVID-19 infection. Proteins are ordered by hierarchical clustering. Right: heatmap for these same 22 proteins in plasma, presented in the same order as for BAL. (C) Volcano plot showing differentially protein abundance analysis between post-COVID-19 patients and healthy controls in BAL. Nominal −log10 p values are shown. Significantly differentially abundant proteins (5% FDR) are colored in red and labeled. (D) BAL and plasma normalized protein abundance (NPX) expression for the 5 most significantly differentially abundance proteins between post-COVID-19 patients and healthy controls. PBH, Benjamini-Hochberg adjusted p values. (E) Correlation between the 22 differentially abundant proteins (from the analysis of post-COVID-19 versus HC) and immune cell frequency in BAL. See also Figures S2–S5.
Figure 4
Figure 4
CXCR3 ligands and markers of epithelial damage correlate with CD8 T cells numbers in the airways BAL immune cells and protein concentrations were analyzed post-COVID-19 infection. (A) Heatmap displaying the relationship between proteins and immune cell frequencies. The proteins and immune cell traits displayed are those with at least one significant (5% FDR) association from linear regression analyses (see Table S2K). (B and C) For each sample, protein concentrations for CXCL9, CXCL 10, and CXCL 11 were normalized to the median concentration in healthy controls. For each sample, the mean of the normalized values for the 3 proteins was calculated to provide a summary metric for CXCR3 chemokines. This was then plotted against versus (B) T, NK, and NKT proportions in post-COVID-19 patients and healthy controls and (C) monocyte frequencies and subsets in post-COVID-19 patients only. (D) BAL T cell frequency versus CD4 and CD8a concentrations as measured by Olink. (E) CD8a concentration versus CASP3, EPCAM, MB, and DPP4 in the airways. (F) CXCL9, CXCL10, and CXCL11 concentration in in the BAL were measure by legendplex. (G) DPP4, albumin, and LDH concentrations in the BAL determined by ELISA. Data are presented as median ± IQR. (A) Pearsons correlation of n = 19 post-COVID-19 patients, the r value is shown. (B–E) Each point represents an individual patient, linear regression line ±95% confidence intervals are depicted, and r and p values from Pearsons correlation are stated. (F and G) Represents n = 38 post-COVID-19 and n = 20 healthy control individuals. Statistics were conducted using Mann-Whitney U test. p < 0.05, ∗∗p < 0.01, ∗∗∗p < 0.005, ∗∗∗∗p < 0.001. pCOVID = post-COVID-19.
Figure 5
Figure 5
Distinct airway proteomic and immune cell phenotypes correlate with distinct indicators of respiratory pathology post-COVID (A) Immune cell proportions in the BAL, as a percentage of total leukocytes, BAL albumin (μg/mL), LDH (OD450), and DPP4 (ng/mL) were correlated with CT (% abnormality) or FEV1, FVC, and TLCO (% of predicted normal). Spearman’s rho is displayed as a heatmap. (B) Albumin (μg/mL), LDH (OD450), and DPP4 (ng/mL) in the BAL segregated by CT abnormality (%), predicted FVC (%), and predicted TLCO (%). (C) The number of major immune cell population per mL of BAL versus CT abnormality, FVC, and TLCO. (D) Total number of monocyte subsets per mL BAL was segregated by CT, FVC, and TCLO. (E) BAL CXCL8 (pg/mL) measured by Legendplex in HC and post-COVID-19 patients and correlated versus total neutrophil numbers (per mL/BAL). (F) BAL CXCL8 (pg/mL) measured by legendplex in post COVID-19 patients segregated by CT abnormality (%), predicted FVC (%), and predicted TLCO (%). (G) BAL CCL2 (pg/mL) measured by legendplex in HC and post COVID-19 patients and correlated versus myeloid cells (CD11b+) in the BAL. (H) BAL CCL2 (pg/mL) measured by legendplex in post COVID-19 patients segregated by CT abnormality (%), predicted FVC (%), and predicted TLCO (%). Where applicable individual points are shown, and data are presented as median ± IQR. Each point represents an individual patient. Statistical significance for (B–H) was tested by Mann-Whitney U test. Benjamini-Hochberg adjusted (5% FDR) p values p < 0.05, ∗∗p < 0.01, ∗∗∗p < 0.005, ∗∗∗∗p < 0.001. Pearson’s correlations were performed in (E and G), r and p values are shown, as is a line of best fit ±95% confidence intervals. See Figures S6 and S7.
Figure 6
Figure 6
Increased airway T cell and B cell abundance is associated with more severe ongoing respiratory pathophysiology post-COVID-19 (A) Immune cell proportions in the BAL, as a percentage of total leukocytes, BAL albumin (μg/mL), LDH (OD450), and DPP4 (ng/mL) were correlated with BAL albumin, LDH, and DPP4 concentrations. (B and C) (B) BAL T cell subtypes and (C) subsets of CD4 and CD8 T cells were analyzed against FVC. (D) B cells subsets numbers per mL BAL segregated by CT, FVC, and TLCO. (E) Total and RBD-specific IgA and IgG were measured in the BAL and plasma. (F) Antibody concentrations were correlated with BAL and plasma B cell subsets of total leukocytes. (G) Antibody concentrations measured in BAL and plasma segregated by CT, FVC, and TLCO. (H) Antibody concentrations were correlated with BAL CD4 and CD8 T cells and their subsets as a proportion of total leukocytes. (A, F, and H) Spearman correlation. Correlations p < 0.05 after Benjamini-Hochberg adjustment for an FDR of 5% are indicated by thickened boxes. (B–E and G) was tested by Mann-Whitney U test. Benjamini-Hochberg adjusted (5% FDR) p < 0.05, ∗∗p < 0.01, ∗∗∗p < 0.005, ∗∗∗∗p < 0.001. (A, F, and G) are display Spearman’s rho correlation.
Figure 7
Figure 7
Reduced cellularity is observed in the airways 1 year after initial bronchoscopy post-COVID-19 (A) % lung CT abnormality or predicted FVC (%) or TLCO (%) at first appointment and 1 year follow up (n = 17 pCOVID-19 patients). (B) Total cell counts and cell counts of lymphocyte populations, macrophages, neutrophils, and monocyte subsets in the BAL. (C and D) (C) Proportions of T cell subsets and (D) CD4 and CD8 CD69+ CD103+ as a proportion of BAL T cells. (E) Proportions of memory (CD27+IgD) and plasmablasts (CD27+CD38+) of CD20+ B cells in the BAL. (F) DPP4, LDH, and albumin measurements in BAL. All data depict first bronchoscopy between 3–6 months post discharge and at 1 year post discharge. Each point represents a single patient. (B–E) Represent n = 3 patients. Green shading indicates median ± IQR for proportions of populations and mediator concentration observed in healthy airways. (A) Wilcoxon matched-pair signed rank test. p < 0.05, ∗∗∗p < 0.001.

References

    1. Ali M.F., Egan A.M., Shaughnessy G.F., Anderson D.K., Kottom T.J., Dasari H., Van Keulen V.P., Aubry M.C., Yi E.S., Limper A.H., et al. Antifibrotics modify B-cell-induced fibroblast migration and activation in patients with idiopathic pulmonary fibrosis. Am. J. Respir. Cell Mol. Biol. 2021;64:722–733. - PMC - PubMed
    1. Allden S.J., Ogger P.P., Ghai P., McErlean P., Hewitt R., Toshner R., Walker S.A., Saunders P., Kingston S., Molyneaux P.L., et al. The transferrin receptor CD71 delineates functionally distinct airway macrophage subsets during idiopathic pulmonary fibrosis. Am. J. Respir. Crit. Care Med. 2019;200:209–219. - PMC - PubMed
    1. Arunachalam P.S., Wimmers F., Mok C.K.P., Perera R.A.P.M., Scott M., Hagan T., Sigal N., Feng Y., Bristow L., Tak-Yin Tsang O., et al. Systems biological assessment of immunity to mild versus severe COVID-19 infection in humans. Science. 2020;369:1210–1220. - PMC - PubMed
    1. Asai Y., Chiba H., Nishikiori H., Kamekura R., Yabe H., Kondo S., Miyajima S., Shigehara K., Ichimiya S., Takahashi H. Aberrant populations of circulating T follicular helper cells and regulatory B cells underlying idiopathic pulmonary fibrosis. Respir. Res. 2019;20:244. - PMC - PubMed
    1. Boyd D.F., Allen E.K., Randolph A.G., Guo X.J., Weng Y., Sanders C.J., Bajracharya R., Lee N.K., Guy C.S., Vogel P., et al. Exuberant fibroblast activity compromises lung function via ADAMTS4. Nature. 2020;587:466–471. - PMC - PubMed

Publication types