

Estimating naloxone need in the USA across fentanyl, heroin, and prescription opioid epidemics: a modelling study
- PMID: 35151372
- PMCID: PMC10937095
- DOI: 10.1016/S2468-2667(21)00304-2
Estimating naloxone need in the USA across fentanyl, heroin, and prescription opioid epidemics: a modelling study
Abstract
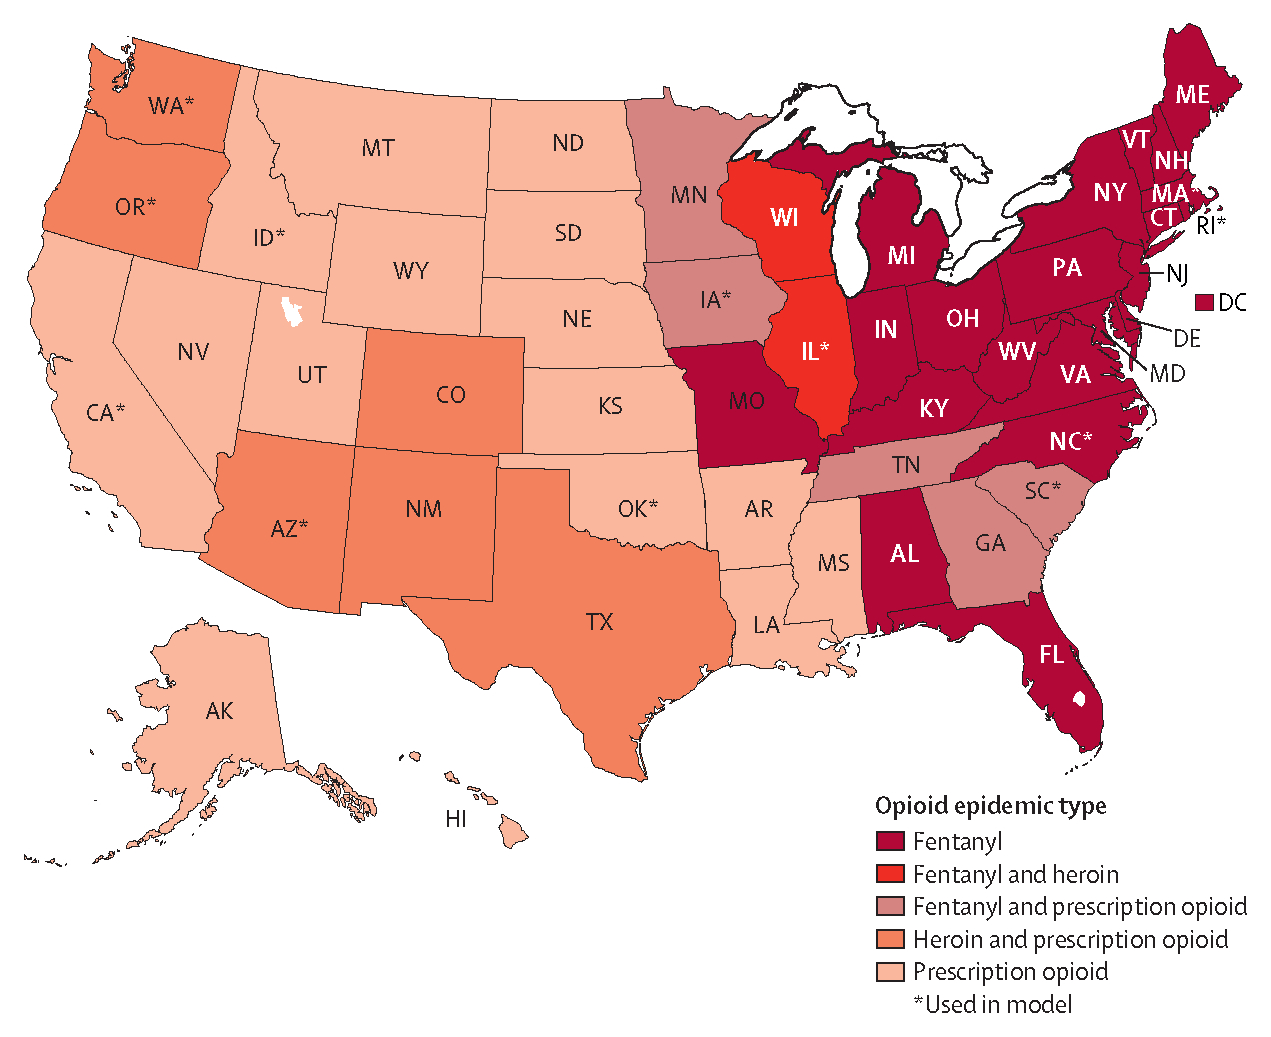
Background: The US overdose crisis is driven by fentanyl, heroin, and prescription opioids. One evidence-based policy response has been to broaden naloxone distribution, but how much naloxone a community would need to reduce the incidence of fatal overdose is unclear. We aimed to estimate state-level US naloxone need in 2017 across three main naloxone access points (community-based programmes, provider prescription, and pharmacy-initiated distribution) and by dominant opioid epidemic type (fentanyl, heroin, and prescription opioid).
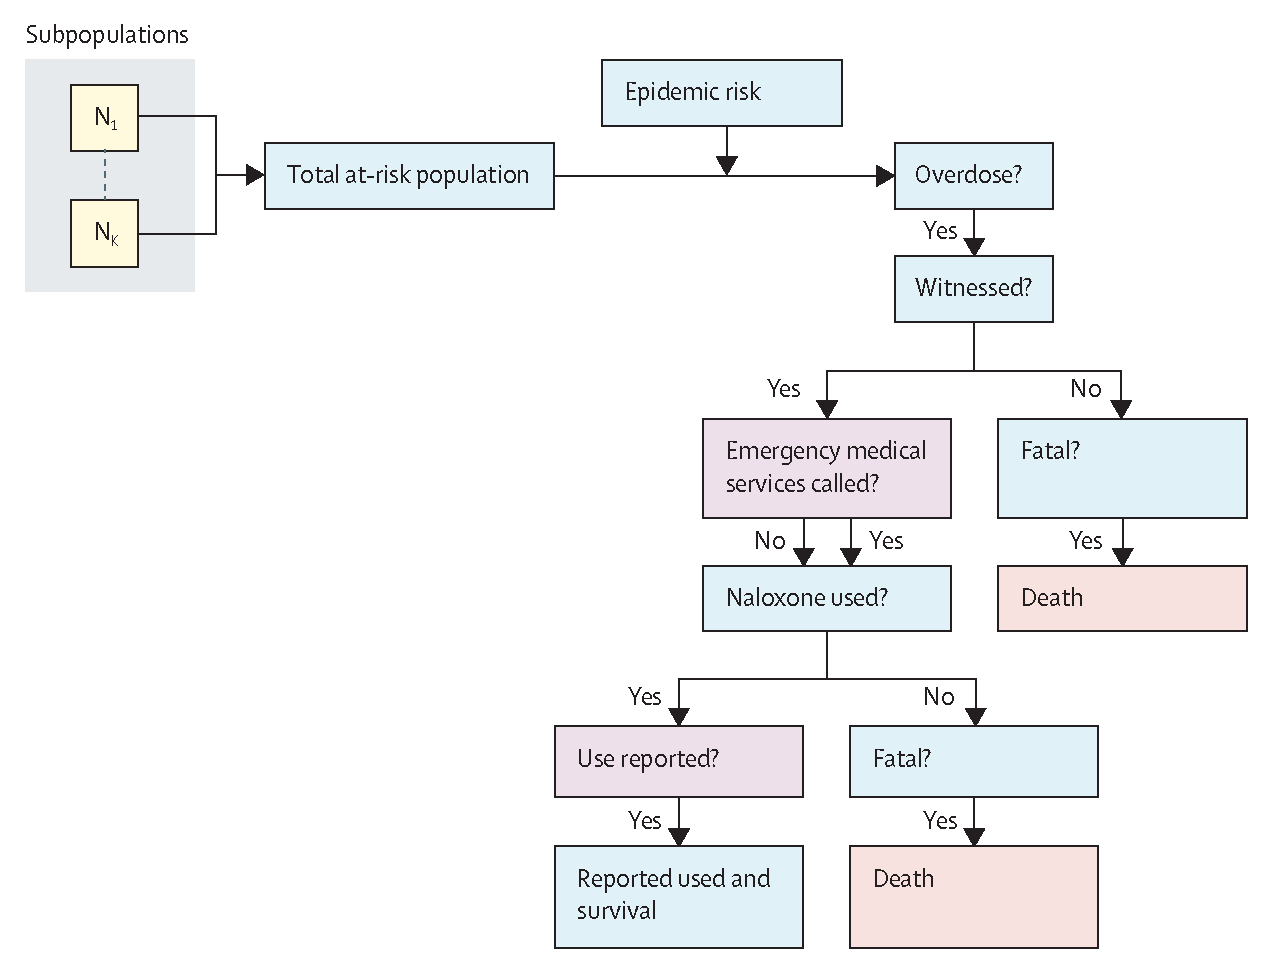
Methods: In this modelling study, we developed, parameterised, and applied a mechanistic model of risk of opioid overdose and used it to estimate the expected reduction in opioid overdose mortality after deployment of a given number of two-dose naloxone kits. We performed a literature review and used a modified-Delphi panel to inform parameter definitions. We refined an established model of the population at risk of overdose by incorporating changes in the toxicity of the illicit drug supply and in the naloxone access point, then calibrated the model to 2017 using data obtained from proprietary data sources, state health departments, and national surveys for 12 US states that were representative of each epidemic type. We used counterfactual modelling to project the effect of increased naloxone distribution on the estimated number of opioid overdose deaths averted with naloxone and the number of naloxone kits needed to be available for at least 80% of witnessed opioid overdoses, by US state and access point.
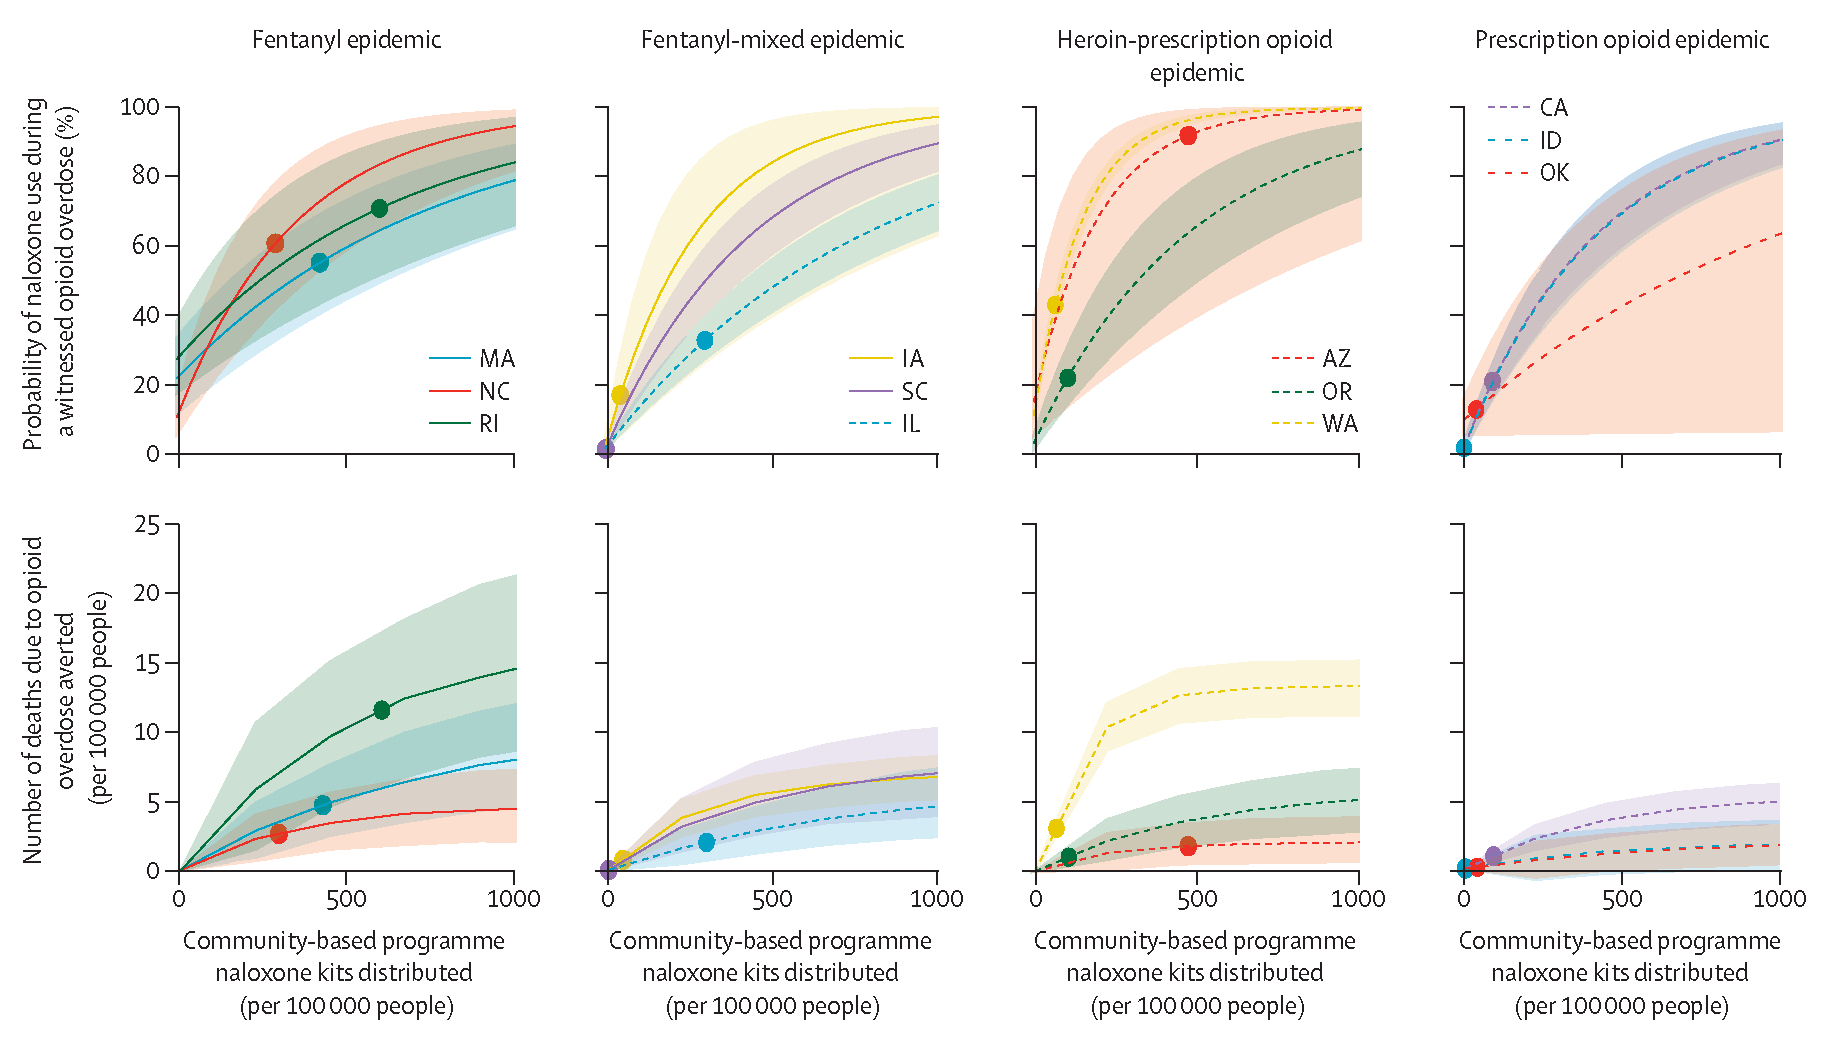
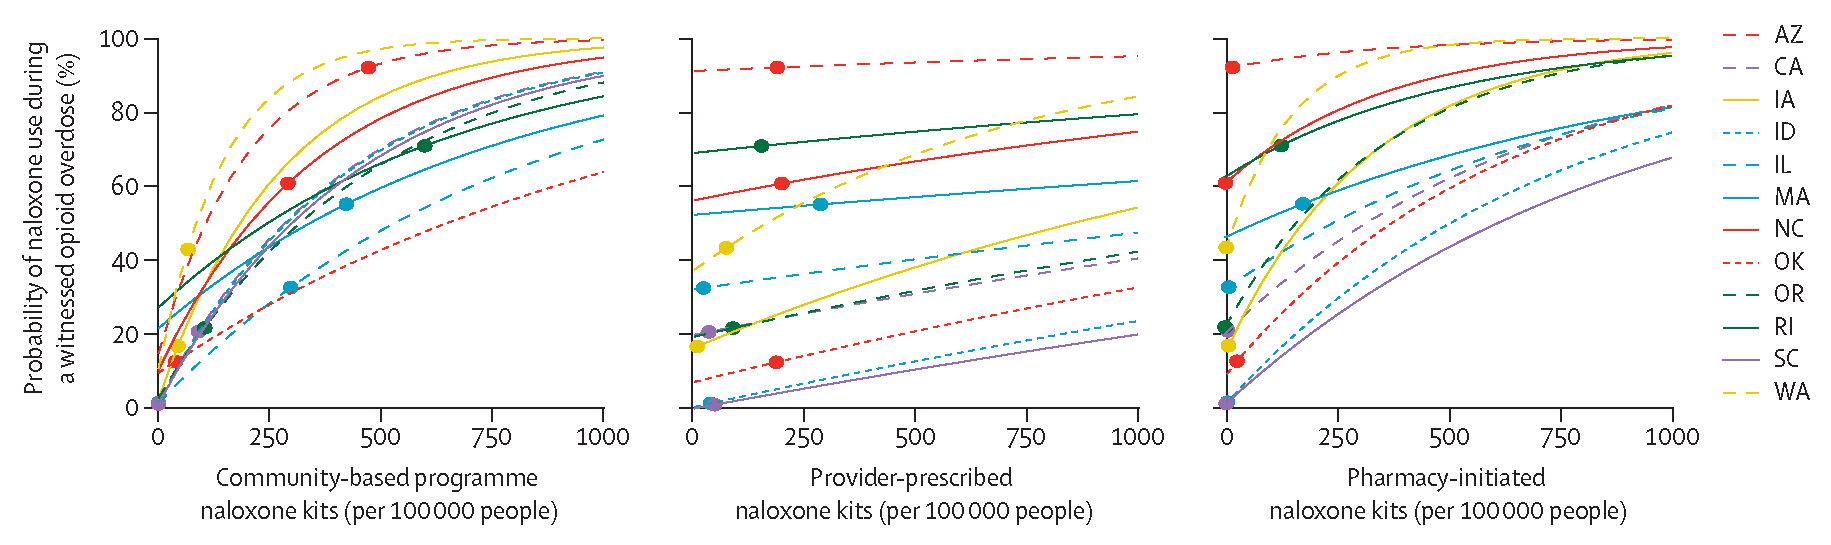
Findings: Need for naloxone differed by epidemic type, with fentanyl epidemics having the consistently highest probability of naloxone use during witnessed overdose events (range 58-76% across the three modelled states in this category) and prescription opioid-dominated epidemics having the lowest (range 0-20%). Overall, in 2017, community-based and pharmacy-initiated naloxone access points had higher probability of naloxone use in witnessed overdose and higher numbers of deaths averted per 100 000 people in state-specific results with these two access points than with provider-prescribed access only. To achieve a target of naloxone use in 80% of witnessed overdoses, need varied from no additional kits (estimated as sufficient) to 1270 kits needed per 100 000 population across the 12 modelled states annually. In 2017, only Arizona had sufficient kits to meet this target.
Interpretation: Opioid epidemic type and how naloxone is accessed have large effects on the number of naloxone kits that need to be distributed, the probability of naloxone use, and the number of deaths due to overdose averted. The extent of naloxone distribution, especially through community-based programmes and pharmacy-initiated access points, warrants substantial expansion in nearly every US state.
Funding: National Institute of Health, National Institute on Drug Abuse.
Copyright © 2022 The Author(s). Published by Elsevier Ltd. This is an Open Access article under the CC BY-NC-ND 4.0 license. Published by Elsevier Ltd.. All rights reserved.
Conflict of interest statement
Declaration of interests We declare no competing interests.
Figures
Comment in
-
Supporting people responding to overdoses.Lancet Public Health. 2022 Mar;7(3):e198-e199. doi: 10.1016/S2468-2667(22)00011-1. Epub 2022 Feb 10. Lancet Public Health. 2022. PMID: 35151373 No abstract available.
References
-
- Rudd RA, Seth P, David F, Scholl L. Increases in drug and opioid-involved overdose deaths - United States, 2010–2015. MMWR Morb Mortal Wkly Rep 2016; 65: 1445–52. - PubMed
-
- Arias E, Tejada-Vera B, Ahmad F, Kochanek KD. Provisional life expectancy estimates for 2020. In: Vital statistics rapid release; report no 15. Hyattsville, MD: National Center for Health Statistics, July, 2021. https://www.cdc.gov/nchs/data/vsrr/vsrr015-508.pdf (accessed June 3, 2021).
-
- Rudd RA, Aleshire N, Zibbell JE, Gladden RM. Increases in drug and opioid overdose deaths—United States, 2000–2014. MMWR Morb Mortal Wkly Rep 2016; 64: 1378–82. - PubMed
-
- Gladden RM, Martinez P, Seth P. Fentanyl law enforcement submissions and increases in synthetic opioid-involved overdose deaths – 27 states, 2013–2014. MMWR Morb Mortal Wkly Rep 2016; 65: 837–43. - PubMed
Publication types
MeSH terms
Substances
Grants and funding
LinkOut - more resources
Full Text Sources
Other Literature Sources
Medical
