. 2022 Oct;12(8):740-753.
doi: 10.1089/brain.2021.0133. Epub 2022 Apr 11.

Reduction of Motion Artifacts in Functional Connectivity Resulting from Infrequent Large Motion

Affiliations

Reduction of Motion Artifacts in Functional Connectivity Resulting from Infrequent Large Motion

Rasmus M Birn et al. Brain Connect. 2022 Oct.

Abstract

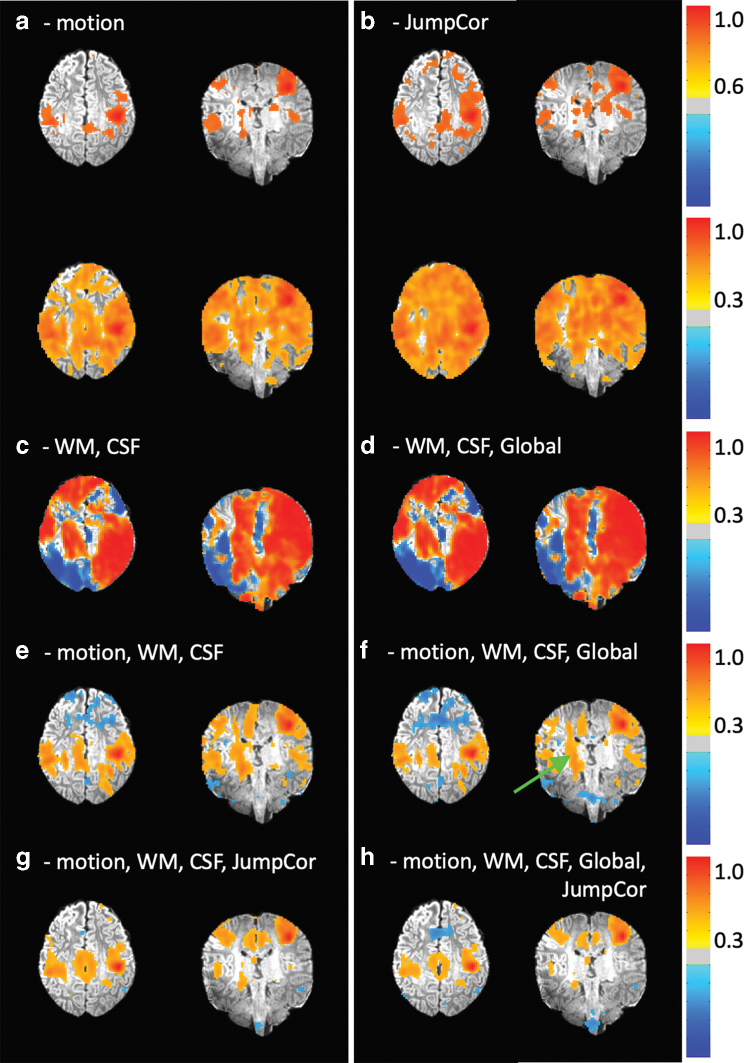
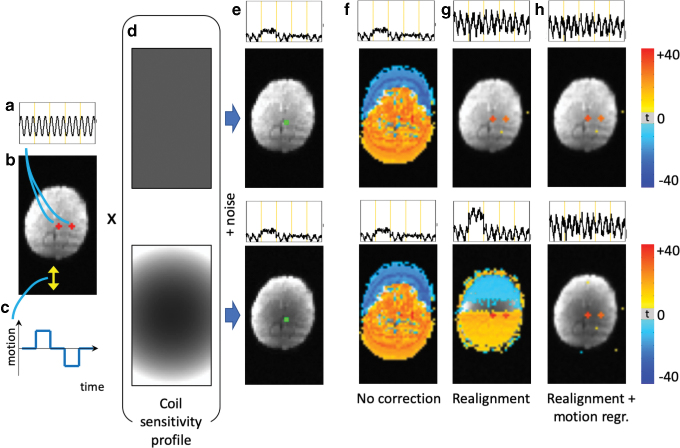
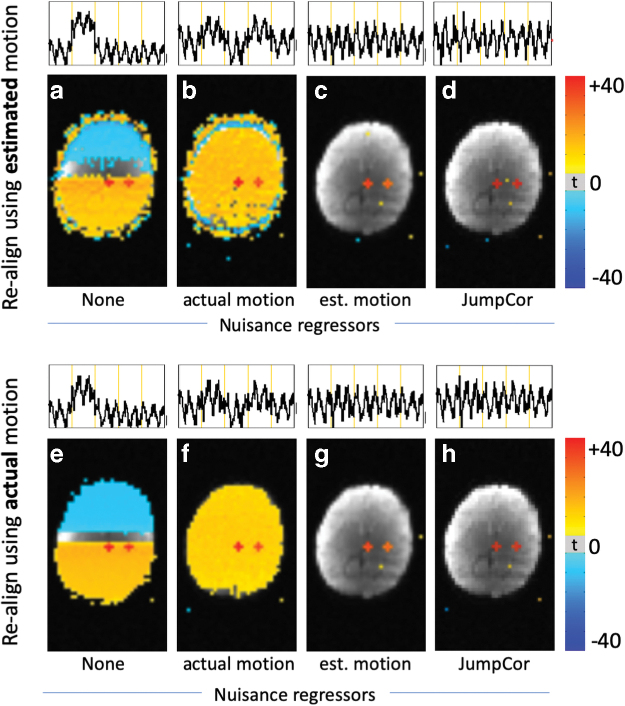
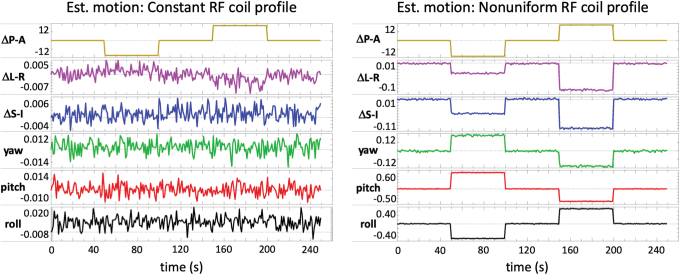
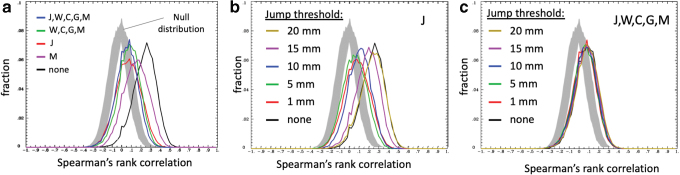
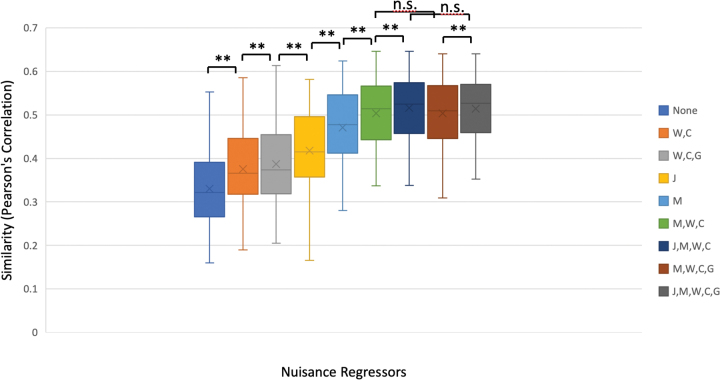
Introduction: Subject head motion is an ongoing challenge in functional magnetic resonance imaging, particularly in the estimation of functional connectivity. Infants (1-month old) scanned during nonsedated sleep often have occasional but large movements of several millimeters separated by periods with relatively little movement. This results in residual signal changes even after image realignment and can distort estimates of functional connectivity. A new motion correction technique, JumpCor, is introduced to reduce the effects of this motion and compared to other existing techniques. Methods: Different approaches for reducing residual motion artifacts after image realignment were compared both in actual and simulated data: JumpCor, regressing out the estimated subject motion, and regressing out the average white matter, cerebrospinal fluid (CSF), and global signals and their temporal derivatives. Results: Motion-related signal changes resulting from infrequent large motion were significantly reduced both by regressing out the estimated motion parameters and by JumpCor. Furthermore, JumpCor significantly reduced artifacts and improved the quality of functional connectivity estimates when combined with typical preprocessing approaches. Discussion: Motion-related signal changes resulting from occasional large motion can be effectively corrected using JumpCor and to a certain extent also by regressing out the estimated motion. This technique should reduce the data loss in studies where participants exhibit this type of motion, such as sleeping infants.

Keywords: connectivity; fMRI; infants; motion.


Conflict of interest statement

R.M.B. is a consultant for NOUS Imaging, Inc., a company that produces the FIRMM motion monitoring software. R.J.D. is the founder, president, and serves on the board of directors for the non-profit organization, Healthy Minds Innovations, Inc.

Figures

FIG. 1.
FIG. 1.
Prevalence and magnitudes of volume-to-volume movements (“jumps”) in the sample of 98 infants. (a) Prevalence of jumps: histogram showing the number of subjects that had a certain total number of jumps >1 mm (26 subjects had no jumps, 16 subjects had only 1 jump, etc.). (b) Histogram of jump magnitude: the number of jumps of a certain magnitude across all runs within the sample. (c) Effect of jump threshold: the number of subjects with at least one jump exceeding the jump threshold, for different thresholds (e.g., 72 subjects had at least 1 jump exceeding 1 mm, 40 subjects had at least 1 jump exceeding 5 mm, and so on).
FIG. 2.
FIG. 2.
Illustration showing how JumpCor regressors are created for one subject. Data are realigned to correct for motion using rigid-body six-parameter registration. The square root of the sum of the squares of the volume-to-volume (temporal) difference (Euclidean norm, Enorm) of the six realignment parameters is computed. Time points exceeding the jump threshold, in this case 1 mm (red line), are considered a jump. Constant regressors (a value of 1 during the segment and a value of 0 outside of the segment) were generated for every segment between the large jumps. These were then included in a multiple linear regression model to model and thus remove jumps in the signal between the segments. Segments of only one time point were not included in the JumpCor regressors, and time points with Enorm >0.2 mm were censored in this regression and not included in any further analysis. Color images are available online.
FIG. 3.
FIG. 3.
Example of time courses (left) and functional connectivity maps (right) for a seed region in the right motor cortex shown in native space overlaid on the echo-planar fMRI time series image. Activation maps are thresholded at p < 0.0005. (a) Signal intensity time series and functional connectivity without any correction or processing. Large signal changes correlated with the seed region are observed throughout the brain, with a striped appearance that matches the orientation of the sagittal slice acquisition. (b) Signal intensity time series and functional connectivity after motion correction (volume registration) and censoring time points with volume-to-volume motion (Enorm) >0.2 mm, as indicated by the gray bars. Residual artifacts are still present. (c) Signal intensity time series and functional connectivity after regressing out the JumpCor regressors. fMRI, functional magnetic resonance imaging. Color images are available online.
FIG. 4.
FIG. 4.
Group functional connectivity maps of a seed region in the right motor cortex, with different sets of nuisance regressors removed in the preprocessing. The nuisance regressors removed for each figure were: (a) motion, average eroded white matter, ventricular CSF, and their temporal derivatives; (b) motion, average eroded white matter, ventricular CSF, the average whole brain (global) signal, and their temporal derivatives; (c) motion, average eroded white matter, ventricular CSF, their temporal derivatives, and the JumpCor regressors; (d) motion, average eroded white matter, ventricular CSF, the average whole brain (global) signal and their temporal derivatives, and the JumpCor regressors. Connectivity maps are thresholded at a Bonferroni corrected p = 0.05 (t-stat = 5.5). CSF, cerebrospinal fluid. Color images are available online.
FIG. 5.
FIG. 5.
Functional connectivity of the motor cortex for one subject that showed occasional large movements (the same subject also shown in Figs. 2 and 3), with different sets of nuisance regressors removed during preprocessing. The nuisance regressors removed for each figure are indicated by the words/abbreviations above each connectivity map. Nuisance regressors: (a) motion = the six realignment parameters, shown at two different thresholds: top row cc = 0.6, bottom row, cc = 0.3; (b) JumpCor = the JumpCor nuisance regressors, shown at two different thresholds: top row cc = 0.6, bottom row, cc = 0.3; (c) WM = average signal over eroded white matter and its temporal derivative; CSF = ventricular CSF and its temporal derivative; (d) WM, CSF, and Global = average signal over the whole brain and its temporal derivative. (e) Motion, WM, CSF. (f) Motion, WM, CSF, and Global. (g) Motion, WM, CSF, and JumpCor. (h) Motion, WM, CSF, Global, and JumpCor. Large artifactual signal changes are reduced by regressing out the estimated motion, but not by regressing out WM, CSF, and Global signal (without motion). Functional connectivity of a motor cortex seed region after nuisance regression of the motion, CSF, WM, and Global signals (f) still showed correlated signal changes outside the motor network in white matter (green arrow). These signal changes are reduced when JumpCor regressors were included in the nuisance regression. WM, white matter. Color images are available online.
FIG. 6.
FIG. 6.
Simulation of functional connectivity in the presence of motion with different RF coil sensitivity profiles. A single EPI brain volume from one of the acquired infant data was copied 250 times in time to create a 250 sec time series. A sinusoidal fluctuation (a) was added to two regions, indicated by the red +'s (b). This brain volume was then translated in the anterior-posterior direction by several millimeters, for a block of time, first in on direction, then back, and then in the opposite direction, and back again (c). The image volumes were then multiplied by one of two different coil sensitivity profiles: one that was constant across space, and another that varied across space by a quadratic function (d). Finally, Gaussian distributed random noise with a variance of 1% of the mean signal intensity was added to the time series data. Functional connectivity was estimated by taking the average voxel time series from one voxel (green, e) and computing the correlation with all other voxel time series after different corrections: (f) no further corrections; (g) rigid-body volume registration; (h) rigid-body registration followed by regressing out the estimated realignment parameters. Functional connectivity maps are thresholded at p < 0.001. Time courses for the seed region are shown above the connectivity maps. Functional connectivity maps in the presence of motion without any correction shows high correlation throughout the brain (f). Image registration reduces these motion-related correlations, but only if the coil sensitivity profile is constant across space (g). Motion in the presence of a nonuniform coil sensitivity results in residual signal changes after registration. These residual changes are reduced when regressing out the estimated motion (h). EPI, echo-planar imaging; RF, radio-frequency. Color images are available online.
FIG. 7.
FIG. 7.
Functional connectivity maps from the simulated data (motion through a nonuniform RF coil sensitivity) for different realignment strategies and different sets of nuisance regressors. Time courses of the center seed region are shown above each connectivity map. Top row (a–c), data were realigned using the estimated motion (AFNI's 3dvolreg), and then different sets of nuisance regressors were removed from the data: (a) no nuisance regression; (b) regressing the actual simulated motion; (c) regressing the estimated motion. Bottom row (d–f), data were realigned using the actual simulated motion, and then different sets of nuisance regressors were removed from the data: (d) no nuisance regression; (e) regressing the actual simulated motion; (f) regressing the estimated motion. Functional connectivity maps are thresholded at p < 0.001. There were only minimal differences between realigning the data using the estimated versus actual motion. However, regressing out the estimated motion reduced the motion artifact (c, f), while regressing out the actual motion did not (b, e). AFNI, Analysis of Functional NeuroImages. Color images are available online.
FIG. 8.
FIG. 8.
Estimated motion from a simulated brain volume moving through either (a) a constant or (b) a nonuniform RF coil sensitivity profile. The estimated motion from a brain moving through a constant (uniform) RF coil sensitivity profile shows the large simulated movement in the A–P direction and no systematic changes in the other directions. The estimated motion from a brain moving through a nonuniform RF coil sensitivity profile shows the large simulated motion in the A–P direction, as well as small changes in the other directions that coincide with the periods of movement. Color images are available online.
FIG. 9.
FIG. 9.
Histograms of the Spearman's rank correlation, across subjects, of the mean volume-to-volume motion (Enorm) and the functional connectivity for all pairwise connections from 230 ROIs, for different sets of nuisance regressors to reduce motion-related signal changes: J = JumpCor regressors, W = average signal over eroded white matter and its temporal derivative, C = average signal over ventricular CSF and its temporal derivative, G = average signal over the whole (global) brain and its temporal derivative, M = estimated realignment parameters. (a) Without any nuisance regression (none, black line), most connections are highly correlated with motion. When JumpCor regressors are removed (red line), the correlation with motion is significantly reduced, being more centered around zero. The correlation is further reduced by regressing out motion, white matter, CSF, and global signals, and even further reduced by regressing out these nuisance regressors and the JumpCor regressors. Null distribution is obtained by permuting the mean framewise displacement across subjects and then recomputing the Spearman's rank correlation. (b, c) Histograms for different thresholds for what is considered a “jump.” (b) after regressing out only the JumpCor regressors; (c) after regressing out the JumpCor regressors (J), average signal over eroded white matter and its temporal derivative (W), average signal over ventricular CSF and its temporal derivative (C), G = average signal over the whole (global) brain and its temporal derivative (G), and the estimated realignment parameters (M). Reducing the jump threshold reduces the correlation with motion when only the JumpCor regressors are removed. When all of the nuisance regressors are removed, different jump thresholds have only a small effect. ROI, region-of-interest. Color images are available online.
FIG. 10.
FIG. 10.
Box plots showing the similarity between each subject's functional connectivity matrix and the group average functional connectivity matrix, for different sets of nuisance regressors: None, J = JumpCor, M = estimated motion parameters, W = average signal over white matter and the temporal derivative, C = average signal over CSF and the temporal derivative, G = average signal over the whole brain (global) and the temporal derivative. **(p < 0.001), n.s. (p > 0.2). The inclusion of the JumpCor regressors together with the estimated motion (M) and tissue based regressors (W, C, G) results in a significant increase in similarity between the individual subject and group connectivity matrices. No significant differences in similarity were observed with versus without the inclusion of the global signal and its derivative when the other regressors (J, M, W, C) were included. n.s., not significant. Color images are available online.

References

    1. Avants BB, Tustison NJ, Wu J, et al. . 2011. An open source multivariate framework for n-tissue segmentation with evaluation on public data. Neuroinformatics 9:381–400. - PMC - PubMed
    1. Ciric R, Rosen AFG, Erus G, et al. . 2018. Mitigating head motion artifact in functional connectivity MRI. Nat Protoc 13:2801–2826. - PMC - PubMed
    1. Ciric R, Wolf DH, Power JD, et al. . 2017. Benchmarking of participant-level confound regression strategies for the control of motion artifact in studies of functional connectivity. Neuroimage 154:174–187. - PMC - PubMed
    1. Cox RW. 1996. AFNI: software for analysis and visualization of functional magnetic resonance neuroimages. Comput Biomed Res 29:162–173. - PubMed
    1. Dean, 3rd DC, Dirks H, O'Muircheartaigh J, et al. . 2014. Pediatric neuroimaging using magnetic resonance imaging during non-sedated sleep. Pediatr Radiol 44:64–72. - PMC - PubMed

Publication types

LinkOut - more resources