. 2022 Apr;39(7-8):577-589.
doi: 10.1089/neu.2021.0362. Epub 2022 Mar 1.

RNA Binding Motif 5 Gene Deletion Modulates Cell Signaling in a Sex-Dependent Manner but Not Hippocampal Cell Death

Affiliations

RNA Binding Motif 5 Gene Deletion Modulates Cell Signaling in a Sex-Dependent Manner but Not Hippocampal Cell Death

Jeffrey Farooq et al. J Neurotrauma. 2022 Apr.

Abstract

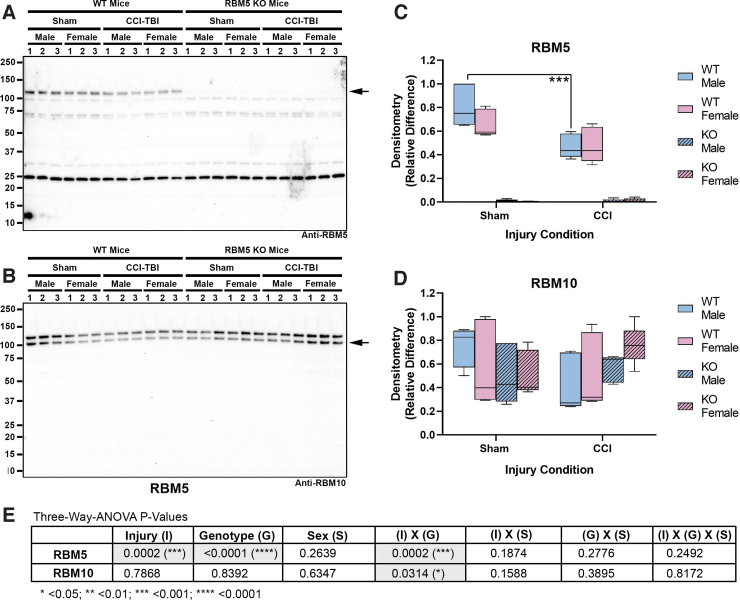
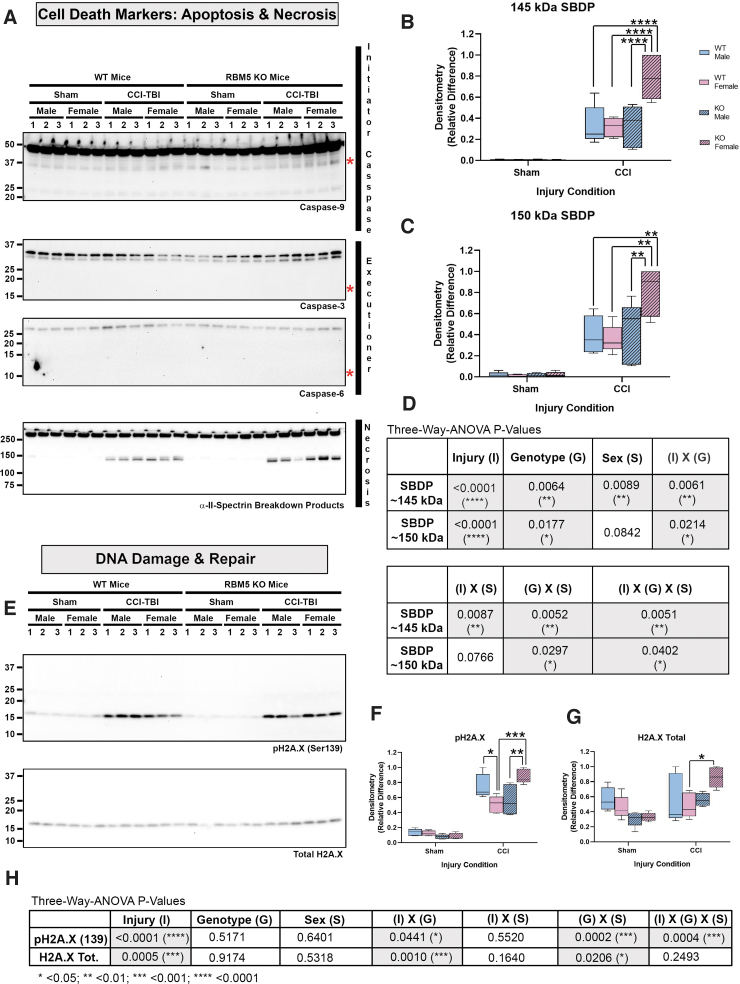
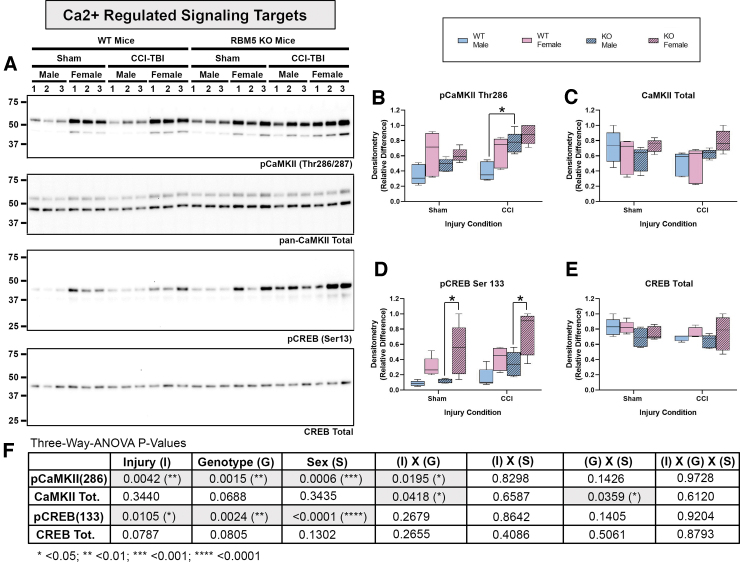
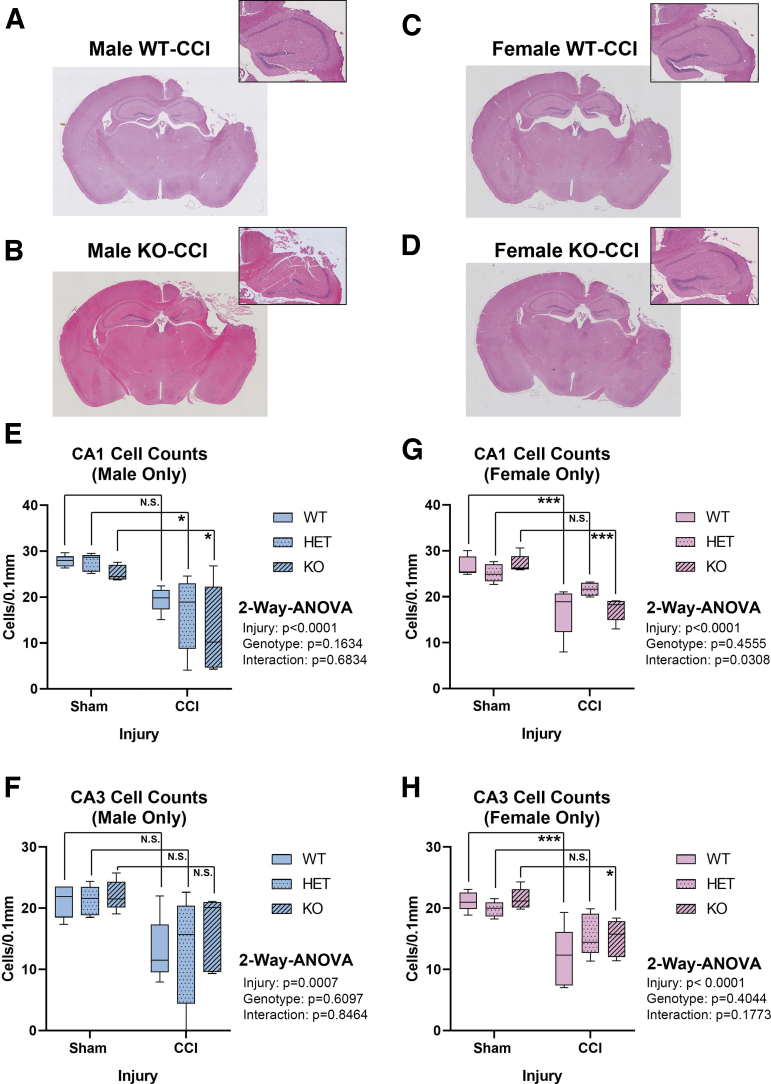
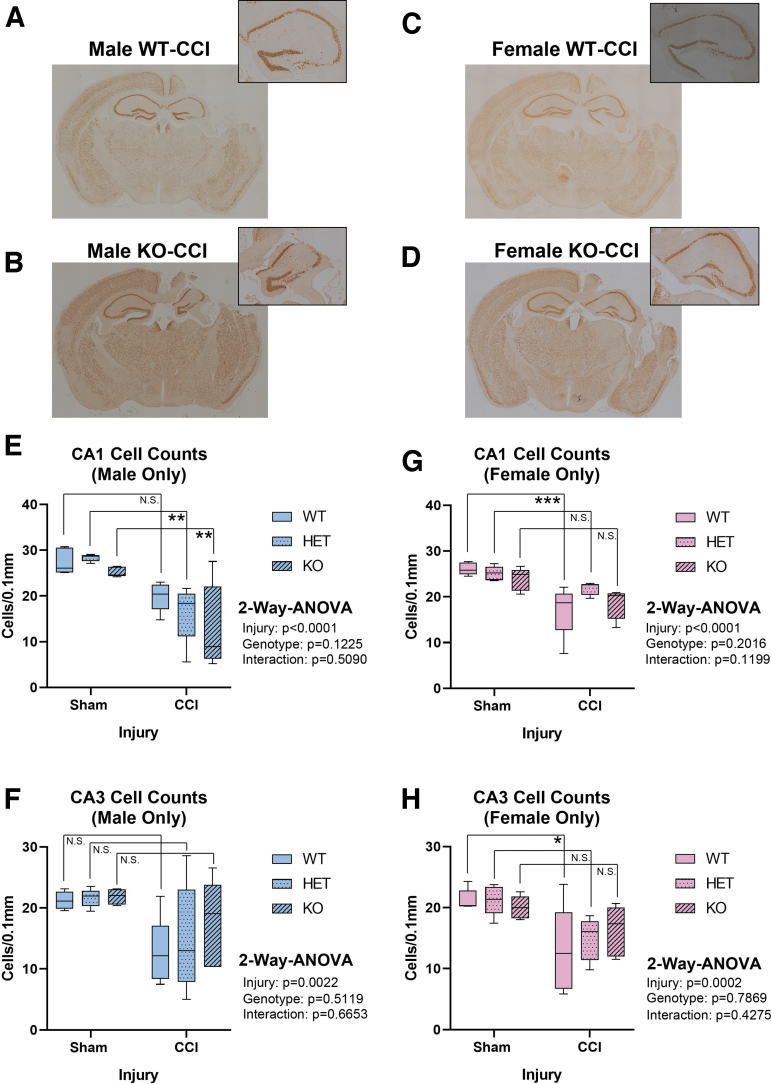
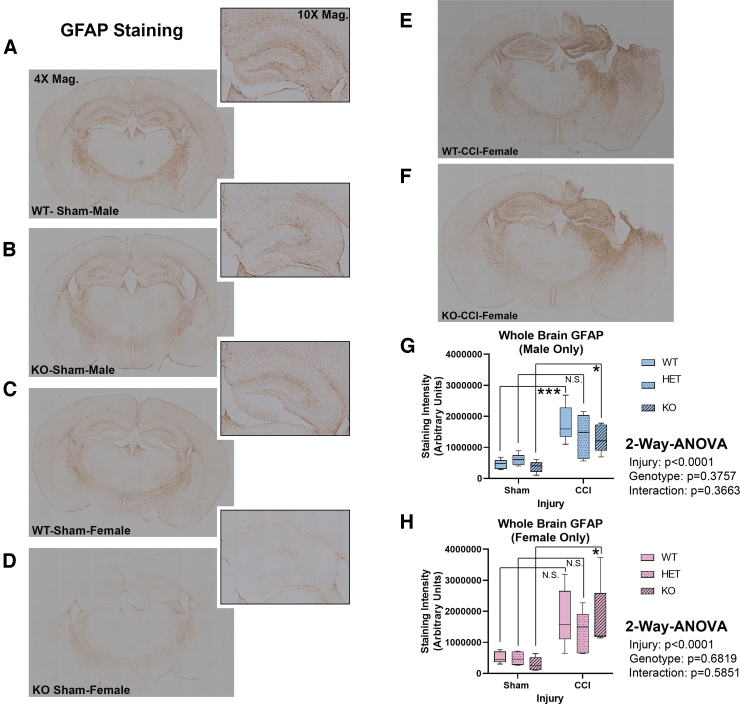
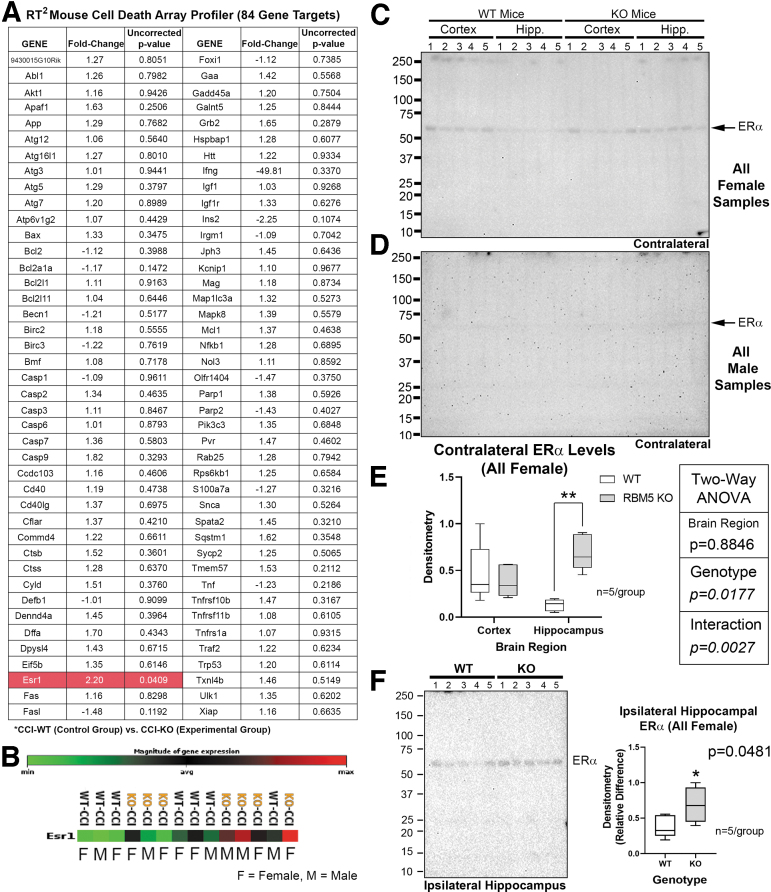
RNA-binding motif 5 (RBM5) is a pro-death tumor suppressor gene in cancer cells. It remains to be determined if it is neurotoxic in the brain or rather if it plays a fundamentally different role in the central nervous system (CNS). Brain-specific RBM5 knockout (KO) mice were given a controlled cortical impact (CCI) traumatic brain injury (TBI). Markers of acute cellular damage and repair were measured in hippocampal homogenates 48 h post-CCI. Hippocampal CA1/CA3 cell counts were assessed 7 days post-CCI to determine if early changes in injury markers were associated with histological outcome. No genotype-dependent differences were found in the levels of apoptotic markers (caspase 3, caspase 6, and caspase 9). However, KO females had a paradoxical increase in markers of pro-death calpain activation (145/150-spectrin and breakdown products [SBDP]) and in DNA repair/survival markers. (pH2A.x and pCREB). CCI-injured male KOs had a significant increase in phosphorylated calcium/calmodulin-dependent protein kinase II (pCaMKII). Despite sex/genotype-dependent differences in KOs in the levels of acute cell signaling targets involved in cell death pathways, 7 day hippocampal neuronal survival did not differ from that of wild types (WTs). Similarly, no differences in astrogliosis were observed. Finally, gene analysis revealed increased estrogen receptor α (ERα) levels in the KO hippocampus in females and may suggest a novel mechanism to explain sex-dimorphic effects on cell signaling. In summary, RBM5 inhibition did not affect hippocampal survival after a TBI in vivo but did modify targets involved in neural signal transduction/Ca2+ signaling pathways. Findings here support the view that RBM5 may serve a purpose in the CNS that is dissimilar from its traditional pro-death role in cancer.

Keywords: RBM5; RNA binding protein; gender; sexual dimorphism; trauma.


Conflict of interest statement

T.C.J. and P.M.K. are inventors of a USPTO patent (No. 9610266) titled: Small molecule inhibitors of RNA binding motif (RBM) proteins for the treatment of acute cellular injury. The other authors have nothing to disclose

Figures

FIG. 1.
FIG. 1.
Hippocampal RNA-binding motif 5 (RBM5) and RBM10 levels in sham versus controlled cortical impact (CCI)-injured mice. (A) Representative blot of hippocampal RBM5 levels in sham versus CCI male/female wild type (WT) and knockout (KO) (n = 3/group). (B) Representative blot of hippocampal RBM10 levels in sham versus CCI male/female WT and KO (n = 3/group). (C and D) Densitometry values (n = 5/group), normalized to total protein loading, were analyzed by three-way analysis of variance (ANOVA) and Tukey's Multiple Comparison Test. Data were significant at p < 0.05. Box plots show minimum, maximum, interquartile range (IQR), and median. Color image is available online.
FIG. 2.
FIG. 2.
Hippocampal levels of apoptosis, necrosis, and DNA damage markers in sham vs. controlled cortical impact (CCI)-injured mice. (A) Representative blots of hippocampal caspase-9, caspase-3, caspase-6, and total and cleaved α-II-spectrin breakdown products (SBDPs) in sham versus CCI male/female wild type (WT) and knockout (KO) (n = 3/group). Red asterisks indicate the predicted kDa of caspase cleavage products for each antibody (B and C) Densitometric analysis (n = 5/group) of calpain-cleaved 145 kDa and 150 kda SBDPs, normalized to total protein loading, and analyzed by three-way analysis of variance (ANOVA) and Tukey's Multiple Comparison Test. Data were significant at p < 0.05. Box plots show minimum, maximum, interquartile range (IQR), and median. (D) Table shows p values for the main effects and interactions on SBDP levels. (E) Representative blot of hippocampal total and phosphorylated H2A.X (pH2A.X Ser139) in sham versus CCI male/female WT and KO (n = 3/group). (F and G) Densitometric analysis (n = 5/group) of pH2A.X and total H2A.X, normalized to total protein loading, and analyzed by three-way ANOVA and Tukey's Multiple Comparison Test. Data were significant at p < 0.05. Box plots show minimum, maximum, IQR, and median. (H) Table shows p values for the main effects and interactions on pH2A.X and H2A.X total levels. Asterisks in the graphs indicate post-hoc significance (*p < 0.05, **p < 0.01, ***p < 0.001, ****p < 0.0001). Color image is available online.
FIG. 3.
FIG. 3.
Hippocampal levels of Ca2+ pathway signaling markers in sham versus controlled cortical impact (CCI)-injured mice. (A) Representative blots of hippocampal total and phosphorylated calcium/calmodulin-dependent protein kinase II (CaMKII), and total and phosphorylated cAMP-response element binding protein (CREB) in sham versus CCI male/female wild type (WT) and knockout (KO) (n = 3/group). (B–E) Densitometric analysis (n = 5/group) of pCaMKII Thr286, total CaMKII, CREB Ser133, and total CREB, normalized to total protein loading, and analyzed by three-way analysis of variance (ANOVA) and Tukey's Multiple Comparison Test. Data were significant at p < 0.05. Box plots show minimum, maximum, interquartile range (IQR), and median. (F) Table shows p values for the main effects and interactions on the levels of Ca2+ pathway targets. Asterisks in the graphs indicate post-hoc significance (*p < 0.05). Color image is available online.
FIG. 4.
FIG. 4.
Seven day Hematoxylin and Eosin (H&E) post-injury hippocampal CA1 and CA3 sub-field total cell counts in sham versus controlled cortical impact (CCI)-injured mice. (A–D) Representative H&E-stained whole brain sections (4 × magnification) showing insult severity in male/female wild type (WT) and knockout (KO). Magnified (10 × ) images of the hippocampus are shown at the top right. Quantification of CA1 and CA3 cell counts in males (E and F) and (G and H) females across all genotypes (n = 5/group) and analyzed by two-way analysis of variance (ANOVA) and Tukey's Multiple Comparison Test. Data were significant at p < 0.05. Box plots show minimum, maximum, interquartile range (IQR), and median. Asterisks indicate post-hoc significance (*p < 0.05, ***p < 0.001, N.S., not significant). Color image is available online.
FIG. 5.
FIG. 5.
Seven day neuronal nuclear protein (NeuN) post-injury hippocampal CA1 and CA3 sub-field neuronal counts in sham versus controlled cortical impact (CCI)-injured mice. (A–D) Representative NeuN-stained whole brain sections (4 × magnification) showing insult severity in male/female wild type (WT) and knockout (KO). Magnified (10 × ) images of the hippocampus are shown at the top right. Quantification of CA1 and CA3 neuronal counts in males (E and F) and females (G and H) across all genotypes (n = 5/group) and analyzed by two-way analysis of variance (ANOVA) and Tukey's Multiple Comparison Test. Data were significant at p < 0.05. Box plots show minimum, maximum, interquartile range (IQR), and median. Asterisks indicate post-hoc significance (*p < 0.05, **p < 0.01, ***p < 0.001, N.S., not significant). Color image is available online.
FIG. 6.
FIG. 6.
Seven day glial fibrillary acidic protein (GFAP) levels in sham versus controlled cortical impact (CCI)-injured mice. (A–D) Representative whole brain sections (4 × magnification) showing 7 day GFAP staining in male/female wild type (WT) and knockout (KO). Magnified (10 × ) images of the hippocampus are shown at the top right of each representative image (E and F) Representative 7 day GFAP staining in female WT versus KO brain sections. (G and H) ImageJ quantification of GFAP staining in whole brain sections from male/female sham versus CCI-injured mice across all genotypes (n = 5/group). Staining intensity was analyzed by two-way analysis of variance (ANOVA) and Tukey's Multiple Comparison Test. Data were significant at p < 0.05. Box plots show minimum, maximum, interquartile range (IQR), and median. Asterisks in the graphs indicate post-hoc significance (*p < 0.05, ***p < 0.001, N.S., not significant). Color image is available online.
FIG. 7.
FIG. 7.
Increased hippocampal estrogen receptor α (ERα/ESR1) levels in female knockouts (KOs.) (A) Quantitative reverse transcription polymerase chain reaction (RT-PCR) analysis of 84 cell death gene targets in the contused ipsilateral cortex of male/female wild type (WT) versus KO controlled cortical impact (CCI)-injured mice. Only ERα (highlighted red in table) was significantly increased in KOs versus WTs. GeneGlobe generated p values are uncorrected. (B) Heat map of ERα expression levels in each of the 14 samples suggesting increased levels in both male and female KOs at the mRNA level. (C and E) Images of the blot and densitometric analysis (n = 5/group) of ERα levels in the contralateral cortex and hippocampus in CCI-injured females (WT-CCI vs. KO-CCI). (D) Images of the blot of ERα levels in the contralateral cortex and hippocampus in CCI-injured males (WT-sham vs. KO-sham). No signals were detected in males. (E) Densitometric analysis (n = 5/group) of ERα levels in the contralateral cortex and hippocampus in CCI-injured females (WT vs. KO). Signals were normalized to total protein loading, and analyzed by two-way analysis of variance (ANOVA) and Tukey's Multiple Comparison Test. (F) Blot and densitometric analysis (n = 5/group) of ERα levels in the ipsilateral hippocampus in CCI-injured females (WT vs. KO). Signals were normalized to total protein loading, and analyzed by an unpaired students t test. Data were significant at p < 0.05. Box plots show minimum, maximum, interquartile range (IQR), and median. Asterisks in the graphs indicate post-hoc significance (*p < 0.05, **p < 0.01). Color image is available online.

References

    1. Jackson, T.C., and Kochanek, P.M. (2020). RNA binding motif 5 (RBM5) in the CNS-moving beyond cancer to harness RNA splicing to mitigate the consequences of brain injury. Front. Mol. Neurosci. 13, 126. - PMC - PubMed
    1. Oh, J.J., Razfar, A., Delgado, I., Reed, R.A., Malkina, A., Boctor, B., and Slamon, D.J. (2006). 3p21.3 tumor suppressor gene H37/Luca15/RBM5 inhibits growth of human lung cancer cells through cell cycle arrest and apoptosis. Cancer Res. 66, 3419–3427. - PubMed
    1. Fushimi, K., Ray, P., Kar, A., Wang, L., Sutherland, L.C., and Wu, J.Y. (2008). Up-regulation of the proapoptotic caspase 2 splicing isoform by a candidate tumor suppressor, RBM5. Proc. Natl. Acad. Sci. U. S. A. 105, 15,708–15,713. - PMC - PubMed
    1. Kobayashi, T., Ishida, J., Musashi, M., Ota, S., Yoshida, T., Shimizu, Y., Chuma, M., Kawakami, H., Asaka, M., Tanaka, J., Imamura, M., Kobayashi, M., Itoh, H., Edamatsu, H., Sutherland, L.C., and Brachmann, R.K. (2011). p53 transactivation is involved in the antiproliferative activity of the putative tumor suppressor RBM5. Int. J. Cancer 128, 304–318. - PubMed
    1. Rintala-Maki, N.D., and Sutherland, L.C. (2004). LUCA-15/RBM5, a putative tumour suppressor, enhances multiple receptor-initiated death signals. Apoptosis 9, 475–484. - PubMed

Publication types