Review
. 2022;218(1):3.
doi: 10.1007/s11214-022-00870-x. Epub 2022 Feb 1.

A Review of the EUSO-Balloon Pathfinder for the JEM-EUSO Program

J H Adams Jr  1 S Ahmad  2 D Allard  3 A Anzalone  4   5 S Bacholle  3 P Barrillon  6 J Bayer  7 M Bertaina  8   9 F Bisconti  9   10 C Blaksley  3 S Blin-Bondil  2 P Bobík  11 F Cafagna  12 D Campana  13 F Capel  14 M Casolino  15   16 C Cassardo  9 C Catalano  17 R Cremonini  9 S Dagoret-Campagne  6 P Danto  18 L Del Peral  19 C de la Taille  2 A Díaz Damian  17 M Dupieux  17 A Ebersoldt  10 T Ebisuzaki  15 J Eser  20 J Evrard  18 F Fenu  8   9 S Ferrarese  9 C Fornaro  21 M Fouka  22 P Gorodetzky  3 F Guarino  13   23 A Guzman  7 Y Hachisu  15 A Haungs  10 E Judd  24 A Jung  3 J Karczmarczyk  25 Y Kawasaki  15 P A Klimov  26 E Kuznetsov  1 S Mackovjak  11 M Manfrin  9 L Marcelli  16 G Medina-Tanco  27 K Mercier  18 A Merino  28 T Mernik  7 H Miyamoto  9   6 J A Morales de Los Ríos  19 C Moretto  6 B Mot  17 A Neronov  29 H Ohmori  15 A V Olinto  30 G Osteria  13 B Panico  13   23 E Parizot  3 T Paul  31 P Picozza  15   16   32 L W Piotrowski  15 Z Plebaniak  9   25 S Pliego  27 P Prat  3 G Prévôt  3 H Prieto  19 M Putis  11 J Rabanal  6 M Ricci  33 J Rojas  27 M D Rodríguez Frías  19 G Roudil  17 G Sáez Cano  19 Z Sahnoun  22 N Sakaki  15 J C Sanchez  27 A Santangelo  7 F Sarazin  20 V Scotti  13   23 K Shinozaki  9   25 H Silva  27 J F Soriano  19 G Suino  9 J Szabelski  25 S Toscano  29 I Tabone  9 Y Takizawa  15 P von Ballmoos  17 L Wiencke  20 M Wille  34 M Zotov  26
Affiliations
Review

A Review of the EUSO-Balloon Pathfinder for the JEM-EUSO Program

J H Adams Jr et al. Space Sci Rev. 2022.

Abstract

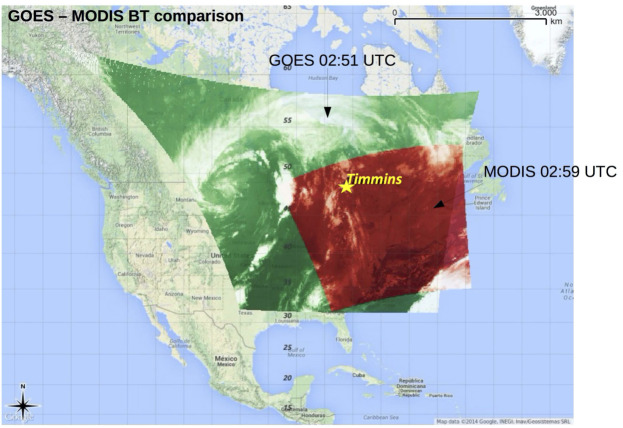
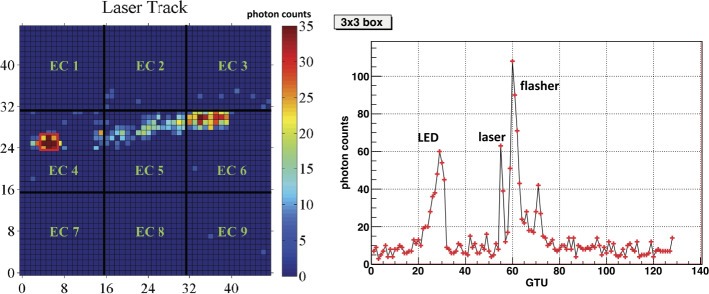
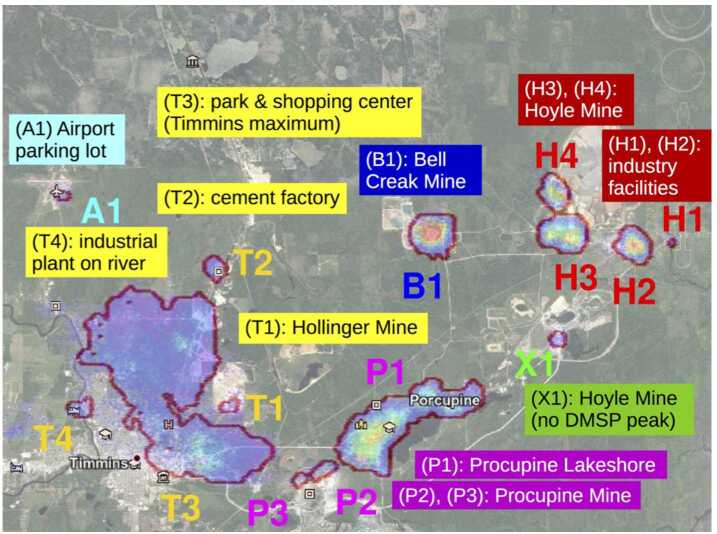
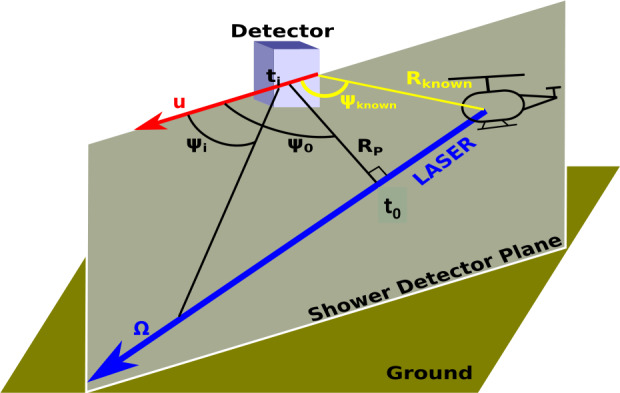
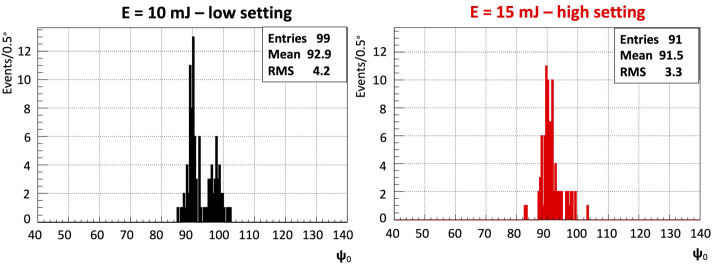
EUSO-Balloon is a pathfinder for JEM-EUSO, the mission concept of a spaceborne observatory which is designed to observe Ultra-High Energy Cosmic Ray (UHECR)-induced Extensive Air Showers (EAS) by detecting their UltraViolet (UV) light tracks "from above." On August 25, 2014, EUSO-Balloon was launched from Timmins Stratospheric Balloon Base (Ontario, Canada) by the balloon division of the French Space Agency CNES. After reaching a floating altitude of 38 km, EUSO-Balloon imaged the UV light in the wavelength range ∼290-500 nm for more than 5 hours using the key technologies of JEM-EUSO. The flight allowed a good understanding of the performance of the detector to be developed, giving insights into possible improvements to be applied to future missions. A detailed measurement of the photoelectron counts in different atmospheric and ground conditions was achieved. By means of the simulation of the instrument response and by assuming atmospheric models, the absolute intensity of diffuse light was estimated. The instrument detected hundreds of laser tracks with similar characteristics to EASs shot by a helicopter flying underneath. These are the first recorded laser tracks measured from a fluorescence detector looking down on the atmosphere. The reconstruction of the direction of the laser tracks was performed. In this work, a review of the main results obtained by EUSO-Balloon is presented as well as implications for future space-based observations of UHECRs.

Keywords: Extensive air showers; JEM-EUSO; Stratospheric Balloon; Ultra-High Energy Cosmic Rays.


Figures

Fig. 1
Fig. 1
Left: photo of EUSO-Balloon, ready for its first flight from Timmins, Ontario, Canada, August 2014; right: schematic view of the instrument booth and optical bench, without floaters and “crash rings”
Fig. 2
Fig. 2
Functional block diagram of the EUSO-Balloon electronics with the Photo-Detector Module (PDM), the Data Processor (DP) and the Power components (PWP)
Fig. 3
Fig. 3
The PDM: the 36 MAPMTs are covered with UV band-pass filters; four MAPMTs form an EC. The PDM includes 9 ECs, 6 EC-ASIC boards, and a PDM board. Each layer on the back hosts two EC-ASIC boards. The EC units are already potted in the present figure (see text for details)
Fig. 4
Fig. 4
Left: ray tracing diagram for the EUSO-Balloon optics with the Fresnel Lenses L1 and L3, and the focal surface; the incident rays are at off-axis angles ranging from 0 (blue) to 1 (green), 2 (red) 3 (yellow) and 4 (purple); inserts show partial sectional views of L1 and L3; right: Optical bench with Fresnel lenses L1 and L3 (8 mm thick PMMA, surface of 1 m × 1 m) mounted onto their fiberglass frames and spiders, and held at a distance of 1.11 m by an optical “sled”
Fig. 5
Fig. 5
Left: block diagram of the stand-alone IRcam system; right: the rugged watertight aluminium housing (0.4 m × 0.4 m × 0.4 m) of the IRcam with the IRX CAM640 in its lower left side
Fig. 6
Fig. 6
The features making EUSO-Balloon survive a water-landing: 1) “deceleration-cylinder”, 2) collar of floaters, 3) watertight instrument booth using the third Fresnel lens (L3) as a porthole, 4) electronics is mounted on a “dry-shelf” above eventual capillary water - see text
Fig. 7
Fig. 7
Left: Timmins (Ontario, Canada) Stratospheric Balloon Base, August 25, 2014, 0:53 UTC: the perfect launch of EUSO-Balloon by the balloon division of the French Space Agency CNES, the auxiliary balloons (above the payload in the picture) warrant a smooth launch even in case of moderate surface winds. Right: the instrument floating in the middle of “Lake Euso” after splashing down at 8:59 UTC. All systems survived the impact and more than eight hours in the water thanks to a dedicated “water-landing” design
Fig. 8
Fig. 8
The flight-track of EUSO-Balloon on August 25, 2014 (yellow) - float altitude was 38 km. The helicopter carrying the UV laser and two UV flashers followed the balloon for over two hours at an altitude of 3000 m (red)
Fig. 9
Fig. 9
Brightness Temperature (BT) juxtaposition between GOES-13 (green) and MODIS (red) around 3:00 UTC. Note that the size of the image covers a much wider area than EUSO-Balloon trajectory. A star indicates the location of Timmins. It is clear that EUSO-Balloon crossed an area of broken clouds during its flight
Fig. 10
Fig. 10
Left side: Image of one helicopter event obtained by integrating the counts in each pixel for the whole packet=1960 or run=043202 (128 GTUs). This event includes all three components: UV-LED and Xenon-flasher signals as well as laser track which extends up to coordinates (X=39; Y=31). A threshold is applied to the minimum signal level to emphasize the location of the track. The UV-LED and Xenon-flasher signals are centered around a pixel: axis of abscissae X=5; axis of ordinates Y=25. Right side: The number of photon counts recorded in the 3×3 pixel-box centered around (X=5; Y=25) during the entire packet. Figure adapted from (Suino et al. 2015)
Fig. 11
Fig. 11
Red dots: energy of all fired laser shots averaged over 19 shots (1 s). Green crosses: shots recorded by EUSO-Balloon. Grey regions indicate the likely presence of clouds. The laser energy was decreasing due to heating of the laser itself during the helicopter flight. Figure adapted from (Abdellaoui et al. 2018a)
Fig. 12
Fig. 12
Average normalized count rates Nˆ as a function of the packet time. Several breaks are present due to the interruption of the measurements necessary to switch between different data acquisition modes. Figure adapted from (Abdellaoui et al. 2019)
Fig. 13
Fig. 13
The contoured areas are those detected by EUSO-Balloon with significant light intensities. They are superimposed with a satellite image (Google Maps 2016) of the Timmins area. A good match between the two images is evident
Fig. 14
Fig. 14
Geographical map of the IR radiance along the flight path (i.e. from “right to left”, as the balloon was carried towards the west by the winds in the stratosphere). The map is created by averaged values for particular positions. The values were changing in time due to movement of clouds and motion of EUSO-Balloon. The displayed values are relative to the mean value of IR radiance over reference area “A”. Figure adapted from (Mackovjak et al. 2015)
Fig. 15
Fig. 15
The cross-correlation of IR radiances and UV intensities of all pixels from the UV and IR maps. The color scale represents the number of overlapping pixels in the scatter plot which is arbitrarily truncated at 30 units. The selected rectangle indicates conditions that are suitable for the detection of EASs - cloudless atmosphere without man-made lights and corresponds to area “A” already defined in Fig. 14. The logarithmic scale is used to improve the visualization of the anti-correlation presented in the text. Figure adapted from (Mackovjak et al. 2015)
Fig. 16
Fig. 16
Left: Histogram of the discrepancies from MODIS CTP and the CTPs retrieved using WRF profiles. Right: Boxplot of the discrepancies from MODIS CTP and the CTPs retrieved applying the WRF (WRF T), Moosonee (Moos), EUSO-Balloon (Balloon), and US Standard Atmosphere (Astd) profiles to the MODIS CTT image. Figure adapted from (Tabone et al. 2015)
Fig. 17
Fig. 17
CTH (expressed in meters) of EUSO-Balloon scene for 07:39 UTC (legend at the bottom). Left: CTH of algorithm assuming clouds as black bodies. Right: CTH final, including WRF corrections. X- and Y-axis represent the pixel number. The FoV at ground is order of 23 × 32 km2. Figure adapted from Merino et al. (2015)
Fig. 18
Fig. 18
Illustration of the reconstruction of the geometrical direction of the laser tracks fired from the helicopter using the observables from the balloon. The two parameters t0 and Ψ0 represent the time at which the laser track reaches the closest distance to the detector, and the angle between the detector’s direction of movement and the line of closest distance between the track and the detector, respectively. If the position of the light source is known, these are the only two parameters that need to be determined. Figure adapted from (Abdellaoui et al. 2018a)
Fig. 19
Fig. 19
Example laser track observed at 05:40:24 UTC (left panel) with corresponding time profile and fit (right panel). Figure adapted from (Abdellaoui et al. 2018a)
Fig. 20
Fig. 20
Ψ0 angle reconstruction of the helicopter laser shots with the 2-parameter fit method including only tracks with 4 GTUs or more. Figure adapted from (Abdellaoui et al. 2018a)
Fig. 21
Fig. 21
Ψ0 angle reconstruction of the helicopter laser shots with the 2-parameter fit method split by laser energy (left: 10 mJ - low setting; right: 15 mJ - high setting). The minimum track duration is 4 GTUs. Figure adapted from (Abdellaoui et al. 2018a)
Fig. 22
Fig. 22
Left: Total photon count of the entire PDM as a function of time (in GTUs) for a specific packet of data. The peak of light in the packet corresponds to the light from a horizontal laser pulse, crossing the FoV. Right: Histogram of the significance of the photon counts in the entire PDM, for all the periods considered without signal (see text) in blue color. A Gaussian fit of the distribution is also shown in red, for comparison. Figure adapted from (Jung 2017)
Fig. 23
Fig. 23
Photon count in each pixel of the entire PDM corresponding to the mine event number 1, at 5 different times indicated by the GTU number within the recorded sequence. The persistent lights are associated with identified mines. The transient event appears at the middle right edge of the FoV, where a mine is also located. The time profile of the transient event is reported in the bottom-right panel. Figure adapted from (Jung 2017)
Fig. 24
Fig. 24
Time sequence showing the photon count significance signal as a function of time (in GTU) in each individual EC (bottom left) and in the whole PDM (bottom right), for the packet in which an unidentified event was recorded. A zoom of three ECs is shown on the top portion of the figure, which is adapted from (Jung 2017)

References

    1. Aab A., Abreu P., Aglietta M., Albuquerque I.F.M., Allekotte I., et al. Astrophys. J. Lett. 2018;853(2):L29. doi: 10.3847/2041-8213/aaa66d. - DOI
    1. Aab A., Abreu P., Aglietta M., Albuquerque I.F.M., Albury J.M., et al. Astrophys. J. 2020;891:142. doi: 10.3847/1538-4357/ab7236. - DOI
    1. Abbasi R.U., Abe M., Abu-Zayyad T., Allen M., Azuma R., et al. Astrophys. J. 2018;862:91. doi: 10.3847/1538-4357/aac9c8. - DOI
    1. Abdellaoui G., Abe S., Acheli A., Adams J.H., Ahmad S., et al. Nucl. Instrum. Methods A. 2017;866:150. doi: 10.1016/j.nima.2017.05.043. - DOI
    1. Abdellaoui G., Abe S., Adams J.H., Ahriche A., et al. J. Instrum. 2018;13:P05023. doi: 10.1088/1748-0221/13/05/p05023. - DOI