. 2022 Jan 27:12:820191.
doi: 10.3389/fphar.2021.820191. eCollection 2021.

Novel Compounds Synergize With Venetoclax to Target KMT2A-Rearranged Pediatric Acute Myeloid Leukemia

Affiliations

Novel Compounds Synergize With Venetoclax to Target KMT2A-Rearranged Pediatric Acute Myeloid Leukemia

Claudia Tregnago et al. Front Pharmacol. .

Abstract

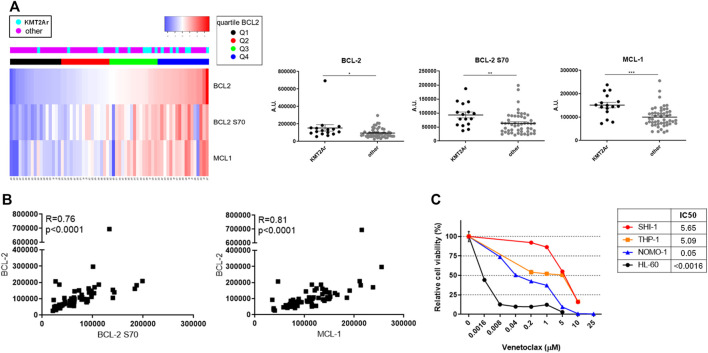
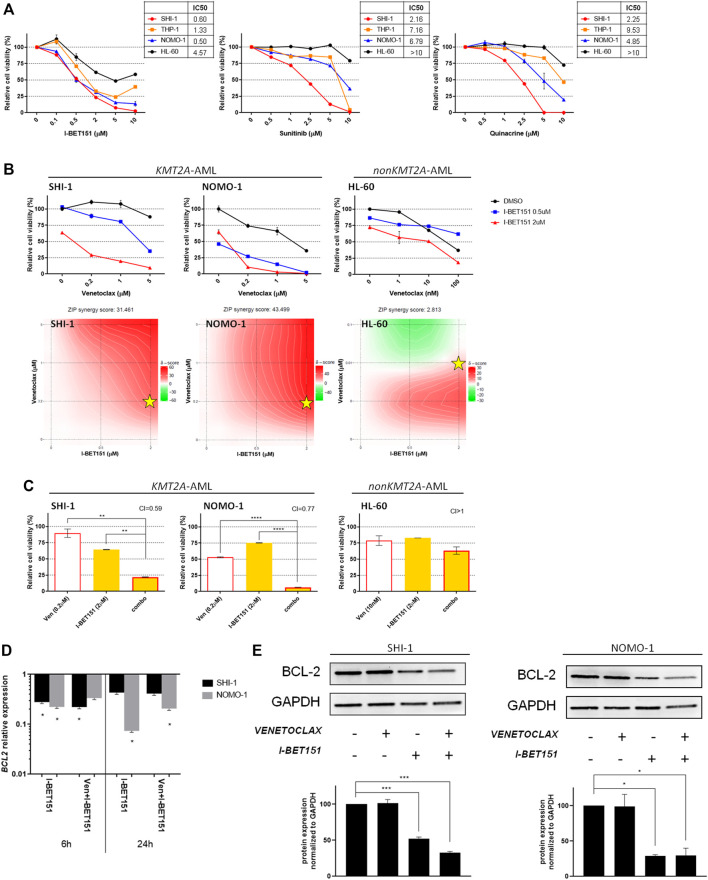
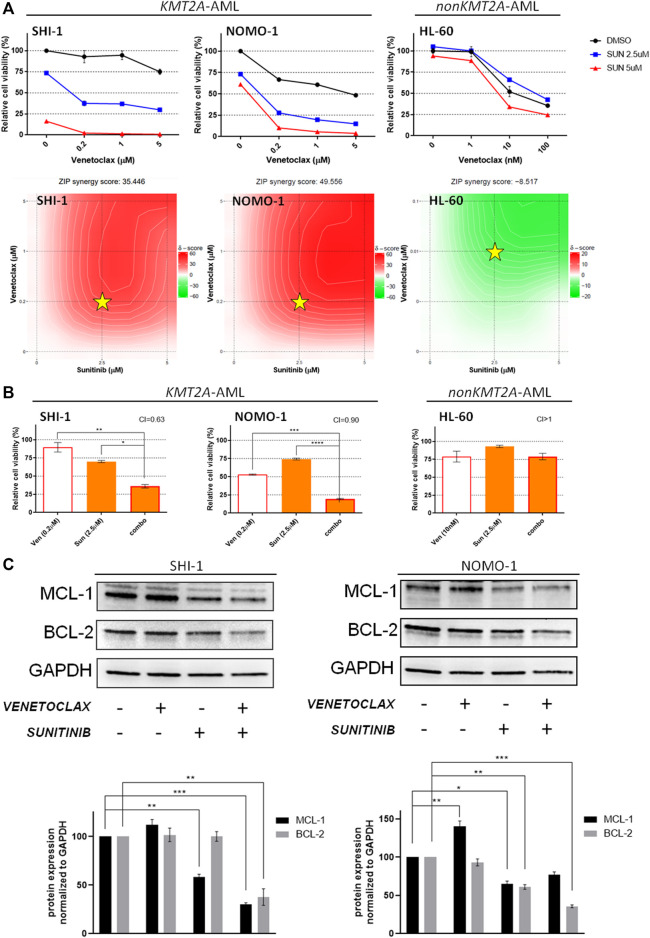
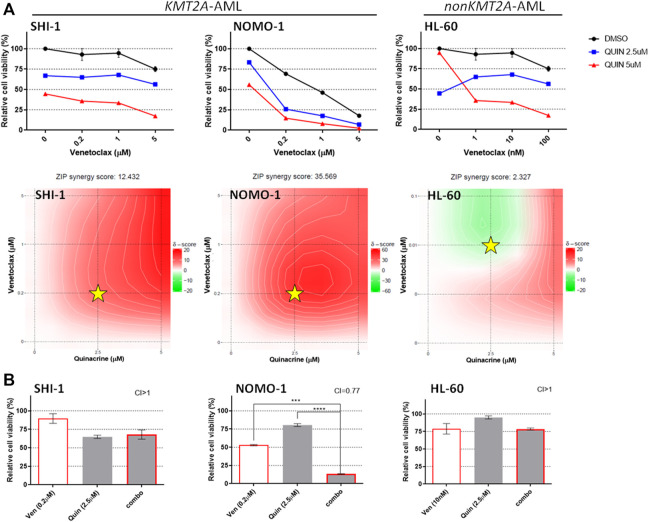
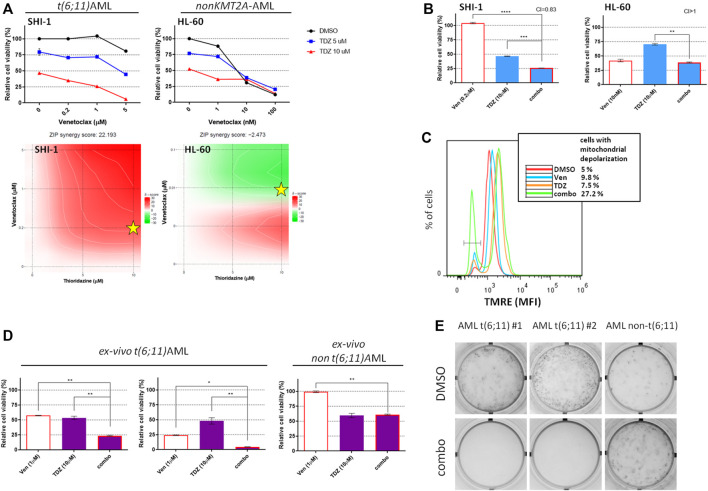
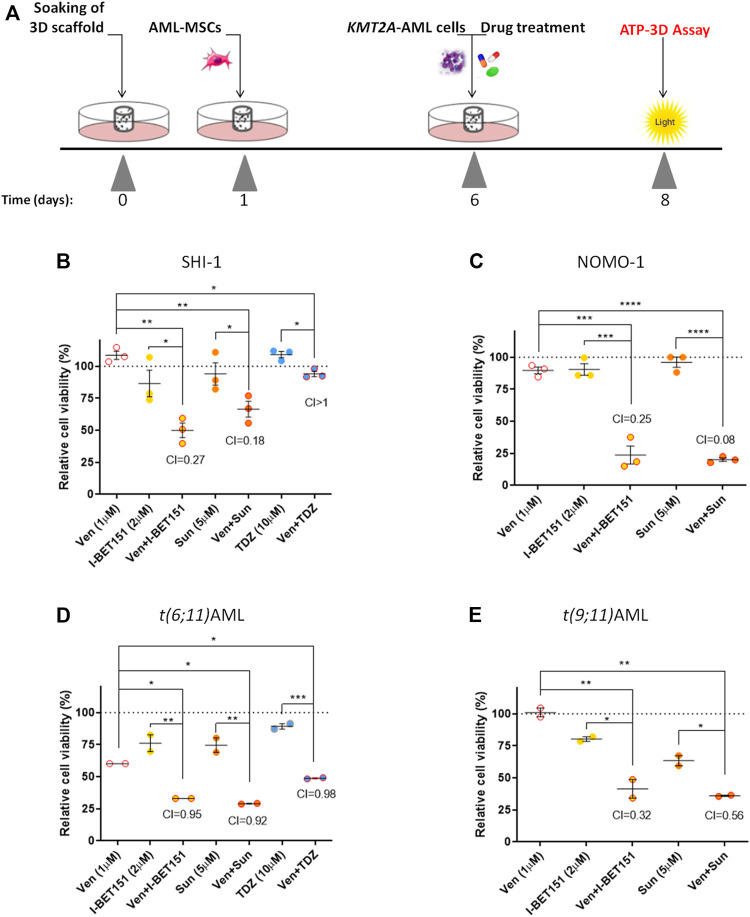
In pediatric acute myeloid leukemia (AML), fusions involving lysine methyltransferase 2A (KMT2A) are considered hallmarks of aggressive AML, for whom the development of targeted specific therapeutic agents to ameliorate classic chemotherapy and obtain a complete eradication of disease is urgent. In this study, we investigated the antiapoptotic proteins in a cohort of 66 pediatric AML patients, finding that 75% of the KMT2A-r are distributed in Q3 + Q4 quartiles of BCL-2 expression, and KMT2A-r have statistically significant high levels of BCL-2, phospho-BCL-2 S70, and MCL-1, indicating a high anti-apoptotic pathway activation. In an attempt to target it, we tested novel drug combinations of venetoclax, a B-cell lymphoma-2 (BCL-2) inhibitor, in KMT2A-MLLT3, for being the most recurrent, and KMT2A-AFDN, for mediating the worst prognosis, rearranged AML cell lines. Our screening revealed that both the bromodomain and extra-terminal domain (BET) inhibitor, I-BET151, and kinase inhibitor, sunitinib, decreased the BCL-2 family protein expression and significantly synergized with venetoclax, enhancing KMT2A-r AML cell line death. Blasts t (6; 11) KMT2A-AFDN rearranged, both from cell lines and primary samples, were shown to be significantly highly responsive to the combination of venetoclax and thioridazine, with the synergy being induced by a dramatic increase of mitochondrial depolarization that triggered blast apoptosis. Finally, the efficacy of novel combined drug treatments was confirmed in KMT2A-r AML cell lines or ex vivo primary KMT2A-r AML samples cultured in a three-dimensional system which mimics the bone marrow niche. Overall, this study identified that, by high-throughput screening, the most KMT2A-selective drugs converged in different but all mitochondrial apoptotic network activation, supporting the use of venetoclax in this AML setting. The novel drug combinations here unveiled provide a rationale for evaluating these combinations in preclinical studies to accelerate the introduction of targeted therapies for the life-threatening KMT2A-AML subgroup of pediatric AML.

Keywords: AML; KMT2A; synergy; targeted drugs; venetoclax.


Conflict of interest statement

The authors declare that the research was conducted in the absence of any commercial or financial relationships that could be construed as a potential conflict of interest.

Figures

FIGURE 1
FIGURE 1
Expression of antiapoptotic proteins of BCL-2 family in pediatric acute myeloid leukemia (AML). (A) Supervised analysis according to BCL-2 expression (left panel) and dot plots (right panel) showing BCL-2, BCL-2 S70, and MCL-1 protein expression of a cohort of 66 AML pediatric patients subcategorized in KMT2A-rearranged AML and non-KMT2A-rearranged AML, analyzed with the reverse-phase protein array method. Quartiles refer to BCL-2 expression. Dot plots show the mean ± SEM. A.U., arbitrary units. (B) Pearson correlation between BCL-2 S70 (X-axis) and BCL-2 (Y-axis) in the upper panel and MCL-1 (X-axis) and BCL-2 (Y-axis) in the lower panel; p < 0.00001. (C) Dose–response curve of growing concentrations of venetoclax in KMT2A-rearranged AML (SHI-1, THP-1, and NOMO-1) and non-KMT2A-rearranged AML (HL-60) cell lines at 72 h after treatment (n = 2).
FIGURE 2
FIGURE 2
Combination of venetoclax and I-BET151. (A) Dose–response curve of growing concentrations of I-BET151, sunitinib, and quinacrine in KMT2A-rearranged acute myeloid leukemia (AML; SHI-1, THP-1, and NOMO-1) and non-KMT2A-rearranged AML (HL-60) cell lines at 72 h after treatment (n = 2). (B) Cell viability of SHI-1 and NOMO-1 (KMT2A-rearranged) or HL-60 (non-KMT2A-rearranged) after treatment with I-BET151 combined with venetoclax at 48 h after treatment. The synergy scores were represented by pseudocoloring 2-dimensional contour plots over the dose matrix (red indicates synergy and green indicates antagonism) and calculated using the ZIP model (synergy when >10, n = 2). Stars indicate the concentrations selected for subsequent experiments. (C) Cell viability of SHI-1 and NOMO-1 (KMT2A-rearranged) or HL-60 (non-KMT2A-rearranged) after treatment with venetoclax, I-BET151, or the combination at 48 h after treatment (CI, combination index; synergy when CI <1. ANOVA test was performed by applying Bonferroni correction for multiple statistical hypotheses testing. **p < 0.01, ****p < 0.0001; n = 2). (D) BCL2 expression measured by RQ-PCR at 6 and 24 h post-treatment in SHI-1 and NOMO-1 with respect to control. ANOVA test was performed by applying Bonferroni correction for multiple statistical hypotheses testing. *p < 0.05; n = 2 (E) BCL-2 levels measured at 48 h post-treatment in SHI-1 and NOMO-1. Histograms report the quantification normalized to GAPDH. ANOVA test was performed by applying Bonferroni correction for multiple statistical hypotheses testing. *p < 0.05, ***p < 0.001; n = 2.
FIGURE 3
FIGURE 3
Combination of venetoclax and sunitinib. (A) Cell viability of SHI-1 and NOMO-1 [both KMT2A-rearranged acute myeloid leukemia (AML)] and HL-60 (non-KMT2A-rearranged AML) after treatment with sunitinib combined with venetoclax at 48 h after treatment. The synergy scores were represented by pseudocoloring 2-dimensional contour plots over the dose matrix (red indicates synergy and green indicates antagonism) and calculated using the ZIP model (synergy when >10, n = 2). Stars indicate the concentrations selected for subsequent experiments. (B) Cell viability of SHI-1 and NOMO-1 (KMT2A-arranged) or HL-60 (non-KMT2A-rearranged) after treatment with venetoclax, sunitinib, or the combination at 48 h after treatment (CI, combination index; synergy when CI <1. ANOVA test was performed by applying Bonferroni correction for multiple statistical hypotheses testing. *p < 0.05; **p < 0.01, ***p < 0.001; ****p < 0.0001; n = 2). (C) MCL-1 and BCL-2 levels measured at 48 h post-treatment in SHI-1 and NOMO-1. Histograms report the quantification normalized to GAPDH. ANOVA test was performed by applying Bonferroni correction for multiple statistical hypotheses testing. *p < 0.05, **p < 0.01, ***p < 0.001; n = 2.
FIGURE 4
FIGURE 4
Combination of venetoclax and quinacrine. (A) Cell viability of SHI-1 and NOMO-1 [both KMT2A-rearranged acute myeloid leukemia (AML)] and HL-60 (non-KMT2A-rearranged AML) after treatment with quinacrine combined with venetoclax at 48 h after treatment. The synergy scores were represented by pseudocoloring 2-dimensional contour plots over the dose matrix (red indicates synergy and green indicates antagonism) and calculated using the ZIP model (synergy when >10, n = 2). Stars indicate the concentrations selected for subsequent experiments. (B) Cell viability of SHI-1 and NOMO-1 (KMT2A-arranged) or HL-60 (non-KMT2A-rearranged) after treatment with venetoclax, quinacrine, or the combination at 48 h after treatment (CI, combination index; synergy when CI <1. ANOVA test was performed by applying Bonferroni correction for multiple statistical hypotheses testing. ***p < 0.001, ****p < 0.0001; n = 2).
FIGURE 5
FIGURE 5
Combination of venetoclax and thioridazine in t(6;11)-rearranged acute myeloid leukemia (AML). (A) Cell viability of t (6; 11) SHI-1 and non-t (6; 11) HL-60 after treatment with thioridazine (TDZ) combined with venetoclax (Ven) at 48 h after treatment. The synergy scores were represented by pseudocoloring 2-dimensional contour plots over the dose matrix (red indicates synergy and green indicates antagonism) and calculated using the ZIP model (synergy when >10, n = 2). Stars indicate the concentrations selected for subsequent experiments. (B) Cell viability of t (6; 11) SHI-1 and non-t (6; 11) HL-60 after treatment with venetoclax, thioridazine, or the combination at 48 h after treatment (CI, combination index; synergy when CI <1. ANOVA test was performed by applying Bonferroni correction for multiple statistical hypotheses testing. **p < 0.01, ***p < 0.001; ****p < 0.0001; n = 2). (C) Mitochondrial depolarization evaluated by tetramethylrhodamine ethyl fluorescence measurement at 20 h after Ven (5 µM), TDZ (10 µM), or combination treatment compared with dimethyl sulfoxide in SHI-1 (n = 2). (D) Cell viability of PDX-derived ex vivo t (6; 11) and non-t (6; 11) AML after treatment with venetoclax (1 µM), thioridazine (10 µM) or the combination at 24 h after treatment. ANOVA test was performed by applying Bonferroni correction for multiple statistical hypotheses testing.*p < 0.05; **p < 0.01. (E) Colony-forming assay performed on viable ex vivo cells seeded at 24 h after the combination treatment [venetoclax (1 µM) + thioridazine (10 μM), n = 2].
FIGURE 6
FIGURE 6
Combination treatments in 3D model. (A) Scheme of the in vitro 3D culture setup procedure: hydroxyapatite/collagen scaffolds were allowed to soak for 24 h, then seeded with acute myeloid leukemia (AML)-MSCs (t = 1), and cultured for a further 5 days prior to adding of KMT2A-rearranged AML cells and performing the drug treatment (t = 6). Cell viability was evaluated in the 3D system at 48 h after treatment (t = 8) by ATP 3D assay. (BD) Cell viability of 3D system analyzed at 48 h after drug treatment with venetoclax (1 μM), I-BET151 (2 μM), sunitinib (5 µM), and thioridazine (10 μM) normalized to the respective controls (dimethyl sulfoxide; n = 3) in SHI-1 and NOMO-1 cell lines (B, C) and AML primary samples (D, E). CI, combination index; synergy when CI <1. ANOVA test was performed by applying Bonferroni correction for multiple statistical hypotheses testing. *p < 0.05; **p < 0.01; ***p < 0.001; ****p < 0.0001.

References

    1. Ashkenazi A., Fairbrother W. J., Leverson J. D., Souers A. J. (2017). From Basic Apoptosis Discoveries to Advanced Selective BCL-2 Family Inhibitors. Nat. Rev. Drug Discov. 16, 273–284. 10.1038/nrd.2016.253 - DOI - PubMed
    1. Aveic S., Viola G., Accordi B., Micalizzi C., Santoro N., Masetti R., et al. (2015). Targeting BAG-1: A Novel Strategy to Increase Drug Efficacy in Acute Myeloid Leukemia. Exp. Hematol. 43, 180. 10.1016/j.exphem.2014.10.016 - DOI - PubMed
    1. Balgobind B. V., Raimondi S. C., Harbott J., Zimmermann M., Alonzo T. A., Auvrignon A., et al. (2009). Novel Prognostic Subgroups in Childhood 11q23/MLL-Rearranged Acute Myeloid Leukemia: Results of an International Retrospective Study. Blood 114, 2489–2496. 10.1182/blood-2009-04-215152 - DOI - PMC - PubMed
    1. Bensi L., Longo R., Vecchi A., Messora C., Garagnani L., Bernardi S., et al. (1995). BCL-2 Oncoprotein Expression in Acute Myeloid Leukemia. Haematologica 80, 98–102. - PubMed
    1. Bisio V., Zampini M., Tregnago C., Manara E., Salsi V., Di Meglio a., et al. (2017). NUP98-fusion Transcripts Characterize Different Biological Entities within Acute Myeloid Leukemia: a Report from the AIEOP-AML Group. Leukemia 31, 974–977. 10.1038/leu.2016.361 - DOI - PubMed