Review
. 2022 Jan 28:13:832417.
doi: 10.3389/fphys.2022.832417. eCollection 2022.

Spatial Statistics for Understanding Tissue Organization

Affiliations
Review

Spatial Statistics for Understanding Tissue Organization

Andrea Behanova et al. Front Physiol. .

Abstract

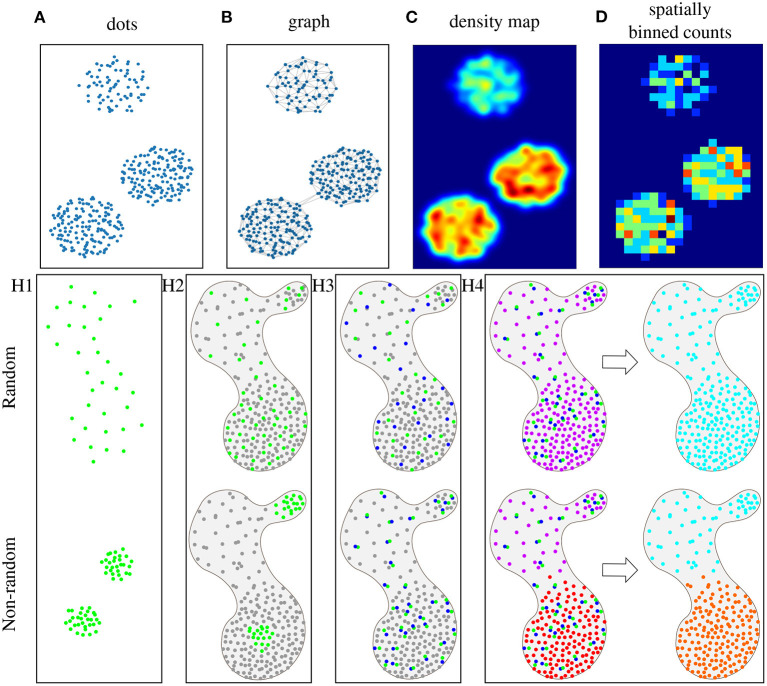
Interpreting tissue architecture plays an important role in gaining a better understanding of healthy tissue development and disease. Novel molecular detection and imaging techniques make it possible to locate many different types of objects, such as cells and/or mRNAs, and map their location across the tissue space. In this review, we present several methods that provide quantification and statistical verification of observed patterns in the tissue architecture. We categorize these methods into three main groups: Spatial statistics on a single type of object, two types of objects, and multiple types of objects. We discuss the methods in relation to four hypotheses regarding the methods' capability to distinguish random and non-random distributions of objects across a tissue sample, and present a number of openly available tools where these methods are provided. We also discuss other spatial statistics methods compatible with other types of input data.

Keywords: gene expression; niches; spatial statistics; tissue analysis; tissue organization; transcriptomics.


Conflict of interest statement

The authors declare that the research was conducted in the absence of any commercial or financial relationships that could be construed as a potential conflict of interest.

Figures

Figure 1
Figure 1
Schematic representations of objects, such as cells or mRNAs, in microscopy images, where each dot represents an object, and the color reflects the object type (where gray is an unspecified type). (A) Simple representation, where each dot has a specific location in 2D tissue space. (B) The same data represented as a graph, where each dot is a node, and nodes are connected based on a maximum distance criterion. (C) Dots can also be represented by a probability density map, where warmer colors represent more dense dots, or (D) as counts in fixed spatial bins. Here, bins are squares and warmer colors represent higher object counts per bin. Spatial statistics are used to prove four different hypothesis (with the top row representing the random case): (H1) Visualization of hypothesis H1: Objects of type A (green) are non-randomly distributed. (H2) Visualization of hypothesis H2: Objects of type A (green) are non-randomly distributed as compared to the distribution of other objects (gray) in the same tissue sample. (H3) Visualization of hypothesis H3: Objects of type A (green) and B (blue) are non-randomly distributed in relation to one another within the distribution of other objects (gray) in the same tissue sample. (H4) Visualization of hypothesis H4: There are groups of object types (multiple colors in “niches”) that are non-randomly distributed within the tissue sample.

References

    1. Blondel V. D., Guillaume J.-L., Lambiotte R., Lefebvre E. (2008). Fast unfolding of communities in large networks. J. Stat. Mech. 2008, P10008. 10.1088/1742-5468/2008/10/P10008 - DOI - PubMed
    1. Codeluppi S., Borm L. E., Zeisel A., Manno G. L., van Lunteren J. A., Svensson C. I., et al. . (2018). Spatial organization of the somatosensory cortex revealed by osmFISH. Nat. Methods 15, 932–935. 10.1038/s41592-018-0175-z - DOI - PubMed
    1. Dries R., Zhu Q., Dong R., Eng C.-H. L., Li H., Liu K., et al. . (2021). Giotto: a toolbox for integrative analysis and visualization of spatial expression data. Genome Biol. 22, 78. 10.1186/s13059-021-02286-2 - DOI - PMC - PubMed
    1. Edsgärd D., Johnsson P., Sandberg R. (2018). Identification of spatial expression trends in single-cell gene expression data. Nat. Methods 15, 339–342. 10.1038/nmeth.4634 - DOI - PMC - PubMed
    1. Eng C.-H. L., Lawson M., Zhu Q., Dries R., Koulena N., Takei Y., et al. . (2019). Transcriptome-scale super-resolved imaging in tissues by rna seqfish+. Nature 568, 235–239. 10.1038/s41586-019-1049-y - DOI - PMC - PubMed

LinkOut - more resources