. 2022 Jan 27:13:722900.
doi: 10.3389/fmicb.2022.722900. eCollection 2022.

Bacterioplankton Diversity and Distribution in Relation to Phytoplankton Community Structure in the Ross Sea Surface Waters

Affiliations

Bacterioplankton Diversity and Distribution in Relation to Phytoplankton Community Structure in the Ross Sea Surface Waters

Angelina Cordone et al. Front Microbiol. .

Abstract

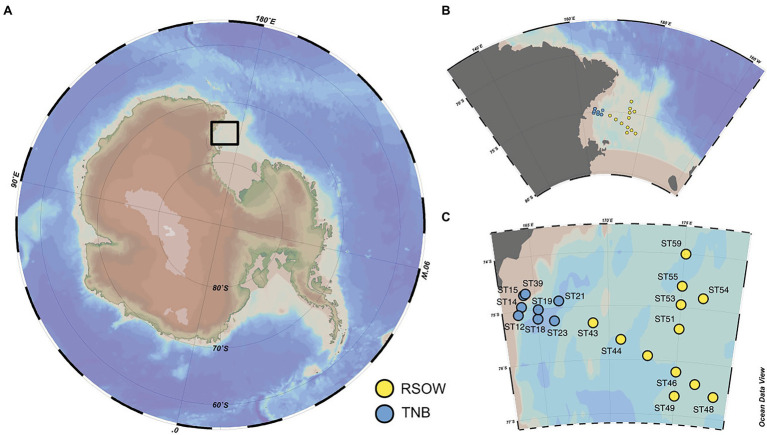
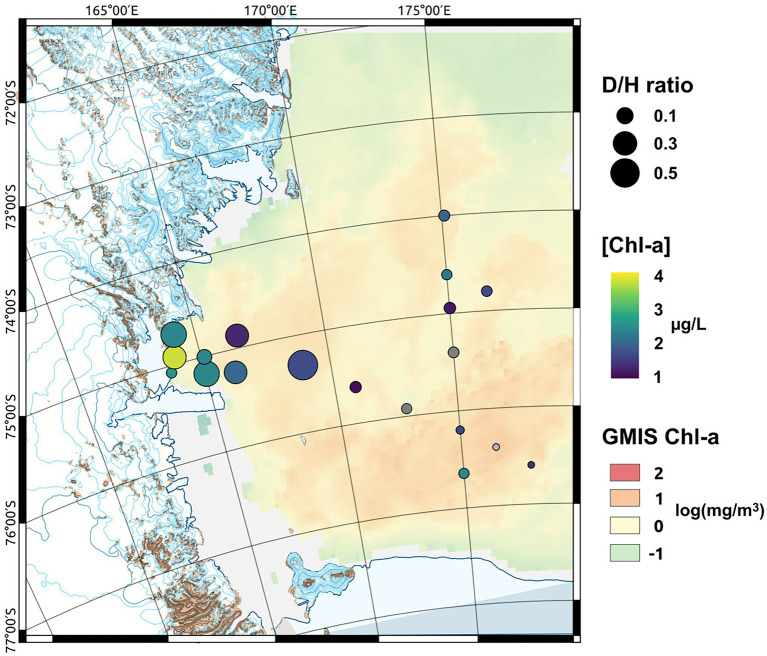
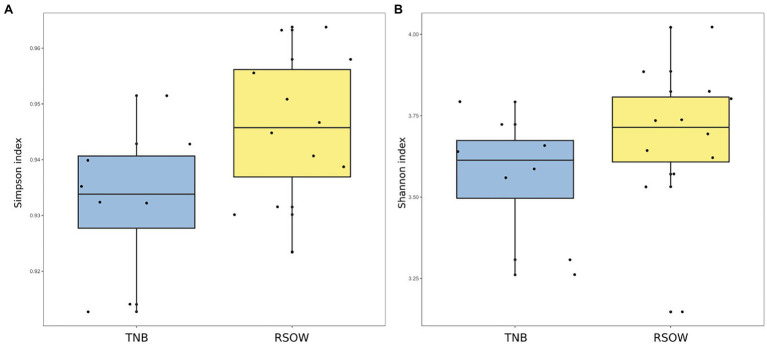
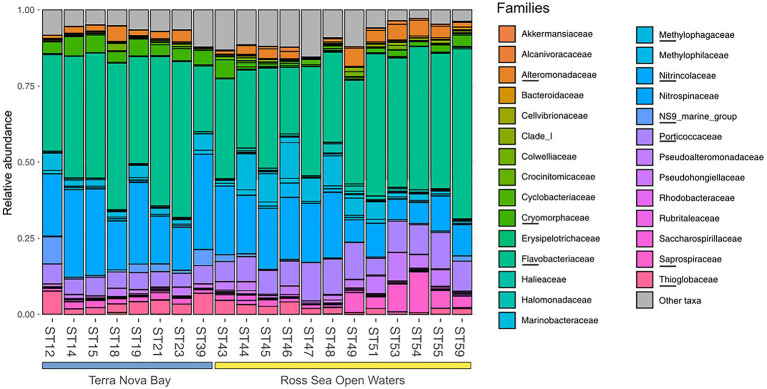
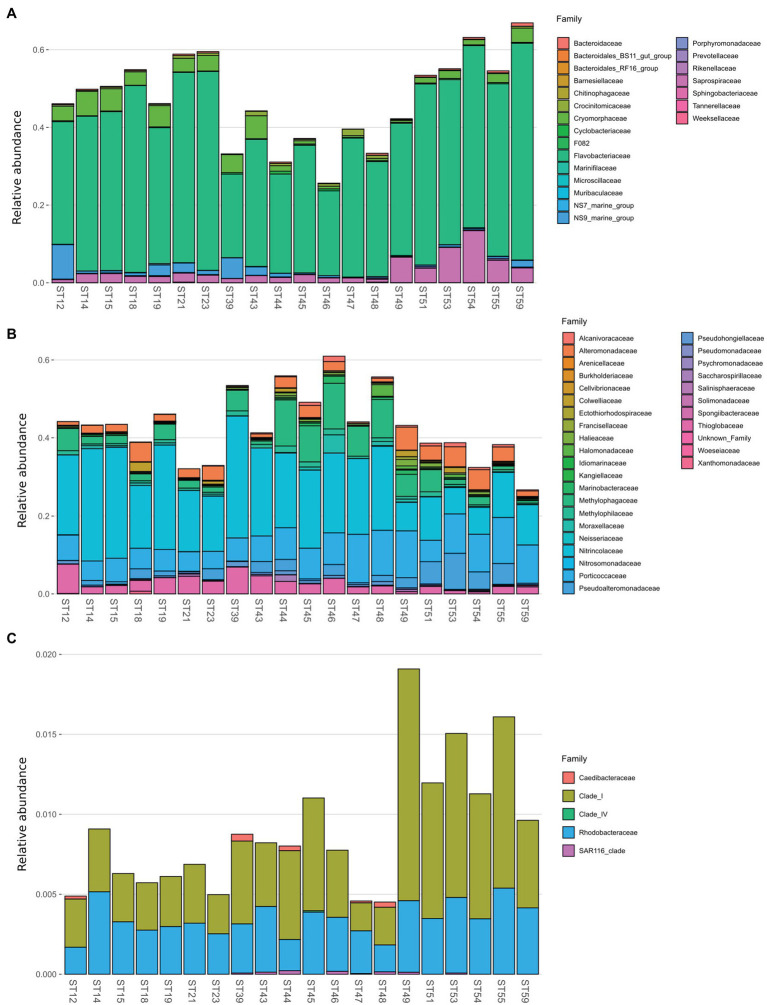
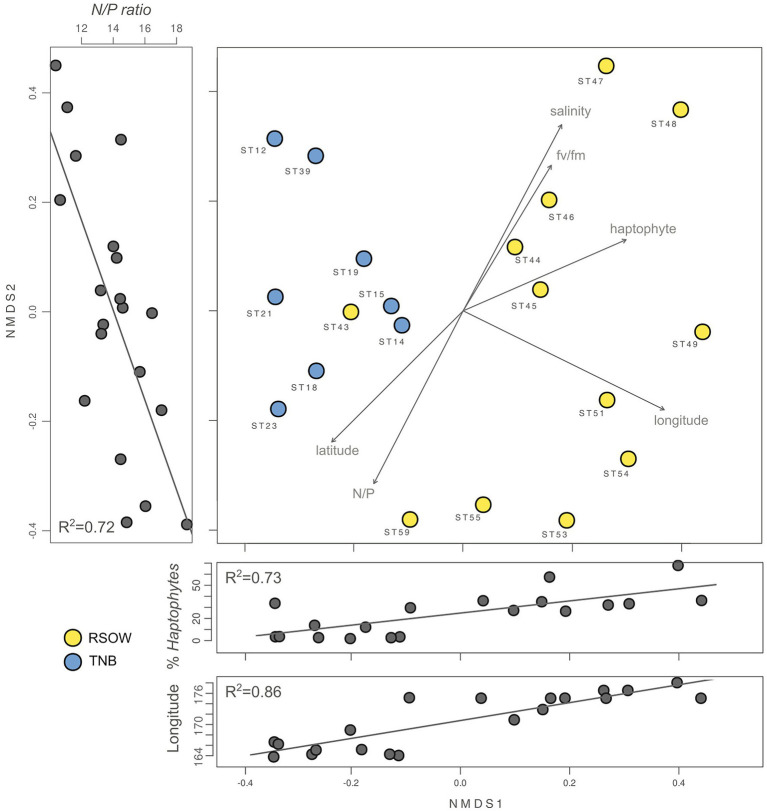
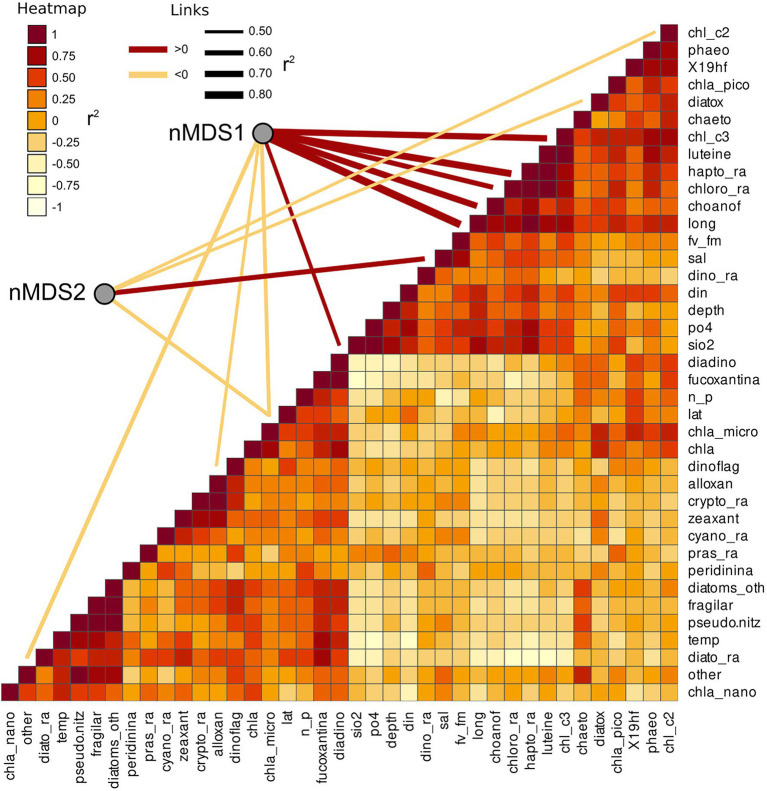
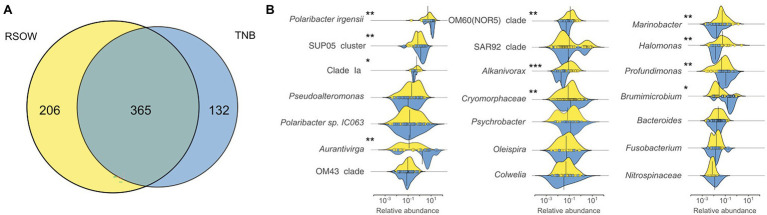
Primary productivity in the Ross Sea region is characterized by intense phytoplankton blooms whose temporal and spatial distribution are driven by changes in environmental conditions as well as interactions with the bacterioplankton community. However, the number of studies reporting the simultaneous diversity of the phytoplankton and bacterioplankton in Antarctic waters are limited. Here, we report data on the bacterial diversity in relation to phytoplankton community structure in the surface waters of the Ross Sea during the Austral summer 2017. Our results show partially overlapping bacterioplankton communities between the stations located in the Terra Nova Bay (TNB) coastal waters and the Ross Sea Open Waters (RSOWs), with a dominance of members belonging to the bacterial phyla Bacteroidetes and Proteobacteria. In the TNB coastal area, microbial communities were characterized by a higher abundance of sequences related to heterotrophic bacterial genera such as Polaribacter spp., together with higher phytoplankton biomass and higher relative abundance of diatoms. On the contrary, the phytoplankton biomass in the RSOW were lower, with relatively higher contribution of haptophytes and a higher abundance of sequences related to oligotrophic and mixothrophic bacterial groups like the Oligotrophic Marine Gammaproteobacteria (OMG) group and SAR11. We show that the rate of diversity change between the two locations is influenced by both abiotic (salinity and the nitrogen to phosphorus ratio) and biotic (phytoplankton community structure) factors. Our data provide new insight into the coexistence of the bacterioplankton and phytoplankton in Antarctic waters, suggesting that specific rather than random interaction contribute to the organic matter cycling in the Southern Ocean.

Keywords: Antarctica; Ross Sea; bacterial diversity; bacterioplankton; phytoplankton.


Conflict of interest statement

The authors declare that the research was conducted in the absence of any commercial or financial relationships that could be construed as a potential conflict of interest.

Figures

Figure 1
Figure 1
Study location and distribution of the sampled stations across the Ross Sea. (A) Location of the study site within the Ross Sea. (B,C) Details of the spatial distribution of the sampled stations and their division in Terra Nova Bay (TNB) stations proximal to the sea-ice border and the coast and the Ross Sea Open Waters (RSOW) stations, located further off-shore. This division and color scheme is consistent throughout the paper.
Figure 2
Figure 2
Map of the sampled area showing the monthly mean sea surface Chlorophyll-a (Chl-a) concentration [in log(mg m−3) at 4 km resolution GMIS Chl-a] derived from satellite observation, the measured Chl-a concentrations measured at the sampled depth ([Chl-a]) and the diatoms to haptophytes ratio (D/H ratio) describing the shift in the phytoplankton community composition.
Figure 3
Figure 3
Alpha diversity metrics across the two sampled areas. (A) Simpson diversity index and (B) Shannon diversity index.
Figure 4
Figure 4
Family level distribution of the 16S rRNA diversity at the deep-chlorophyll maximum of the sampled stations. Only the most abundant families are reported, while the rare taxa are grouped together in the Other taxa category. Stations are grouped with a horizontal bar in two distinct clusters representing the TNB stations and the RSOW stations. Relative abundance reported as 1 = 100% of the total bacterial reads.
Figure 5
Figure 5
Family level distribution of the 16S rRNA diversity within the class Bacteroidia (A), Gammaproteobacteria (B), and Alphaproteobacteria (C) for the sample stations.
Figure 6
Figure 6
Non-metric multidimensional scaling (nMDS, stress 0.02) plot of the 16S rRNA gene amplicon microbial diversity based on Jaccard dissimilarity measure overlaid with environmental vector fitting. The lateral panels show the Pearson moment correlation (R2) between the respective nMDS axis and selected environmental and phytoplankton variables.
Figure 7
Figure 7
Collinearity of the environmental and phytoplankton variables used as predictors of bacterial beta diversity. The nMDS axes are connected with significant predictors through a line showing the correlation direction (color) and intensity (line thickness). Collinearity among the predictors was calculated as Pearson moment correlation and plotted as a heatmap.
Figure 8
Figure 8
Shared and unique Amplicon Sequence Variants (ASVs) among the two sampled areas (A) and density function of the abundance of the top genera shared among the sampled areas (B). Density plots showing the differential distribution of the major genera between the two sampled areas. The x axis represents the relative abundance of each ASV in the genera while the y axis shows the relative density functions. The vertical solid line represents the mean relative abundance for those genera in the area. Differentially abundant genera are marked with an * according to the result of the Kruskal–Wallis test (*adj.p < 0.05; **adj.p < 0.01; and ***adj.p < 0.001).
Figure 9
Figure 9
Co-occurrence network analysis drawn with increasing Spearman correlation cut off and colored according to the phyla classification of each ASVs.

References

    1. Abell G. C. J., Bowman J. P. (2005). Ecological and biogeographic relationships of class flavobacteria in the Southern Ocean. FEMS Microbiol. Ecol. 51, 265–277. doi: 10.1016/j.femsec.2004.09.001, PMID: - DOI - PubMed
    1. Amin S. A., Hmelo L. R., van Tol H. M., Durham B. P., Carlson L. T., Heal K. R., et al. . (2015). Interaction and signalling between a cosmopolitan phytoplankton and associated bacteria. Nature 522, 98–101. doi: 10.1038/nature14488, PMID: - DOI - PubMed
    1. Amin S. A., Parker M. S., Armbrust E. V. (2012). Interactions between diatoms and bacteria. Microbiol. Mol. Biol. Rev. 76, 667–684. doi: 10.1128/MMBR.00007-12, PMID: - DOI - PMC - PubMed
    1. Arrigo K. R., Robinson D. H., Worthen D. L., Dunbar R. B., DiTullio G. R., VanWoert M., et al. . (1999). Phytoplankton community structure and the drawdown of nutrients and CO2 in the Southern Ocean. Science 283, 365–367. doi: 10.1126/science.283.5400.365, PMID: - DOI - PubMed
    1. Arrigo K. R., van Dijken G. L., Bushinsky S. (2008). Primary production in the Southern Ocean, 1997–2006. J. Geophys. Res. 113:C08004. doi: 10.1029/2007JC004551 - DOI