. 2022 Jan 27:13:773001.
doi: 10.3389/fimmu.2022.773001. eCollection 2022.

Purine-Induced IFN-γ Promotes Uric Acid Production by Upregulating Xanthine Oxidoreductase Expression

Affiliations

Purine-Induced IFN-γ Promotes Uric Acid Production by Upregulating Xanthine Oxidoreductase Expression

Huanhuan Wang et al. Front Immunol. .

Abstract

Objective: Limiting purine intake, inhibiting xanthine oxidoreductase (XOR) and inhibiting urate reabsorption in proximal tubule by uricosuric drugs, to reduce serum uric acid (UA) levels, are recognized treatments for gout. However, the mechanism of increased how XOR expression and activity in hyperuricemia and gout remains unclear. This study aims to explore whether exogenous purines are responsible for increased XOR expression and activity.

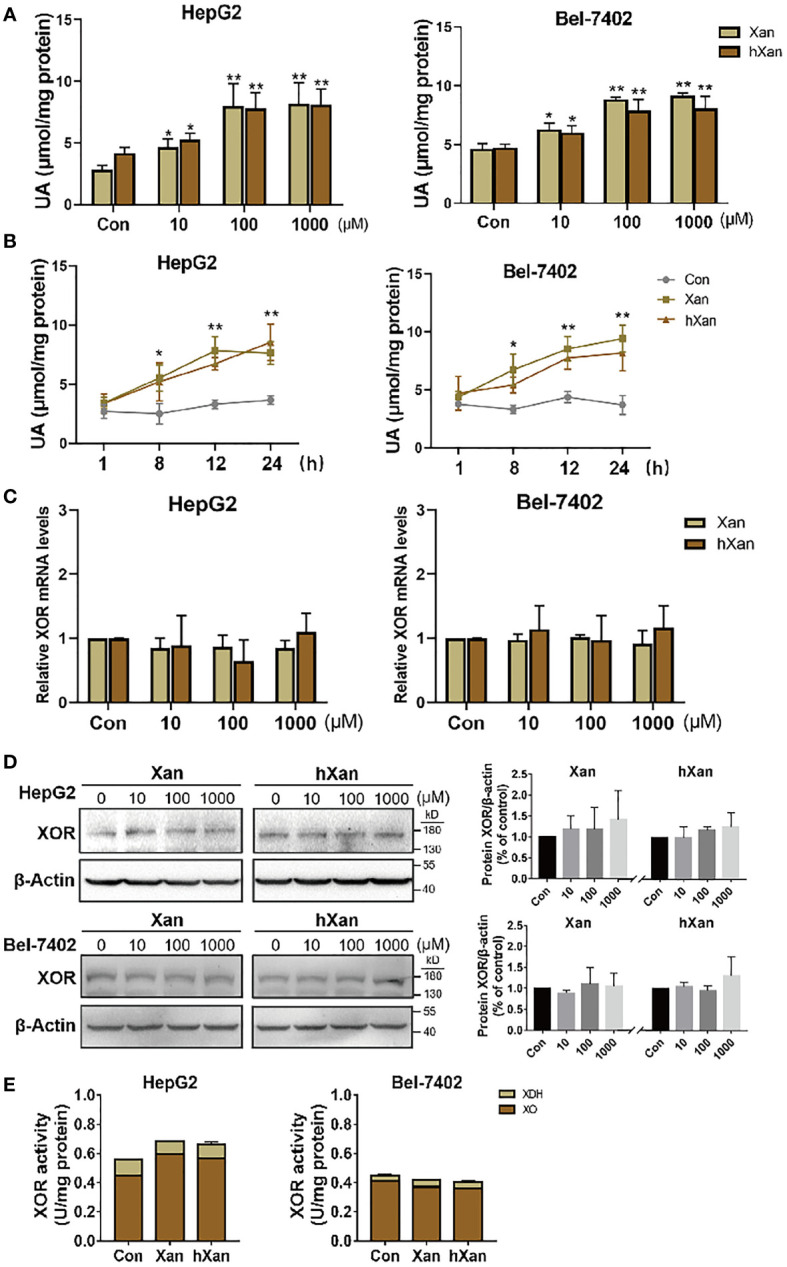
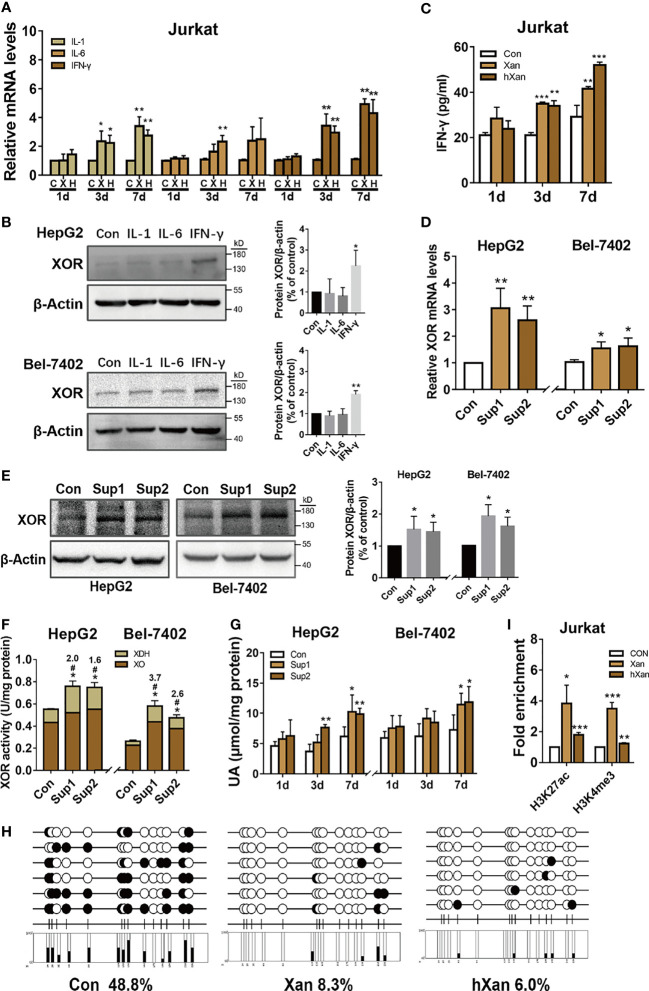
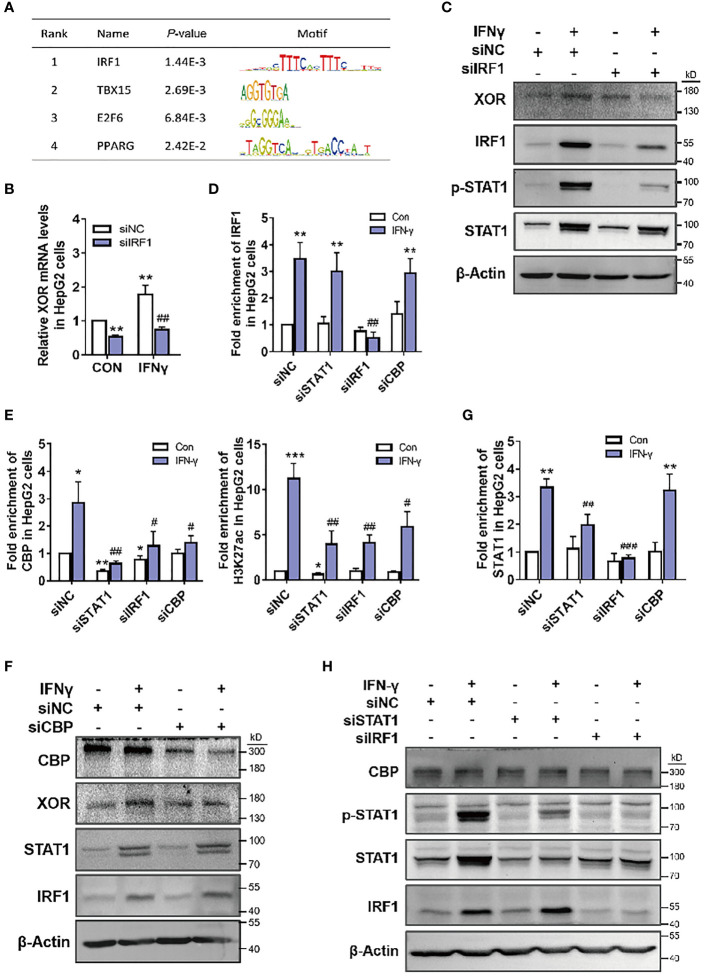
Methods: HepG2 and Bel-7402 human hepatoma cells were stimulated with exogenous purine, or were exposed to conditioned growth medium of purine-stimulated Jurkat cells, followed by measurement of XOR expression and UA production to determine the effect of lymphocyte-secreted cytokines on XOR expression in hepatocytes. The expression of STAT1, IRF1 and CBP and their binding on the XDH promoter were detected by western blotting and ChIP-qPCR. The level of DNA methylation was determined by bisulfite sequencing PCR. Blood samples from 117 hyperuricemia patients and 119 healthy individuals were collected to analyze the correlation between purine, UA and IFN-γ concentrations.

Results: Excess of purine was metabolized to UA in hepatocyte metabolism by XOR that was induced by IFN-γ secreted in the conditioned growth medium of Jurkat cells in response to exogenous purine, but it did not directly induce XOR expression. IFN-γ upregulated XOR expression due to the enhanced binding of STAT1 to IRF1 to further recruit CBP to the XDH promoter. Clinical data showed positive correlation of serum IFN-γ with both purine and UA, and associated risk of hyperuricemia.

Conclusion: Purine not only acts as a metabolic substrate of XOR for UA production, but it induces inflammation through IFN-γ secretion that stimulates UA production through elevation of XOR expression.

Keywords: IFN-γ; IRF1; STAT1; hyperuricemia; purine; xanthine oxidoreductase.


Conflict of interest statement

The authors declare that the research was conducted in the absence of any commercial or financial relationships that could be construed as a potential conflict of interest.

Figures

Figure 1
Figure 1
Exogenous purines elevate UA production in hepatic cell lines without affecting XOR expression. (A) HepG2 and Bel-7402 cells were maintained in purine for 24 h at different concentrations, or (B) 100 µM purine for varying intervals of time, and then UA levels were determined by a coupled enzyme assay. (C) Expression of XOR mRNA levels, (D) protein levels and (E) XOR activity were detected in HepG2 and Bel-7402 cells after maintenance in 100 μM purine for 24 h. Significance for all data was determined by the independent samples t-test. Data are shown as mean ± S.D., *p < 0.05, **p < 0.01.
Figure 2
Figure 2
IFN-γ secreted from lymphoblast (Jurkat cells) upon induction by exogenous purine upregulates XOR expression in hepatic cell lines. (A) The expression levels of mRNAs for IL-1, IL-6 or IFN-γ in Jurkat were determined by qPCR after treatment with 100 μM purine for 1 to 7 days. (B) The expression levels of XOR protein in HepG2 and Bel-7402 cells were determined by western blotting after treatment with IL-1, IL-6 or IFN-γ for 24 h. (C) Levels of IFN-γ in the culture medium of Jurkat cells were determined by ELISA after treatment with 100 μM Xan and hXan for 1 to 7 days. (D, E) HepG2 and Bel-7402 cells were cultured for 24 h in conditioned growth medium after 7 days of growth of Jurkat cells in presence of 100 μM purines. The expression levels of XOR mRNA and protein in hepatic cells were determined by qPCR and western blotting respectively. (F, G) The XOR activity and intracellular UA levels were determined by enzyme coupling assay. (H) The DNA methylation level of CpG islands (black circle: methylated, white circle: unmethylated) in the IFN-γ promoter were determined by BSP, and (I) the enrichment levels of H3K27ac and H3K4me3 in the IFN-γ promoter were assessed by ChIP-qPCR after treatment of Jurkat with Xan and hXan for 7 days. Significance for all data determined by the independent samples t-test. Data are shown as mean ± S.D., *p < 0.05, **p < 0.01, ***p < 0.001. (F) *p < 0.05 compared with Con XOR, # p < 0.05 compared with Con XDH.
Figure 3
Figure 3
IFN-γ upregulates XOR expression by stimulating expression and activation of the STAT1. (A-D) HepG2 and Bel-7402 cells were incubated with varying concentrations of IFN-γ for varying time intervals and then XOR mRNA and protein expression were measured by qPCR and western blotting respectively. (E, F) HepG2 and Bel-7402 cells were treated with IFN-γ (10 ng/ml) for 24 h and then XOR activity and intracellular UA content were measured by enzyme coupling assay. (G) The protein expression levels of XOR, IFNGR1, STAT1 and STAT3 were examined by western blotting and (I) the enrichment of STAT1 and STAT3 were assessed by ChIP-qPCR. (H) The effect of IFN-γ (10 ng/ml) on the expression of XOR, IFNGR1 and STAT1 proteins were examined after pre-treatment with cycloheximide (CHX) (500 nM) for 24h. (J, K) After transfection with siRNA for 48h, HepG2 cells were treated with IFN-γ (10 ng/ml) and then the expression of XOR and STAT1 proteins were determined by western blotting. (K) The enrichment of STAT1 at the XDH promoter were assessed by ChIP-qPCR. Significance for all data determined by the independent samples t-test. Data are shown as mean ± S.D., *p < 0.05, **p < 0.01. (E) *p < 0.05 compared with control XOR, # p < 0.05, ## p < 0.01 compared with control XDH. (K) *p < 0.05 compared with control siNC (negative control siRNA); # p < 0.05 compared with IFN-γ siNC.
Figure 4
Figure 4
CBP is recruited by STAT1-IRF1 to upregulate XOR expression in HepG2 cells. (A) Analysis of the XDH promoter sequence using transcription factor affinity prediction (TRAP) web tools (http://trap.molgen.mpg.de/cgi-bin/trap_multi_seq_form.cgi). (B, C) XOR mRNA and protein expression, after treatment with siNC or siIRF1 for 48 h; (D) IRF1, (E) CBP and H3K27ac, (G) STAT1 enrichment after treatment with siNC, siIRF1, siSTAT1 for 48 h or with siCBP for 24 h; (F) CBP, XOR, STAT1 and IRF1 protein expression after treatment with siNC or siCBP for 24 h; (H) CBP, p-STAT1, STAT1, and IRF1 protein expression after treatment with siNC, siSTAT1 or siIRF1 for 48 h, in HepG2 cells treated with or without IFN-γ (10 nM). Significance for all data was determined by the independent samples t-test. Data are shown as mean ± S.D., *p < 0.05, **p < 0.01 compared with Control; # p < 0.05, ## p < 0.01, ### p < 0.001 compared with IFN-γ.
Figure 5
Figure 5
Correlation analysis of Xan, hXan, IFN-γ and UA in normal healthy individuals and hyperuricemia patients. (A) Serum UA levels were determined by a coupled enzyme assay. (B) Serum IFN-γ levels were determined by ELISA. (C, D) Serum Xan and hXan levels were determined by LC/MS. (E) Spearman’s correlation model was used to evaluate the correlation of serum Xan, hXan, UA and IFN-γ levels (natural logarithm lnIFN-γ data). (F) The multiple linear regression model analysis was performed between serum Xan, hXan variables and lnIFN-γ as variables. Model 1: unadjusted. Model 2: adjusted for age and gender. Model 3: adjusted for age, gender, AST, and ALT. Model 4: adjusted for age, gender, AST, ALT, TC, TG, and GLU. (G) Multiple linear regression model analysis was performed between IFN-γ variables and serum UA variables. Models 1-3 same as above. Model 4: adjusted for age, gender, AST, ALT, TC, and GLU. (A–D) Significance determined by the independent samples t-test. Data are shown as mean ± S.D., **p < 0.01, ***p < 0.001.

References

    1. Lu J, Dalbeth N, Yin H, Li C, Merriman TR, Wei WH. Mouse Models for Human Hyperuricaemia: A Critical Review. Nat Rev Rheumatol (2019) 15(7):413–26. doi: 10.1038/s41584-019-0222-x - DOI - PubMed
    1. Agarwal A, Banerjee A, Banerjee UC. Xanthine Oxidoreductase: A Journey From Purine Metabolism to Cardiovascular Excitation-Contraction Coupling. Crit Rev Biotechnol (2011) 31(3):264–80. doi: 10.3109/07388551.2010.527823 - DOI - PubMed
    1. Hong F, Zheng A, Xu P, Wang J, Xue T, Dai S, et al. High-Protein Diet Induces Hyperuricemia in a New Animal Model for Studying Human Gout. Int J Mol Sci (2020) 21(6):2147. doi: 10.3390/ijms21062147 - DOI - PMC - PubMed
    1. Battelli MG, Bortolotti M, Polito L, Bolognesi A. The Role of Xanthine Oxidoreductase and Uric Acid in Metabolic Syndrome. Biochim Biophys Acta Mol Basis Dis (2018) 1864(8):2557–65. doi: 10.1016/j.bbadis.2018.05.003 - DOI - PubMed
    1. Fini MA, Orchard-Webb D, Kosmider B, Amon JD, Kelland R, Shibao G, et al. Migratory Activity of Human Breast Cancer Cells Is Modulated by Differential Expression of Xanthine Oxidoreductase. J Cell Biochem (2008) 105(4):1008–26. doi: 10.1002/jcb.21901 - DOI - PMC - PubMed

Publication types