Mast Cell Chymase/Mcpt4 Suppresses the Host Immune Response to Plasmodium yoelii, Limits Malaria-Associated Disruption of Intestinal Barrier Integrity and Reduces Parasite Transmission to Anopheles stephensi
- PMID: 35154114
- PMCID: PMC8829543
- DOI: 10.3389/fimmu.2022.801120
Mast Cell Chymase/Mcpt4 Suppresses the Host Immune Response to Plasmodium yoelii, Limits Malaria-Associated Disruption of Intestinal Barrier Integrity and Reduces Parasite Transmission to Anopheles stephensi
Abstract
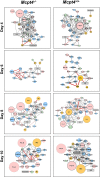
An increase in mast cells (MCs) and MCs mediators has been observed in malaria-associated bacteremia, however, the role of these granulocytes in malarial immunity is poorly understood. Herein, we studied the role of mouse MC protease (Mcpt) 4, an ortholog of human MC chymase, in malaria-induced bacteremia using Mcpt4 knockout (Mcpt4-/-) mice and Mcpt4+/+ C57BL/6J controls, and the non-lethal mouse parasite Plasmodium yoelii yoelii 17XNL. Significantly lower parasitemia was observed in Mcpt4-/- mice compared with Mcpt4+/+ controls by day 10 post infection (PI). Although bacterial 16S DNA levels in blood were not different between groups, increased intestinal permeability to FITC-dextran and altered ileal adherens junction E-cadherin were observed in Mcpt4-/- mice. Relative to infected Mcpt4+/+ mice, ileal MC accumulation in Mcpt4-/- mice occurred two days earlier and IgE levels were higher by days 8-10 PI. Increased levels of circulating myeloperoxidase were observed at 6 and 10 days PI in Mcpt4+/+ but not Mcpt4-/- mice, affirming a role for neutrophil activation that was not predictive of parasitemia or bacterial 16S copies in blood. In contrast, early increased plasma levels of TNF-α, IL-12p40 and IL-3 were observed in Mcpt4-/- mice, while levels of IL-2, IL-10 and MIP1β (CCL4) were increased over the same period in Mcpt4+/+ mice, suggesting that the host response to infection was skewed toward a type-1 immune response in Mcpt4-/- mice and type-2 response in Mcpt4+/+ mice. Spearman analysis revealed an early (day 4 PI) correlation of Mcpt4-/- parasitemia with TNF-α and IFN-γ, inflammatory cytokines known for their roles in pathogen clearance, a pattern that was observed in Mcpt4+/+ mice much later (day 10 PI). Transmission success of P. y. yoelii 17XNL to Anopheles stephensi was significantly higher from infected Mcpt4-/- mice compared with infected Mcpt4+/+ mice, suggesting that Mcpt4 also impacts transmissibility of sexual stage parasites. Together, these results suggest that early MCs activation and release of Mcpt4 suppresses the host immune response to P. y. yoelii 17XNL, perhaps via degradation of TNF-α and promotion of a type-2 immune response that concordantly protects epithelial barrier integrity, while limiting the systemic response to bacteremia and parasite transmissibility.
Keywords: Anopheles stephensi; Mcpt4; Plasmodium yoelii; bacteremia; chymase; intestinal permeability; malaria; mast cells.
Copyright © 2022 Céspedes, Donnelly, Lowder, Hansten, Wagers, Briggs, Schauer, Haapanen, Åbrink, Van de Water and Luckhart.
Conflict of interest statement
The authors declare that the research was conducted in the absence of any commercial or financial relationships that could be construed as a potential conflict of interest.
Figures


Similar articles
-
Mast cell-derived IL-10 protects intestinal barrier integrity during malaria in mice and regulates parasite transmission to Anopheles stephensi with a female-biased immune response.Infect Immun. 2024 Mar 12;92(3):e0036023. doi: 10.1128/iai.00360-23. Epub 2024 Feb 1. Infect Immun. 2024. PMID: 38299826 Free PMC article.
-
Basophil-Derived IL-4 and IL-13 Protect Intestinal Barrier Integrity and Control Bacterial Translocation during Malaria.Immunohorizons. 2024 May 1;8(5):371-383. doi: 10.4049/immunohorizons.2300084. Immunohorizons. 2024. PMID: 38780542 Free PMC article.
-
Nonlethal Plasmodium yoelii Infection Drives Complex Patterns of Th2-Type Host Immunity and Mast Cell-Dependent Bacteremia.Infect Immun. 2020 Nov 16;88(12):e00427-20. doi: 10.1128/IAI.00427-20. Print 2020 Nov 16. Infect Immun. 2020. PMID: 32958528 Free PMC article.
-
Plasmodium yoelii as a model for malaria: insights into pathogenesis, drug resistance, and vaccine development.Mol Biol Rep. 2025 Feb 5;52(1):208. doi: 10.1007/s11033-025-10318-4. Mol Biol Rep. 2025. PMID: 39907835 Free PMC article. Review.
-
Malaria-induced bacteremia as a consequence of multiple parasite survival strategies.Curr Res Microb Sci. 2021 May 8;2:100036. doi: 10.1016/j.crmicr.2021.100036. eCollection 2021 Dec. Curr Res Microb Sci. 2021. PMID: 34841327 Free PMC article. Review.
Cited by
-
Role of mast cell-derived exosomes in exacerbating neuronal injury of experimental cerebral malaria.Parasit Vectors. 2025 Jul 1;18(1):249. doi: 10.1186/s13071-025-06863-3. Parasit Vectors. 2025. PMID: 40598575 Free PMC article.
-
Mast cell-derived IL-10 protects intestinal barrier integrity during malaria in mice and regulates parasite transmission to Anopheles stephensi with a female-biased immune response.Infect Immun. 2024 Mar 12;92(3):e0036023. doi: 10.1128/iai.00360-23. Epub 2024 Feb 1. Infect Immun. 2024. PMID: 38299826 Free PMC article.
-
A Novel Mast Cell Stabilizer JM25-1 Rehabilitates Impaired Gut Barrier by Targeting the Corticotropin-Releasing Hormone Receptors.Pharmaceuticals (Basel). 2022 Dec 29;16(1):47. doi: 10.3390/ph16010047. Pharmaceuticals (Basel). 2022. PMID: 36678544 Free PMC article.
-
Basophil Depletion Alters Host Immunity, Intestinal Permeability, and Mammalian Host-to-Mosquito Transmission in Malaria.Immunohorizons. 2022 Aug 15;6(8):581-599. doi: 10.4049/immunohorizons.2200055. Immunohorizons. 2022. PMID: 35970557 Free PMC article.
-
Basophil-Derived IL-4 and IL-13 Protect Intestinal Barrier Integrity and Control Bacterial Translocation during Malaria.Immunohorizons. 2024 May 1;8(5):371-383. doi: 10.4049/immunohorizons.2300084. Immunohorizons. 2024. PMID: 38780542 Free PMC article.
References
-
- WHO . “World Malaria Report 2020: 20 Years of Global Progress and Challenges”. Geneva: World Health Organization; (2020).
-
- Aung NM, Nyein PP, Htut TY, Htet ZW, Kyi TT, Anstey NM, et al. . Antibiotic Therapy in Adults With Malaria (ANTHEM): High Rate of Clinically Significant Bacteremia in Hospitalized Adults Diagnosed With Falciparum Malaria. Am J Trop Med Hyg (2018) 99(3):688–96. doi: 10.4269/ajtmh.18-0378 - DOI - PMC - PubMed
Publication types
MeSH terms
Substances
Grants and funding
LinkOut - more resources
Full Text Sources
Medical
Molecular Biology Databases
Research Materials
Miscellaneous

