. 2022 Jan 27:13:803417.
doi: 10.3389/fimmu.2022.803417. eCollection 2022.

Deep Phenotypic Analysis of Blood and Lymphoid T and NK Cells From HIV+ Controllers and ART-Suppressed Individuals

Affiliations

Deep Phenotypic Analysis of Blood and Lymphoid T and NK Cells From HIV+ Controllers and ART-Suppressed Individuals

Ashley F George et al. Front Immunol. .

Abstract

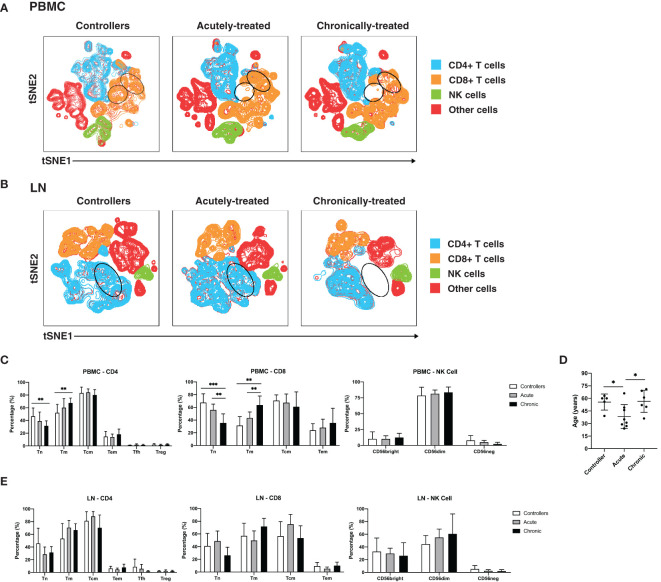
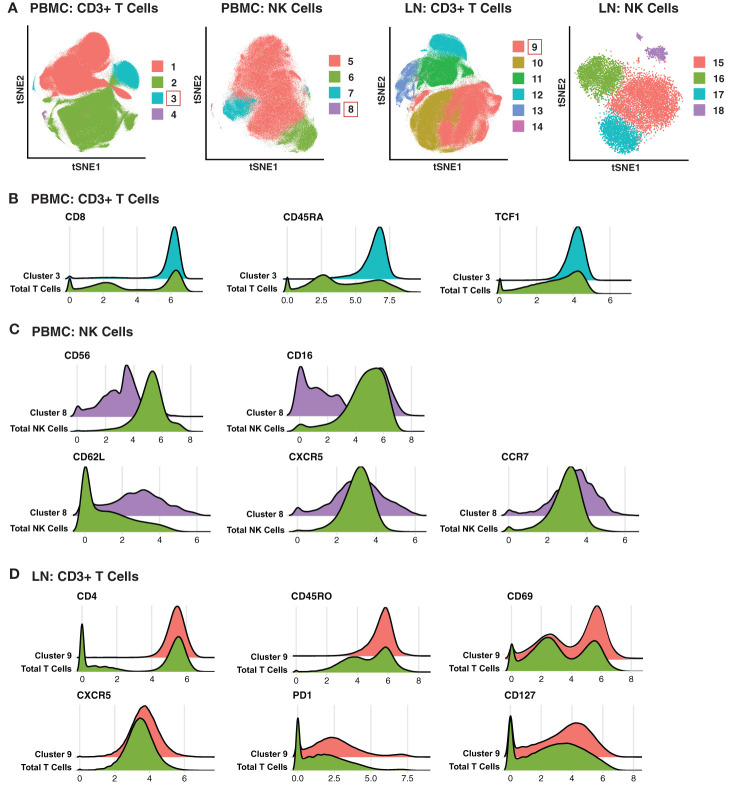
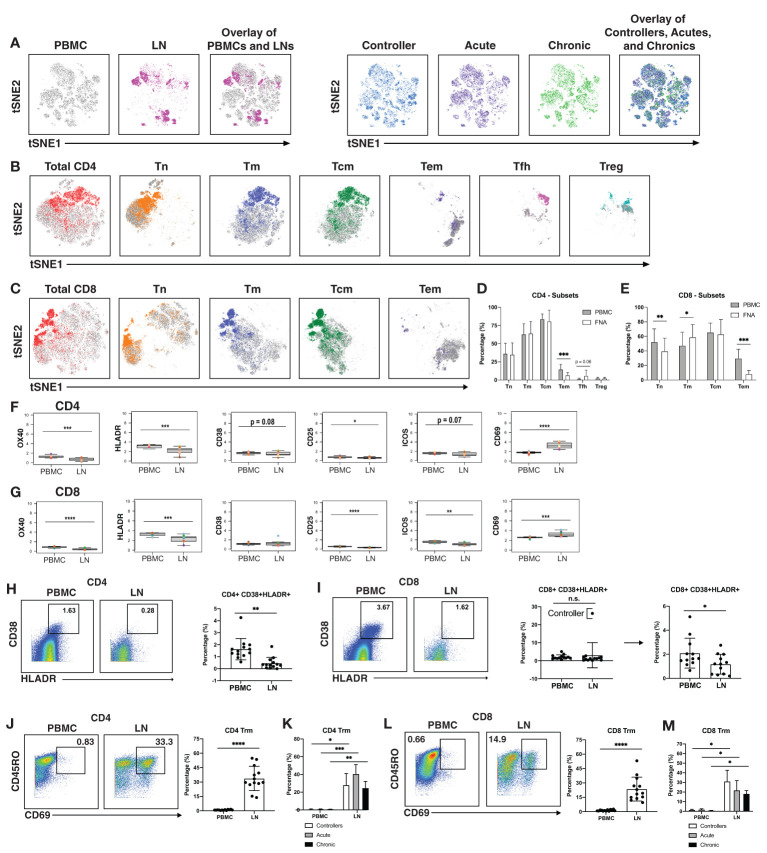
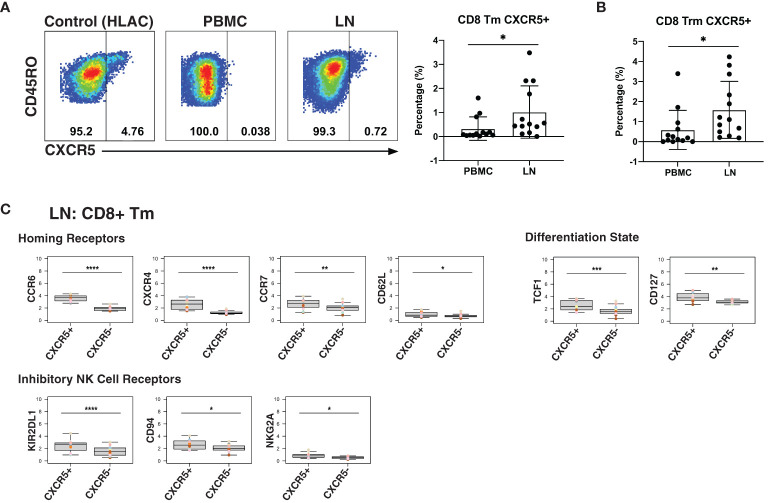
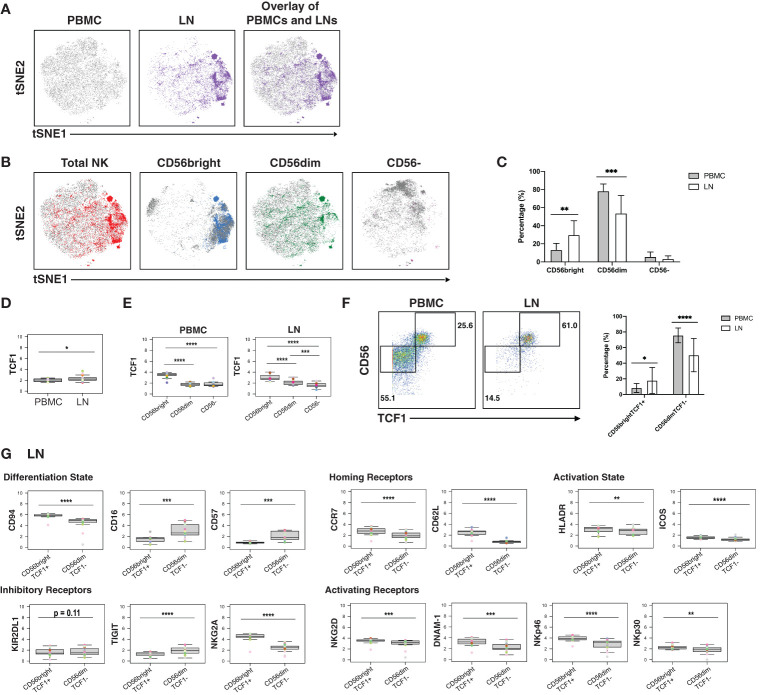
T and natural killer (NK) cells are effector cells with key roles in anti-HIV immunity, including in lymphoid tissues, the major site of HIV persistence. However, little is known about the features of these effector cells from people living with HIV (PLWH), particularly from those who initiated antiretroviral therapy (ART) during acute infection. Our study design was to use 42-parameter CyTOF to conduct deep phenotyping of paired blood- and lymph node (LN)-derived T and NK cells from three groups of HIV+ aviremic individuals: elite controllers (N = 5), and ART-suppressed individuals who had started therapy during chronic (N = 6) vs. acute infection (N = 8), the latter of which is associated with better outcomes. We found that acute-treated individuals are enriched for specific subsets of T and NK cells, including blood-derived CD56-CD16+ NK cells previously associated with HIV control, and LN-derived CD4+ T follicular helper cells with heightened expansion potential. An in-depth comparison of the features of the cells from blood vs. LNs of individuals from our cohort revealed that T cells from blood were more activated than those from LNs. By contrast, LNs were enriched for follicle-homing CXCR5+ CD8+ T cells, which expressed increased levels of inhibitory receptors and markers of survival and proliferation as compared to their CXCR5- counterparts. In addition, a subset of memory-like CD56brightTCF1+ NK cells was enriched in LNs relative to blood. These results together suggest unique T and NK cell features in acute-treated individuals, and highlight the importance of examining effector cells not only in blood but also the lymphoid tissue compartment, where the reservoir mostly persists, and where these cells take on distinct phenotypic features.

Keywords: CXCR5; CyTOF/mass cytometry; HIV; NK cells; T cells; controllers; lymph node.


Conflict of interest statement

The authors declare that the research was conducted in the absence of any commercial or financial relationships that could be construed as a potential conflict of interest.

Figures

Figure 1
Figure 1
Characterization of T and NK cells from PBMCs and LNs of HIV controllers and non-controller HIV+ individuals treated during acute or chronic infection. (A, B) t-distributed stochastic neighbor embedding (tSNE) plots for T and NK cells from PBMCs (A) and LNs (B) of HIV controllers (left), acutely-treated (middle), and chronically-treated (right) HIV+ individuals. The main subsets analyzed are each colored as indicated. Some subsets of T cells were preferentially detected in the controllers (regions circled in black). (C) Blood naïve T cells are more frequent in controllers than HIV+ ART-suppressed individuals. Shown are frequencies of canonical subsets in PBMCs from the indicated groups of HIV+ individuals among CD4+ T cells (live, singlet, CD19-CD14-CD33-CD3+CD8-, left), CD8+ T cells (live, singlet, CD19-CD14-CD33-CD3+CD8+, middle) and NK cells (CD19-CD14-CD33-CD3-CD4-CD7+, right). Subsets of CD4+ and CD8+ T cells were defined as follows: naïve T cells (Tn): CD45RO-CD45RA+; memory T cells (Tm): CD45RO+CD45RA-; central memory T cells (Tcm): CD45RO+CD45RA-CCR7+CD27+; and effector memory T cells (Tem): CD45RO+CD45RA-CCR7-CD27-. In addition, CD4+ T cells were further subsetted into T follicular helper cells (Tfh): CD45RO+CD45RA-CXCR5+PD1+; and regulatory T cells (Treg): CD45RO+CD45RA-CD25+CD127-. Subsets of NK cells were defined based on CD56bright, CD56dim, and CD56- staining. (D) Age distribution of participants in each group. Controllers were not younger than HIV+ ART-suppressed individuals. (E) Frequencies of canonical T and NK cell subsets from LNs are similar between controllers and HIV+ ART-suppressed individuals. Frequencies of the indicated subsets of CD4+ T cells (left), CD8+ T cells (middle), and NK cells (right) in LNs from the indicated groups are shown. *p<0.05, **p<0.01, ***p<0.001 as assessed using the Student’s unpaired t test.
Figure 2
Figure 2
Clusters of T and NK cells associated with acutely treatment of HIV. (A) tSNE visualization of T and NK cell clusters from PBMCs and LNs. Clusters significantly enriched in the acutely-treated group are boxed in red. (B) Cluster 3 of blood T cells was enriched in the acutely-treated group relative to controllers (P < 0.0001) and the chronically-treated group (P < 0.009). Cells in Cluster 3 expressed relatively high levels of CD8, CD45RA, CD27, CCR7, and TCF1. (C) Cluster 8 of blood NK cells was enriched in the acutely-treated group relative to chronically-treated group (P < 0.05). Cells in Cluster 8 expressed low levels of CD56, and approximately half of them were CD16+. Cluster 8 also included cells expressing high levels of lymph node-homing receptors CD62L, CCR7, and CXCR5. (D) Cluster 9 of LN T cells was enriched in the acutely-treated group relative to controllers (P < 0.03) and the chronically-treated group (P < 0.0001). Cluster 9 corresponded to CD4+ T cells expressing high levels of the T resident memory (Trm) marker CD69, the T follicular helper (Tfh) markers PD1 and CXCR5, and the alpha chain of the IL7 receptor CD127. A generalized linear mixed model (GLMM) was used to estimate the association between cluster membership and group (controllers, acutely-treated, or chronically-treated). The log odds ratio was retrieved from the coefficient estimate of each variable. All p-values were adjusted using the FDR, and a threshold of 0.05 was used to determine significance.
Figure 3
Figure 3
T cells from blood of PLWH are more activated than those from lymph nodes. (A) tSNE plots demonstrating profound differences between T cells from blood (grey) and LNs (colored; left), and more subtle differences between patient groups (controllers in blue, acutely-treated in purple, and chronically-treated in green; right). (B) tSNE plots depicting phenotypic differences among subsets of CD4+ T cells from blood (grey) vs. LNs (colored). (C) tSNE plots depicting phenotypic differences among subsets of CD8+ T cells from blood (grey) vs. LNs (colored). CD4+ Tem (D) and CD8+ Tem and CD8+ Tn (E) are more frequent in blood than in LNs. Shown are frequencies of T cell subsets relative to total PBMC (grey bars) or LNs (white bars), displayed as bar graphs. Cell subsets are as described in the legend for Figure 1C. CD4+ (F) and CD8+ (G) T cells from blood express high levels of activation markers, with the exception of activation/tissue residency marker CD69. Shown are the mean signal intensity (MSI) levels of the indicated activation markers assessed in T cells from PBMCs and LNs. Data are displayed as bar graphs with individual donors’ values as colored dots. The remaining antigens are presented in Figures S6, S7. Activated CD38+HLADR+ CD4+ (H) and CD8+ (I) T cells are more frequent in PBMCs than LNs. Gates for activation of T cells dually expressing the two activation markers CD38 and HLADR (left). The bar graphs (right) show the percentages of CD38+HLADR+ T cells in PBMCs and LNs among all donors examined. For CD8+ T cells, one extreme outlier proved to be an HIV controller; data analyzed after removing this outlier are shown on the far right. (J , K) CD4+ and (L , M) CD8+ T resident memory (Trm) cells are enriched in LNs, in all groups. Trm cells were defined as those dually expressing CD45RO and CD69 (left). Their frequencies in PBMCs and LNs are depicted as bar graphs (right). *p<0.05, **p<0.01, ***p<0.001, ****p<0.0001 as determined using the Student’s paired t test and adjusted for multiple testing using the Benjamini-Hochberg for FDR.
Figure 4
Figure 4
LNs from PLWH are enriched for CXCR5+ CD8+ T cells expressing high levels of inhibitory NK cell receptors. (A) CXCR5+ memory T cells are more frequent in LNs than in blood. Gating strategy (left) and frequencies of CXCR5+ cells (right) among memory CD8+ T cells from paired PBMCs and LNs. The gating strategy for CXCR5+ cells was established using human lymphoid aggregate cultures (HLAC) of tonsils, which harbor a distinct population of these cells. (B) CXCR5+ tissue-resident memory T cells (Trm) are more frequent in LNs than in blood. (C) Lymphoid CXCR5+ memory CD8+ T cells express higher levels of tissue homing receptors, markers of long-lived memory cells, and inhibitory NK receptors, relative to their CXCR5- counterparts. Shown are MSIs of the indicated homing receptors, differentiation state markers, inhibitory and activating NK cell receptors. *p<0.05, **p<0.01, ***p<0.001, ****p<0.0001 as assessed using the Student’s paired t test and adjusted for multiple testing using the Benjamini-Hochberg for FDR.
Figure 5
Figure 5
CD56bright NK cells from PLWH display phenotypic features of memory and are enriched in LNs. (A) tSNE plots demonstrating the overall differences between total NK cells from blood (grey) and LN (colored). (B) NK cell subsets, defined by CD56 expression (total, CD56bright, CD56dim, CD56-), are phenotypically distinct in blood (grey) as compared to LNs (colored). (C) NK cells from PBMCs have increased frequencies of CD56dim cells, while NK cells from LNs have increased frequencies of CD56bright cells. Shown are the percentages of the indicated populations among total NK cells. (D) TCF1 expression is higher in NK cells from LNs than from blood. MSI of TCF1 in total NK cells from PBMCs and LNs are shown. Expression levels of other antigens on these two cell populations are presented in Figure S8. (E) TCF1 expression is highest in the CD56bright subset of NK cells. MSI of TCF1 in NK cell subsets from PBMCs and LNs are shown. (F) LNs harbor a larger proportion of CD56brightTCF1+ NK cells than do PBMCs. Representative gates (left) and frequencies (right) of CD56brightTCF1+ and CD56dimTCF1- NK cells in PBMCs and LNs. (G) LN CD56brightTCF1+ NK cells are less differentiated and express increased levels of LN homing receptors, activation markers, and activating NK receptors than LN CD56dimTCF1- NK cells. Shown are MSI levels of the indicated markers assessed in CD56brightTCF1+ and CD56dimTCF1- NK cells from LNs. Plots comparing MSI of the indicated markers between CD56brightTCF1+ and CD56dimTCF1- NK cells from PBMCs are presented in Figure S8. *p<0.05, **p<0.01, ***p<0.001, ****p<0.0001 as assessed using the Student’s paired t test and for MSIs, adjusted for multiple testing using the Benjamini-Hochberg for FDR.

Similar articles

Cited by

References

    1. Bjorkstrom NK, Strunz B, Ljunggren HG. Natural Killer Cells in Antiviral Immunity. Nat Rev Immunol (2021) doi. doi: 10.1038/s41577-021-00558-3 - DOI - PMC - PubMed
    1. Estes JD, Kityo C, Ssali F, Swainson L, Makamdop KN, Del Prete GQ, et al. . Defining Total-Body AIDS-Virus Burden With Implications for Curative Strategies. Nat Med (2017) 23(11):1271–6. doi: 10.1038/nm.4411 - DOI - PMC - PubMed
    1. Brenchley JM, Vinton C, Tabb B, Hao XP, Connick E, Paiardini M, et al. . Differential Infection Patterns of CD4+ T Cells and Lymphoid Tissue Viral Burden Distinguish Progressive and Nonprogressive Lentiviral Infections. Blood (2012) 120(20):4172–81. doi: 10.1182/blood-2012-06-437608 - DOI - PMC - PubMed
    1. Lindqvist M, van Lunzen J, Soghoian DZ, Kuhl BD, Ranasinghe S, Kranias G, et al. . Expansion of HIV-Specific T Follicular Helper Cells in Chronic HIV Infection. J Clin Invest (2012) 122(9):3271–80. doi: 10.1172/JCI64314 - DOI - PMC - PubMed
    1. Perreau M, Savoye AL, De Crignis E, Corpataux JM, Cubas R, Haddad EK, et al. . Follicular Helper T Cells Serve as the Major CD4 T Cell Compartment for HIV-1 Infection, Replication, and Production. J Exp Med (2013) 210(1):143–56. doi: 10.1084/jem.20121932 - DOI - PMC - PubMed

Publication types

Substances