. 2022 Jan 26:13:835454.
doi: 10.3389/fimmu.2022.835454. eCollection 2022.

Accurate MHC Motif Deconvolution of Immunopeptidomics Data Reveals a Significant Contribution of DRB3, 4 and 5 to the Total DR Immunopeptidome

Affiliations

Accurate MHC Motif Deconvolution of Immunopeptidomics Data Reveals a Significant Contribution of DRB3, 4 and 5 to the Total DR Immunopeptidome

Saghar Kaabinejadian et al. Front Immunol. .

Abstract

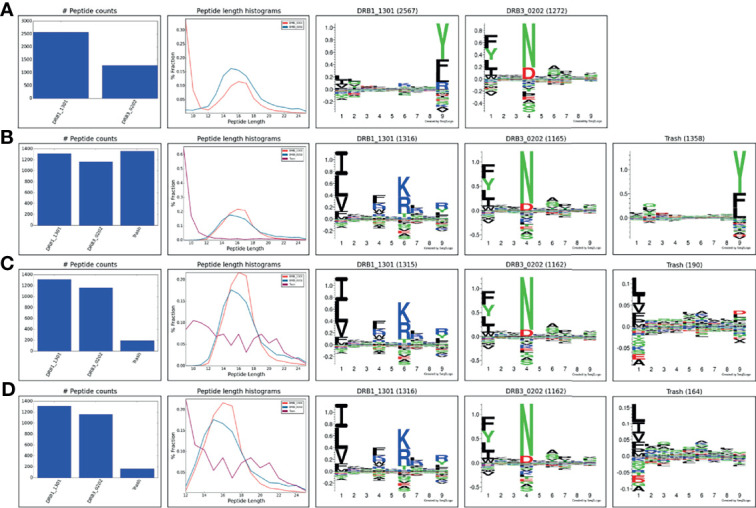
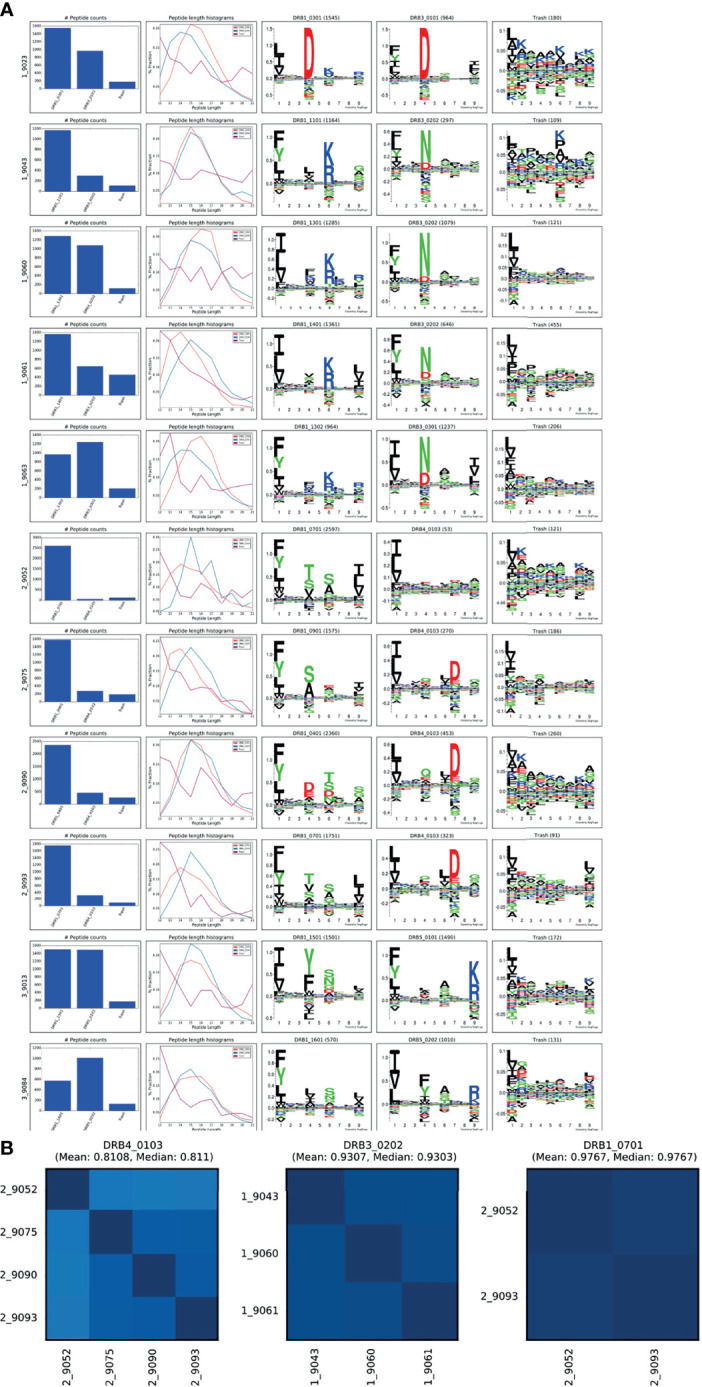
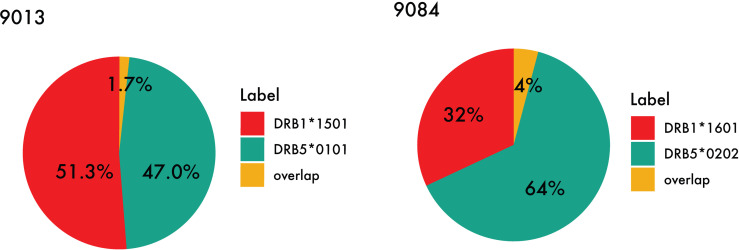
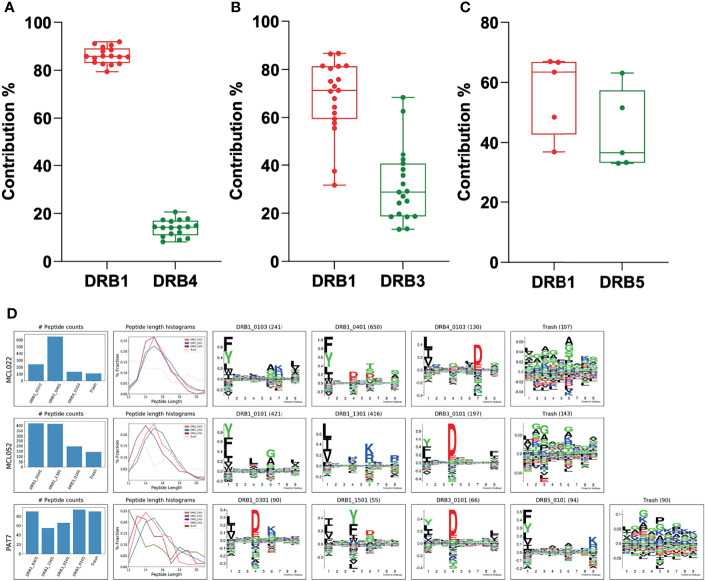
Mass spectrometry (MS) based immunopeptidomics is used in several biomedical applications including neo-epitope discovery in oncology, next-generation vaccine development and protein-drug immunogenicity assessment. Immunopeptidome data are highly complex given the expression of multiple HLA alleles on the cell membrane and presence of co-immunoprecipitated contaminants. The absence of tools that deal with these challenges effectively and guide the analysis and interpretation of this complex type of data is currently a major bottleneck for the large-scale application of this technique. To resolve this, we here present the MHCMotifDecon that benefits from state-of-the-art HLA class-I and class-II predictions to accurately deconvolute immunopeptidome datasets and assign individual ligands to the most likely HLA molecule, allowing to identify and characterize HLA binding motifs while discarding co-purified contaminants. We have benchmarked the tool against other state-of-the-art methods and illustrated its application on experimental datasets for HLA-DR demonstrating a previously underappreciated role for HLA-DRB3/4/5 molecules in defining HLA class II immune repertoires. With its ease of use, MHCMotifDecon can efficiently guide interpretation of immunopeptidome datasets, serving the discovery of novel T cell targets. MHCMotifDecon is available at https://services.healthtech.dtu.dk/service.php?MHCMotifDecon-1.0.

Keywords: DRB3/4/5; MHC motif deconvolution; MHCMotifDecon; immunopeptidome; mass spectrometry.


Conflict of interest statement

SK is an employee at Pure MHC, LLC. The remaining authors declare that the research was conducted in the absence of any commercial or financial relationships that could be construed as a potential conflict of interest.

Figures

Figure 1
Figure 1
Motif deconvolution of the artificial HLA class I dataset. GibbsCluster, MHCMotifDecon, MixMHCp deconvolution of datasets. Motifs for MixMHCp were constructed from the set of deconvoluted 9mer peptides only. The lower panel (SA) shows motifs for each individual HLA-A*02:02, HLA-A*11:02, HLA-B*13:01, HLA-B*49:01, HLA-C*07:02, HLA-C*14:03 dataset as obtained by GibbsCluster using a single cluster.
Figure 2
Figure 2
Clustering confusion matrix and Matthews correlation performance for the three methods (A) GibbsCluster, (B) MixMHCp and (C) MHCMotifDecon. (D) Matthews correlation (MCC) performance estimates of accuracy of the motif deconvolution of the different methods for the artificial MS HLA eluted ligand dataset. MCC values for each method and HLA were estimated from the confusion matrices and cluster-HLA annotations shown in Figure 1.
Figure 3
Figure 3
Motif deconvolution of the artificial dataset combining MS eluted ligand data from 4 cell lines each one expressing one individual HLA-DR allele. The three methods MHCMotifDecon, GibbsCluster (8), and Modec (10) were run as described in Materials and Methods. Eluted motif corresponds to GibbsCluster deconvolution of each of the single allele datasets using a single cluster (k=1).
Figure 4
Figure 4
Clustering confusion matrix and Matthews correlation performance for the three methods (A) GibbsCluster, (B) MoDec and (C) MHCMotifDecon. (D) Matthews correlation (MCC) performance estimates of accuracy of the motif deconvolution of the different methods for the artificial MS HLA eluted ligand dataset. MCC values for each method and HLA were estimated from the confusion matrices and cluster-HLA annotations shown in Figure 3.
Figure 5
Figure 5
HLA-DR motif deconvolution for the IHW09060 dataset using different strategies to deal with co-immunoprecipitated MS contaminants. (A) Peptide length 9-25, excluding the use of the trash bin option (achieved by setting the trash bin threshold to 101%), (B) Peptide length 9-25, trash bin 20%, (C) Peptide length 9-25, exclude class I binders, trash bin 20%, (D) Peptide length 12-25, trash bin 20%.
Figure 6
Figure 6
MHCMotifDecon analysis for the MS peptidomics data obtained from the 11 cell lines. Peptide datasets were filtered for HLA class I binders as described in the text and submitted to MHCMotifDecon for motif deconvolution using default class II options. (A) Peptide counts, length distribution per alleles or trash cluster, and logos from HLA-DR alleles after deconvolution by the method. Each row corresponds to one dataset (cell line). The label N_ in front of each cell line (i.e., 1_9023) corresponds to the different haplotype groups (see Supplementary Table 1). The first column shows the number of peptides assigned to each HLA molecule and the Trash bin (containing peptides with a predicted rank > 20%). The second column gives the peptide length distribution for each HLA, and Trash bin, and the remaining columns the binding motifs for each HLA molecule and Trash bin. Motifs are constructed from the predicted binding cores using Seq2Logo (23) with default settings. (B) Consistency matrices generated by the method for the three DR molecules shared between 2 or more cell lines using the method described in (15) defining the similarity between two HLA binding motifs in terms of the Pearson’s correlation coefficient (PCC) between the two vectors of 9*20 elements (9 positions and 20 amino acid propensity scores at each position). Note. that the consistency plot for DRB4*01:03 includes the null allele DRB4*01:03N expressed in the 9052 cell line. Removing this allele from the plot results in increasing the Mean PCC value to 0.88.
Figure 7
Figure 7
Peptide overlap within the DR51 haplotype group. HLA-DR binding for MS ligands identified within the two DR51 cell lines (Left) 9013 (HLA-DRB1*15:01 and HLA-DRB5*01:01) and (Right) 9084 (HLA-DRB1*16:01 and HLA-DRB5*02:02) was predicted with NetMHCIIpan-4.1 using a threshold of 1% rank, and the relative contribution from each primary and secondary HLA-DR molecule as well as their overlap were calculated.
Figure 8
Figure 8
Contribution of the DRB3, 4 and 5 alleles vs. DRB1 in biological samples. (A) Contribution of DRB4 vs. DRB1 was calculated using biological samples from ten patients with mantle cell lymphoma (MCL), one patient with chronic lymphocytic leukemia (CLL), three patients with rheumatoid arthritis (RA) and two patients with Lyme disease (LA). (B) Contribution of DRB3 vs. DRB1 was calculated using samples from nine patients with mantle cell lymphoma (MCL), two patients with chronic lymphocytic leukemia (CLL), one patient with rheumatoid arthritis (RA), four patients with Lyme disease (LA) and one patient with Sarcoidosis. (C) Contribution of DRB5 vs. DRB1 was calculated using samples from two patients with rheumatoid arthritis (RA), two patients with Lyme disease (LA) and one patient with Sarcoidosis. In all cases, the DRB3, 4 or 5 with the highest LD was assigned to the DRB1 before deconvolution of the DR peptidome by the MHCMotifDecon. (D) Peptide counts, length distribution per alleles or trash cluster, and logos from deconvolution of HLA-DR peptidome of the patients after assigning DRB3, 4 and 5 to the associated DRB1 alleles. Each row represents one patient.

References

    1. Barra C, Ackaert C, Reynisson B, Schockaert J, Jessen LE, Watson M, et al. Immunopeptidomic Data Integration to Artificial Neural Networks Enhances Protein-Drug Immunogenicity Prediction. Front Immunol (2020) 11:1304. doi: 10.3389/fimmu.2020.01304 - DOI - PMC - PubMed
    1. Bettencourt P, Müller J, Nicastri A, Cantillon D, Madhavan M, Charles PD, et al. Identification of Antigens Presented by MHC for Vaccines Against Tuberculosis. NPJ Vaccines (2020) 5(1):2. doi: 10.1038/s41541-019-0148-y - DOI - PMC - PubMed
    1. Mayer RL, Impens F. Immunopeptidomics for Next-Generation Bacterial Vaccine Development. Trends Microbiol (2021) 29(11):1034–45. doi: 10.1016/j.tim.2021.04.010 - DOI - PubMed
    1. Nelde A, Rammensee HG, Walz JS. The Peptide Vaccine of the Future. Mol Cell Proteomics (2021) 20:100022. doi: 10.1074/mcp.R120.002309 - DOI - PMC - PubMed
    1. Abelin JG, Keskin DB, Sarkizova S, Hartigan CR, Zhang W, Sidney J, et al. Mass Spectrometry Profiling of HLA-Associated Peptidomes in Mono-Allelic Cells Enables More Accurate Epitope Prediction. Immunity (2017) 46(2):315–26. doi: 10.1016/j.immuni.2017.02.007 - DOI - PMC - PubMed

Publication types