. 2022 Jan 28:13:816078.
doi: 10.3389/fgene.2022.816078. eCollection 2022.

Phenotypic Spectrum and Molecular Basis in a Chinese Cohort of Osteogenesis Imperfecta With Mutations in Type I Collagen

Affiliations

Phenotypic Spectrum and Molecular Basis in a Chinese Cohort of Osteogenesis Imperfecta With Mutations in Type I Collagen

Peikai Chen et al. Front Genet. .

Abstract

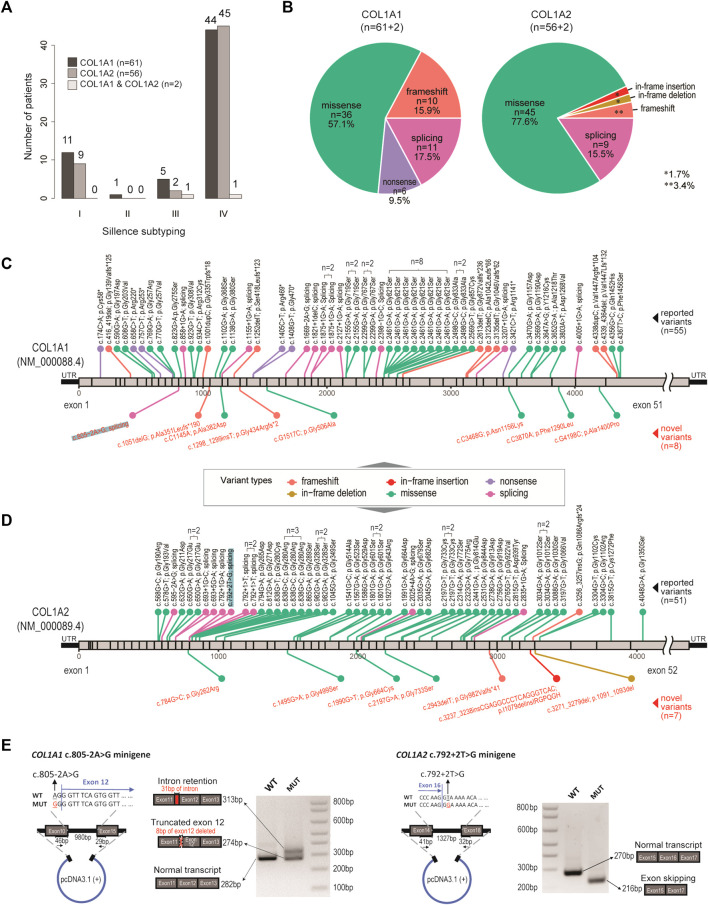
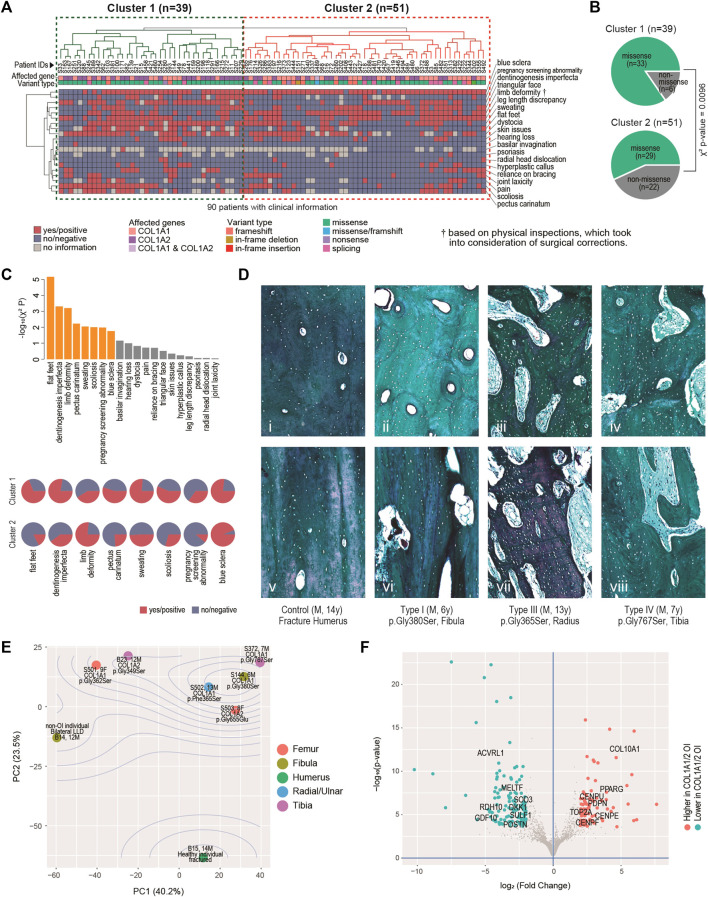
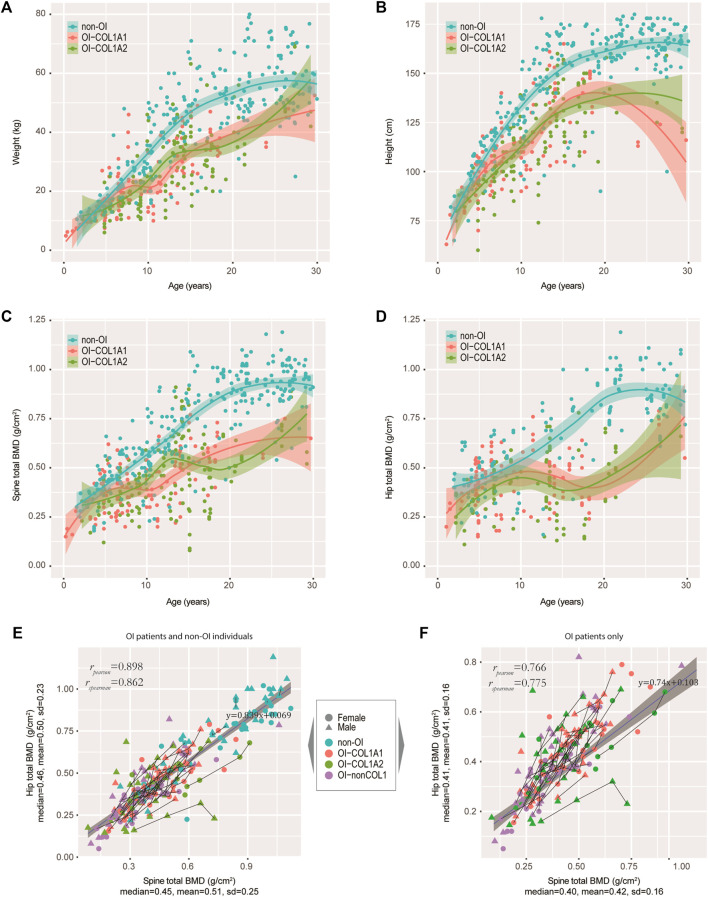
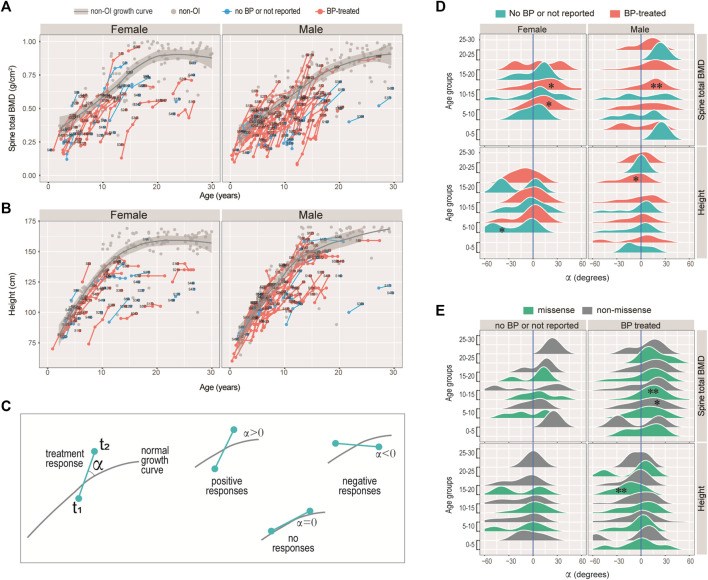
Osteogenesis imperfecta (OI) is a rare inherited connective tissue dysplasia characterized with skeletal fragility, recurrent fractures and bone deformity, predominantly caused by mutations in the genes COL1A1 or COL1A2 that encode the chains of type I collagen. In the present study, clinical manifestations and genetic variants were analysed from 187 Chinese OI patients, majority of whom are of southern Chinese origin. By targeted sequencing, 63 and 58 OI patients were found carrying mutations in COL1A1 and COL1A2 respectively, including 8 novel COL1A1 and 7 novel COL1A2 variants. We validated a novel splicing mutation in COL1A1. A diverse mutational and phenotypic spectrum was observed, coupling with the heterogeneity observed in the transcriptomic data derived from osteoblasts of six patients from our cohort. Missense mutations were significantly associated (χ2 p = 0.0096) with a cluster of patients with more severe clinical phenotypes. Additionally, the severity of OI was more correlated with the quality of bones, rather than the bone mineral density. Bone density is most responsive to bisphosphonate treatment during the juvenile stage (10-15 years old). In contrast, height is not responsive to bisphosphonate treatment. Our findings expand the mutational spectrum of type I collagen genes and the genotype-phenotype correlation in Chinese OI patients. The observation of effective bisphosphonate treatment in an age-specific manner may help to improve OI patient management.

Keywords: COL1A1; COL1A2; bisphosphonate; bone mineral density; osteogenesis imperfecta; targeted amplicon sequencing.


Conflict of interest statement

The authors declare that the research was conducted in the absence of any commercial or financial relationships that could be construed as a potential conflict of interest.

Figures

FIGURE 1
FIGURE 1
Genetic spectrum in our OI cohort. (A) Bar charts showing the distribution of OI cases, with respect to genotypes and clinical subtyping (Sillence scales). (B) Pie charts showing the distribution of variant types, with respect to genotypes. (C) Diagram showing location and mutation information of the pathogenic variants identified in COL1A1. n number indicates number of recurrences in the cohort. Black texts indicate reported variants. Red texts indicate novel variants. (D) Diagram showing location and mutation information of the pathogenic variants identified in COL1A2. n number indicates number of recurrences in the cohort. Black texts indicate reported variants. Red texts indicate novel variants. (E) Validation of a novel splicing variant (COL1A1, c.805–2A > G) and a positive control (COL1A2, c.792+2T > G), which were also highlighted in (C) and (D).
FIGURE 2
FIGURE 2
Clinical, histological and molecular phenotypes. (A) Heatmap showing clinical characteristics for 90 patients affected by COL1A1 or COL1A2, and with available information. Euclidean distance and complete linkage were used in constructing the dendrograms. (B) Enriched types of variants in the identified clusters. (C) Top: bar charts showing the clinical traits most correlated with the two clusters. Bars in orange have p < 0.05. Bottom: arrays of pie charts showing the percentages of positive traits in each of the two clusters, for the 8 clinical traits that have p < 0.05. (D) Analyses of bone histology. Goldner trichrome staining of skeletal samples from control individual (n = 1) (i, v), proband with type I OI (n = 2) (ii, vi), proband with type III OI (n = 2) (iii, vii) and proband with type IV OI (n = 3) (iv, viii) harbouring different mutations in COL1A1. Haversian structure was shown by transaxial sections (i-iv). Collagen matrix alignment was shown by sagittal sections (v-viii). (E) Diagram of Principal component (PC) analyses showing the sample-sample relationships in a set of eight bulk transcriptome data derived from osteoblasts of six OI and two non-OI patients. Percentages on axes indicate fraction of variance explained. (F) Volcano plot showing the differentially expressed genes between the six OI samples with mutations on COL1A1/2 and the two controls.
FIGURE 3
FIGURE 3
Tracking the weight, height and BMD in our OI cohort. (A−D) Growth curves of weight (A), height (B), spine BMD (C), and hip BMD (D) were tracked. Non-OIs were randomly retrieved from our hospital information system with gender and aged matched (per age group), and served as controls for comparison. Each dot represents one measurement for one individual. (E) Scatter plot showing the correlation between spine and hip BMDs in our OI and non-OI cohorts combined. (F) Scatter plot showing the correlation between spine and hip BMDs in our OI cohort only. Line segments indicated measurements of the same individuals.
FIGURE 4
FIGURE 4
Responses of bisphosphonate (BP) treatment. (A–B) Growth curves for spinal BMD (A), and height (B) for the female and male patients with COL1A1/2 variants in our cohort. Line segments indicated measurements of the same individuals. Text labels were anonymized patient IDs. (C) Diagram illustrating the strategy measuring BP responses. The angle α was measured between the slope of the consecutive measurements and the tangential slope in the controls. A positive angle indicates stronger growth rate as compared with the controls, and a negative one indicates otherwise. (D–E) Ridge plots showing the BP responses of spinal BMD and height with respect to sex, BP-history and age-groups (D), or to variant type, BP-history and age-groups (E). *: Wilcoxon test p < 0.05; **: p < 0.01; unmarked box: no significant difference.

References

    1. Akune T., Ohba S., Kamekura S., Yamaguchi M., Chung U.-i., Kubota N., et al. (2004). PPAR γ Insufficiency Enhances Osteogenesis through Osteoblast Formation from Bone Marrow Progenitors. J. Clin. Invest. 113, 846–855. 10.1172/jci200419900 - DOI - PMC - PubMed
    1. Anders S., Pyl P. T., Huber W. (2015). HTSeq--a Python Framework to Work with High-Throughput Sequencing Data. Bioinformatics 31, 166–169. 10.1093/bioinformatics/btu638 - DOI - PMC - PubMed
    1. Astrom E., Soderhall S. (2002). Beneficial Effect of Long Term Intravenous Bisphosphonate Treatment of Osteogenesis Imperfecta. Arch. Dis. Child. 86, 356–364. 10.1136/adc.86.5.356 - DOI - PMC - PubMed
    1. Bachrach L. K., Ward L. M. (2009). Clinical Review: Bisphosphonate Use in Childhood Osteoporosis. J. Clin. Endocrinol. Metab. 94, 400–409. 10.1210/jc.2008-1531 - DOI - PubMed
    1. Bardai G., Moffatt P., Glorieux F. H., Rauch F. (2016). DNA Sequence Analysis in 598 Individuals with a Clinical Diagnosis of Osteogenesis Imperfecta: Diagnostic Yield and Mutation Spectrum. Osteoporos. Int. 27, 3607–3613. 10.1007/s00198-016-3709-1 - DOI - PubMed