. 2022 Jan 1;12(3):1204-1219.
doi: 10.7150/thno.64347. eCollection 2022.

Overcoming resistance to EGFR monotherapy in HNSCC by identification and inhibition of individualized cancer processes

Affiliations

Overcoming resistance to EGFR monotherapy in HNSCC by identification and inhibition of individualized cancer processes

Maria R Jubran et al. Theranostics. .

Abstract

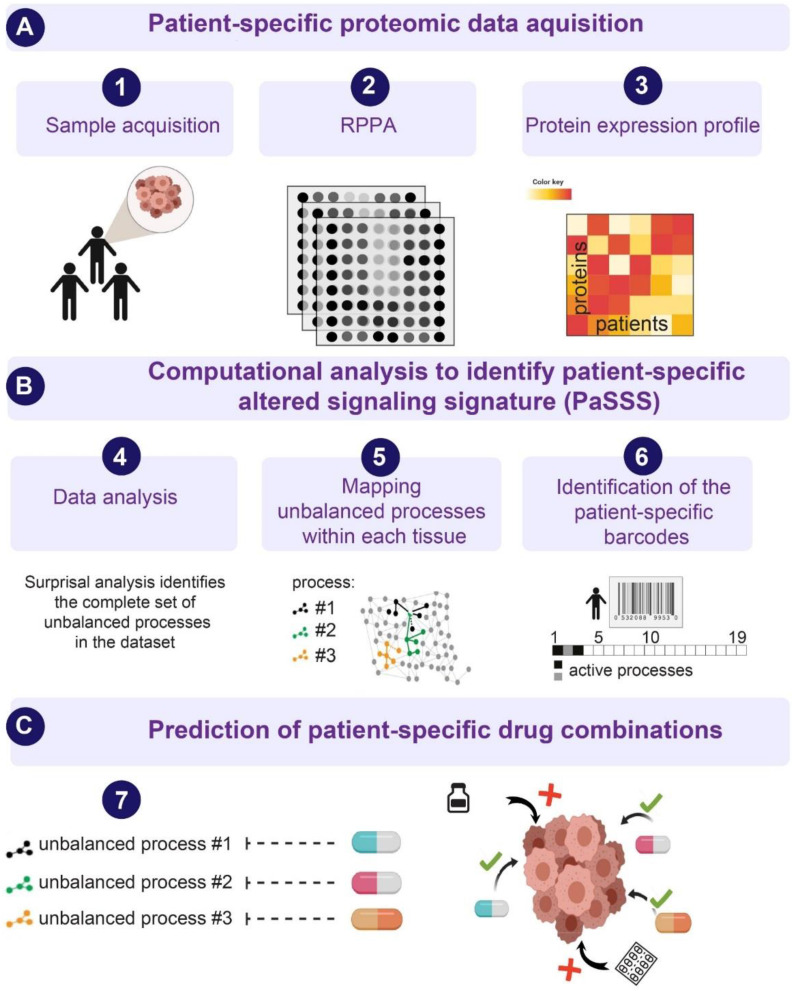
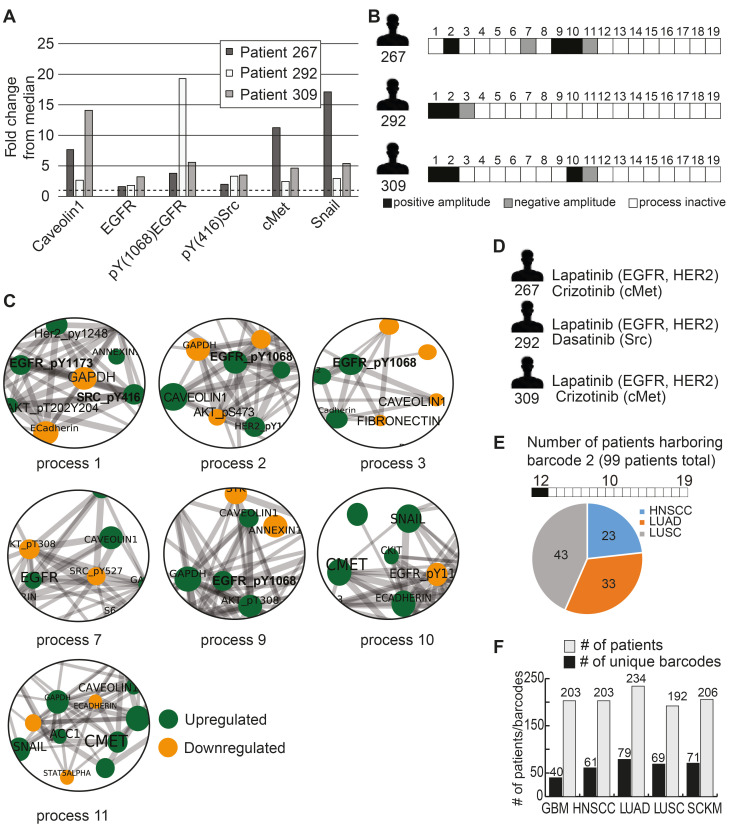
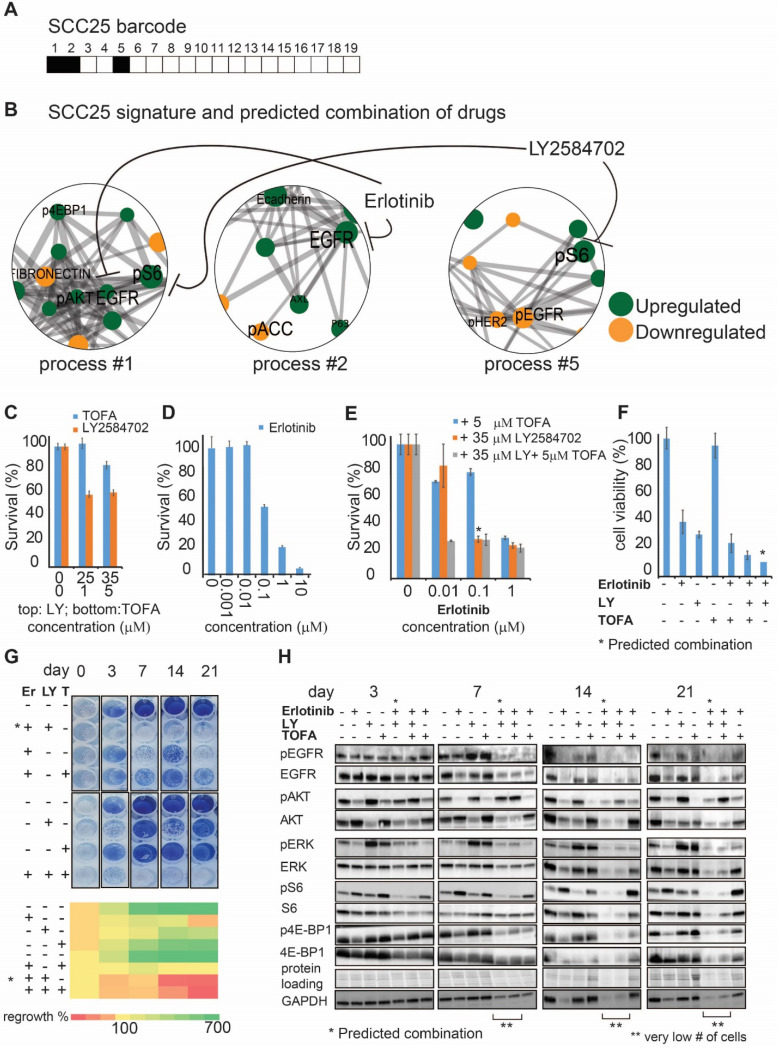
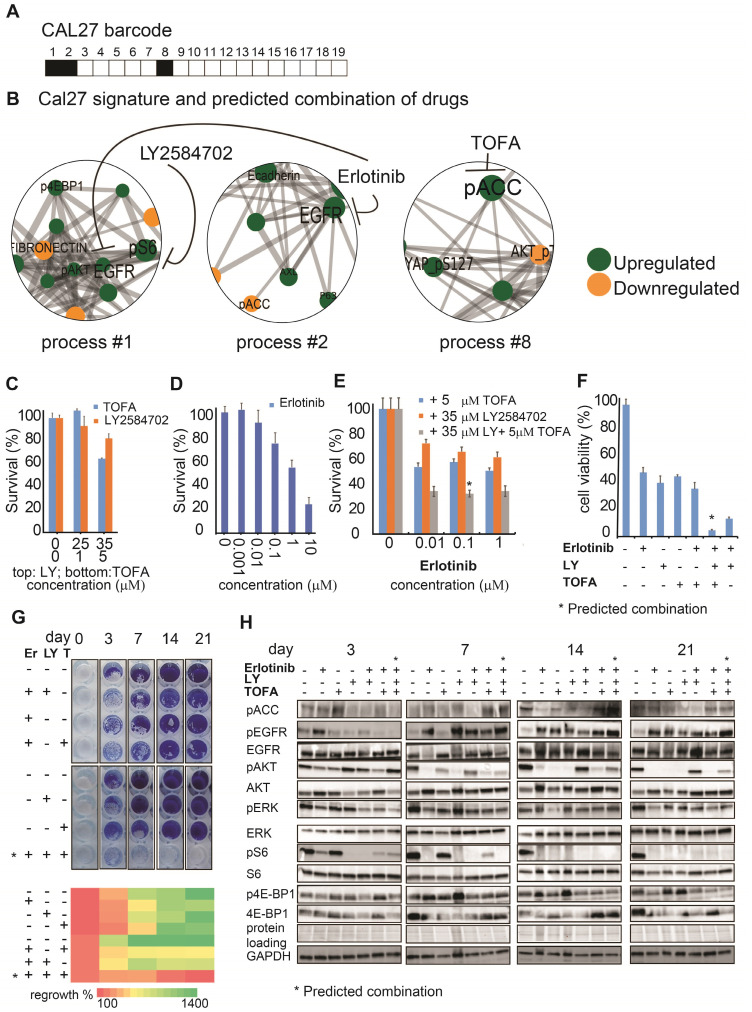
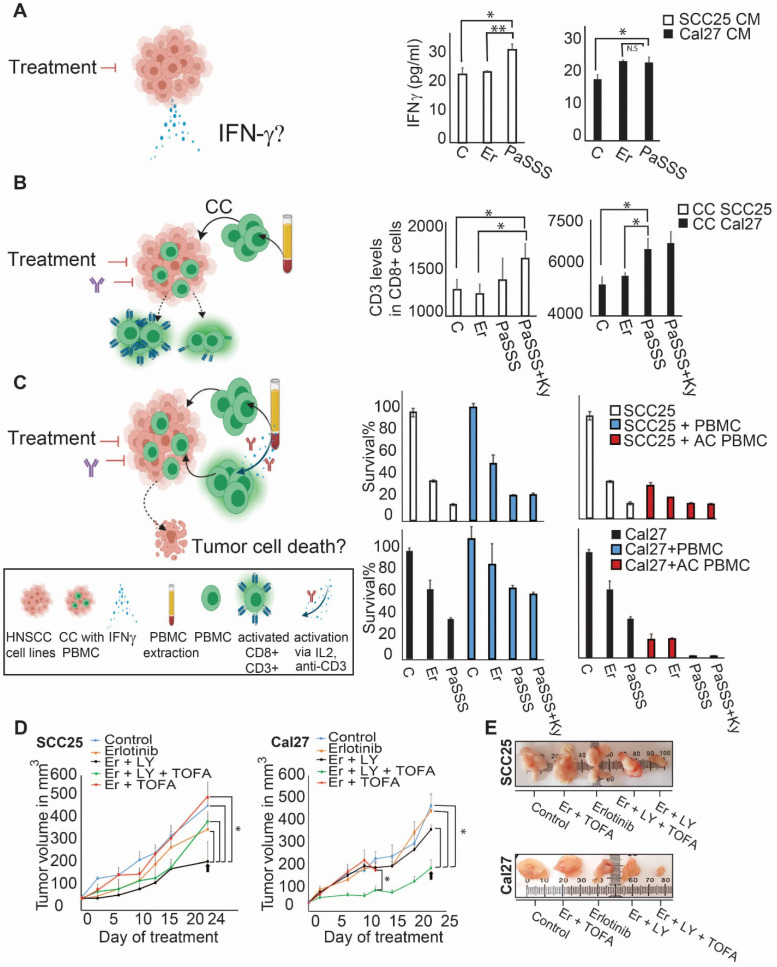
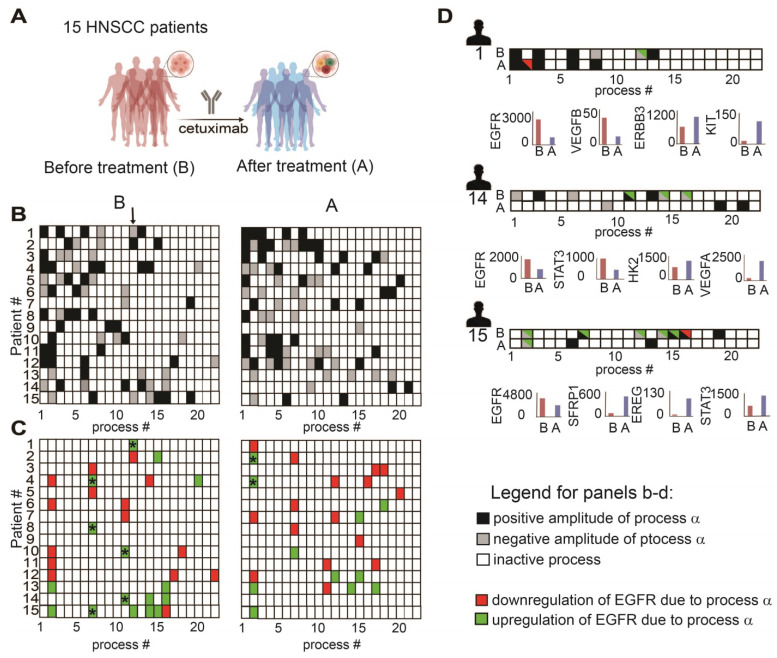
Therapeutic strategies for advanced head and neck squamous carcinoma (HNSCC) consist of multimodal treatment, including Epidermal Growth Factor Receptor (EGFR) inhibition, immune-checkpoint inhibition, and radio (chemo) therapy. Although over 90% of HNSCC tumors overexpress EGFR, attempts to replace cytotoxic treatments with anti-EGFR agents have failed due to alternative signaling pathways and inter-tumor heterogeneity. Methods: Using protein expression data obtained from hundreds of HNSCC tissues and cell lines we compute individualized signaling signatures using an information-theoretic approach. The approach maps each HNSCC malignancy according to the protein-protein network reorganization in every tumor. We show that each patient-specific signaling signature (PaSSS) includes several distinct altered signaling subnetworks. Based on the resolved PaSSSs we design personalized drug combinations. Results: We show that simultaneous targeting of central hub proteins from each altered subnetwork is essential to selectively enhance the response of HNSCC tumors to anti-EGFR therapy and inhibit tumor growth. Furthermore, we demonstrate that the PaSSS-based drug combinations lead to induced expression of T cell markers and IFN-γ secretion, pointing to higher efficiency of the immune response. Conclusion: The PaSSS-based approach advances our understanding of how individualized therapies should be tailored to HNSCC tumors.

Keywords: head and neck squamous cell carcinoma; information-theoretic approach; patient-specific signaling signatures; precision medicine; targeted therapy.


Conflict of interest statement

Competing Interests: The authors have declared that no competing interest exists.

Figures

Figure 1
Figure 1
An overview of the thermodynamic-based approach for calculation of patient-specific signaling signatures. (A) Each cancer tissue is profiled for functional oncogenic proteins using, for example, Reverse Phase Protein Array (RPPA) approach. (B) Protein expression levels from each tissue are used as an input for surprisal analysis (SA). SA identifies active unbalanced processes in the population of cancer patients, which are utilized further to compute an altered, patient-specific signaling signature (PaSSS) in every sample, encompassing the individualized set of unbalanced molecular processes (i.e. groups of proteins that undergo deviations from their balanced expression levels in a correlated, function-related manner; see main text and Methods). (C) Based on the information obtained from each PaSSS, the response of the patient-specific protein networks to various conditions, including drug treatments, can be predicted. Consequently, combination therapies that should elicit an effective response in every tumor can be rationally designed. We hypothesize that at least one central hub protein from every unbalanced process should be targeted in order to efficiently collapse the entire imbalance in the specific tumor. This figure was created using BioRender.com.
Figure 2
Figure 2
Different patients with similar biomarker expression levels may harbor biologically distinct tumors. (A) Three HNSCC patients were selected to demonstrate this point: patient 267, patient 292 and patient 309. The expression levels of 6 HNSCC-related protein biomarkers were examined, showing that in all three patients these biomarkers were upregulated relative to their median values. The dashed line in the graph marks the x = 1 level. (B) However, PaSSS analysis revealed that these patients have different barcodes as they harbor different sets of unbalanced processes. (C) Zoom in images of the unbalanced processes 1,2,3,7,9,10 and 11, which characterize patients 267, 292 and 309, and the participation of the 6 HNSCC-related biomarkers in those processes, are presented. To determine the direction of change in every protein (i.e. upregulation or downregulation due to the process) the amplitudes of the processes in these patients were considered. Note that in other patients the directions of change may be opposite. See Methods for more details. The complete set of unbalanced processes is presented in Figure S2. (D) Drug combination prediction for patients 267, 292 and 309 based on their unbalanced processes. (E) 99 patients out of 1038 were found to harbor barcode 2, in which processes 1 and 2 are active. These 99 patients encompass 23 HNSCC patients, 33 LUAD patients, and 43 LUSC patients. (F) The graph represents the uniquely characterized tumors along with the total number of patients in each cancer type; e.g. 61 barcodes, representing different altered signaling signatures, were identified in 203 HNSCC patients.
Figure 3
Figure 3
The SA-based calculation of PaSSS allowed designing the efficient drug combinations for SCC25. (A, B) Barcode, depicting the unbalanced processes and its emerging altered signaling signature in SCC25 cells, according to PaSSS analysis. Zoom-in images of the unbalanced processes active in SCC25 cells are shown (Figure S4 shows all participating proteins in each process). Correspondingly, the upregulation or downregulation of every protein is indicated in green or yellow, respectively. The complete number of unbalanced processes found in the cell line dataset is presented in Figure S4. The predicted drug combination and the processes each drug targets are shown (B). (C, D, E) Survival of SCC25 in response to different treatments and dosages. The combination of drugs predicted to target the unbalanced signaling signature (marked with an asterisk), as well as combinations that were predicted to partially target the unbalanced signaling flux of SCC25, were tested. (F) MTT assay confirms further the efficiency of the predicted drug combination (erlotinib and LY2584702). The predicted drug combination for SCC25 depletes the signaling flux and prevents cell regrowth. (G, upper panel) Cells were treated every three days and regrowth was measured up to 21 days with either monotherapy (erlotinib 0.1μM (Er), LY2584702 (LY) 35μM, TOFA (T) 5μM), the predicted drug combination (marked with an asterisk) or with the combinations that were predicted to partially target the unbalanced signaling flux of SCC25. Representative methylene blue-stained cell cultures are shown. (G, lower panel) Regrowth was quantified and presented as a heatmap. Day 0 represents the amount of cells seeded at the same day and was defined as 100%. Fold change relative to the amount of cells at day 0 is presented. Green color indicates higher regrowth levels (> 100%) and red shows decrease or depletion of the cells (< 100%). (H) Western blot analysis of the treated cells at different time points. The predicted drug combination is marked with an asterisk (*).
Figure 4
Figure 4
The SA-based calculation of PaSSS allowed designing the efficient drug combinations for Cal27. (A, B) Barcode, depicting the unbalanced processes and its emerging altered signaling signature in Cal27 cells, according to PaSSS analysis. Zoom-in images of the unbalanced processes active in Cal27 cells are shown (Figure S4 shows all participating proteins in each process). Correspondingly, the upregulation or downregulation of every protein is indicated in green or yellow, respectively. The predicted drug combination and the processes each drug targets are shown (B). (C, D, E) Survival of Cal27 in response to different treatments and dosages. The combination of drugs predicted to target the unbalanced signaling signature (marked with an asterisk), as well as combinations that were predicted to partially target the unbalanced signaling flux of Cal27, were tested. (F) MTT assay confirms further the efficiency of the predicted drug combination (erlotinib, LY2584702 and TOFA). The predicted drug combination for Cal27 depletes the signaling flux and prevents cell regrowth. (G, upper panel) Cells were treated every three days and regrowth was measured up to 21 days with either monotherapy (erlotinib 0.1μM (Er), LY2584702 (LY) 35μM, TOFA (T) 5μM), with the predicted drug combination (marked with an asterisk) or with the combinations that were predicted to partially target the unbalanced signaling flux of Cal27. Representative methylene blue-stained cell cultures are shown. (G, lower panel) Regrowth was quantified and presented as a heatmap. Day 0 represents the amount of cells seeded at the same day and was defined as 100%. Fold change relative to the amount of cells at day 0 is presented. Green color indicates higher regrowth levels (> 100%) and red shows decrease or depletion of the cells (< 100%). (H) Western blot analysis of the treated cells at different time points. The predicted drug combination is marked with an asterisk (*).
Figure 5
Figure 5
The PaSSS-based drug combinations induced an immune response of PBMC in SCC25 and Cal27 models in vitro and reduced tumor growth in vivo. (A) To examine IFN-γ secretion (as illustrated in the scheme on the left) SCC25 cells (middle panel) and Cal27 cells (right panel) were treated with either anti-EGFR monotherapy (Er) or the PaSSS-based combination. C stands for control. After 48h and 96h respectively the supernatants were collected for IFN-γ levels quantification (*P < 0.05, **P < 0.001). (B) SCC25 (middle panel) and Cal27 cells (right panel) were co-cultured (CC) with PBMCs (as illustrated in the scheme on the left) and treated for 48h and 96h respectively with either anti -EGFR monotherapy or the predicted combination (with or without the addition of 10μg/ml Keytruda, Ky). PBMCs were then collected and CD3 levels in CD8 positive cells were measured (*P < 0.02 for SCC25,*P < 0.007 for Cal27). (C) SCC25 (C, upper right panel) and Cal27 (C, lower right panel) were CC with non-activated /activated PBMCs (AC PBMC) and then the cells were treated with either anti-EGFR monotherapy or the predicted combination with or without the addition of 10 μg/ml Keytruda for 96h. Cell survival was measured via methylene blue. (D) SCC25 (D, left panel) or Cal27 (D, right panel) were injected subcutaneously into mice, and once tumors reached 50 mm3, treatments were initiated. In both cases, the PaSSS-based drug combinations (see black arrows) inhibited tumor growth and demonstrated an effect superior to monotherapy of erlotinib or to the drug combinations predicted to partially target the PaSSS (*P < 0.03 for SCC25) (*P < 0.03 for Cal27) (see Figures 3,4 for details regarding the altered signaling signatures and the PaSSS-based drug combination predictions). (E) Representative, treated and untreated SCC25 and Cal27 tumors, harvested after 25 days and 14 days respectively, are shown. Panels (A-C) were created using BioRender.com.
Figure 6
Figure 6
Anti-EGFR monotherapy fails to reduce the unbalanced flux in HNSCC human samples. (A) Changes in gene expression levels were acquired from 15 HNSCC patients before and after treatment with cetuximab for 2 weeks as shown in the illustration. (B) Patient-specific barcodes were generated for each patient before (left panel) and after the treatment (right panel). Negative/positive amplitude denotes how the patients are correlated with respect to a particular process. For example, patient 1 harbors process 12- (labeled with a black arrow), whereas patient 2 harbors process 12+. Therefore, transcripts that participate in process 12 (Table S9) deviate from the steady state in opposite directions in these patients. (C) Only processes in which EGFR participates are shown for each patient. EGFR upregulation or downregulation due to the process were defined as explained in the Figure legend of Figure S2 and labeled with green (upregulation due to a process) or red (downregulation due to a process) colors. In certain tumors, in which a clear reduction in the levels of EGFR and EGFR-related transcripts was detected, other onco-transcripts were upregulated. (D) Patient-specific barcodes are shown for patients #1,14,15. EGFR participation in active processes is labeled with green and red colors as indicated. Examples for a change in the experimental gene expression levels in response to EGFR inhibition are shown for selected genes and for each patient in lower panels. (B -barcodes before the treatment; A - after the treatment). Panel (A) was created using BioRender.com.

References

    1. Bossi P, Resteghini C, Paielli N, Licitra L, Pilotti S, Perrone F. Prognostic and predictive value of EGFR in head and neck squamous cell carcinoma. Oncotarget. 2016;7:74362–79. - PMC - PubMed
    1. Specenier P, Vermorken JB. Biologic therapy in head and neck cancer: a road with hurdles. ISRN Oncol. 2012;2012:163752. - PMC - PubMed
    1. Kareemaghay S, Tavassoli M. Clinical immunotherapeutic approaches for the treatment of head and neck cancer. Int J Oral Maxillofac Surg. 2019;48:419–36. - PubMed
    1. Ribeiro FAP, Noguti J, Oshima CTF, Ribeiro DA. Effective targeting of the epidermal growth factor receptor (EGFR) for treating oral cancer: a promising approach. Anticancer Res. 2014;34:1547–52. - PubMed
    1. Zolkind P, Uppaluri R. Checkpoint immunotherapy in head and neck cancers. Cancer Metastasis Rev. 2017;36:475–89. - PMC - PubMed

Publication types

MeSH terms