. 2022 Feb 9;11(2):e1374.
doi: 10.1002/cti2.1374. eCollection 2022.

Inflammatory marker trajectories associated with frailty and ageing in a 20-year longitudinal study

Affiliations

Inflammatory marker trajectories associated with frailty and ageing in a 20-year longitudinal study

Leonard Daniël Samson et al. Clin Transl Immunology. .

Abstract

Objective: The aim of this exploratory study was to investigate the development of low-grade inflammation during ageing and its relationship with frailty.

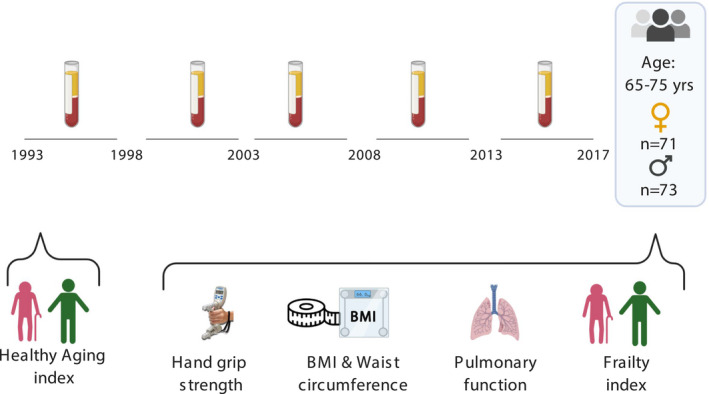
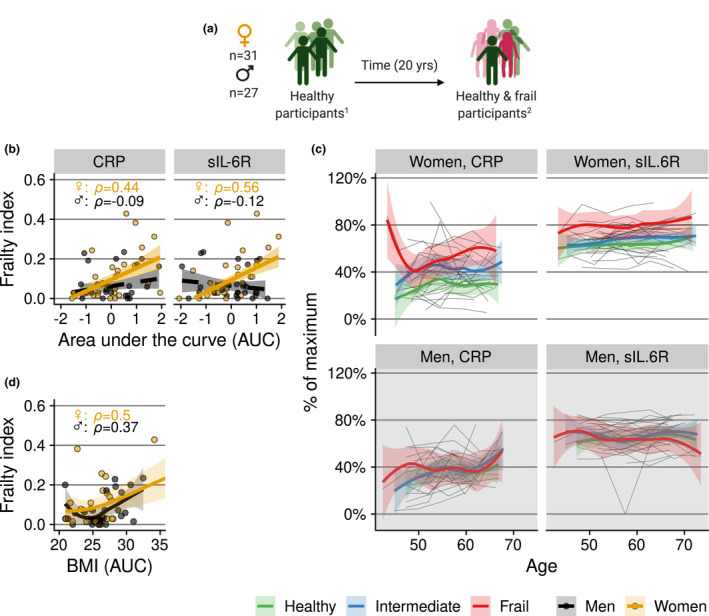
Methods: The trajectories of 18 inflammatory markers measured in blood samples, collected at 5-year intervals over a period of 20 years from 144 individuals aged 65-75 years at the study endpoint, were related to the degree of frailty later in life.

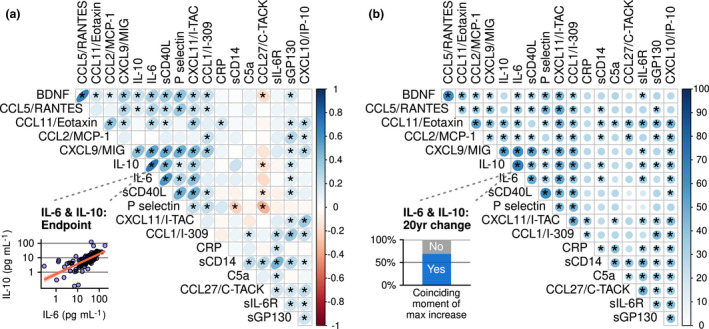
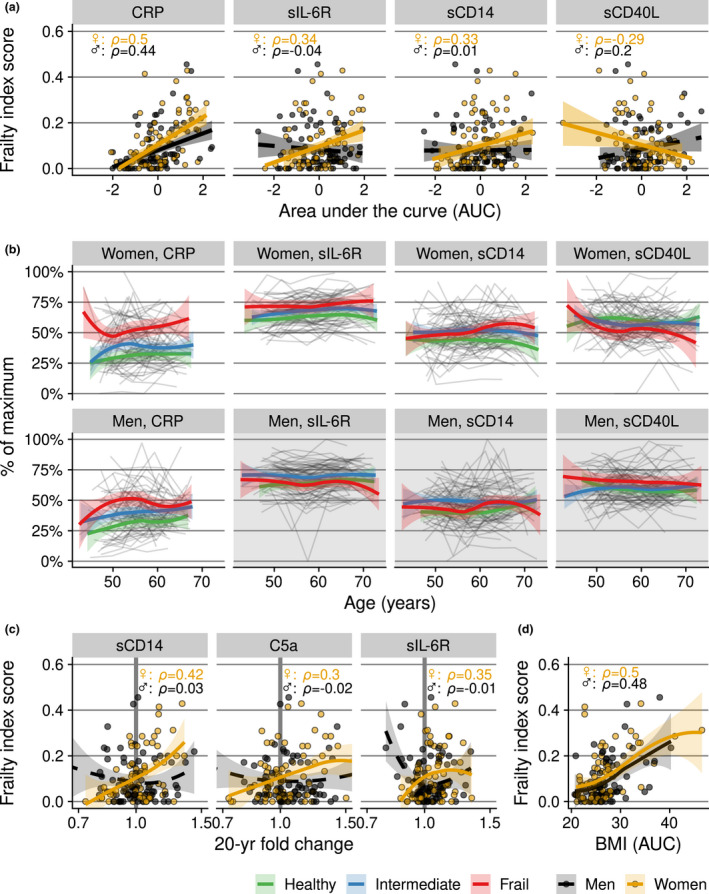
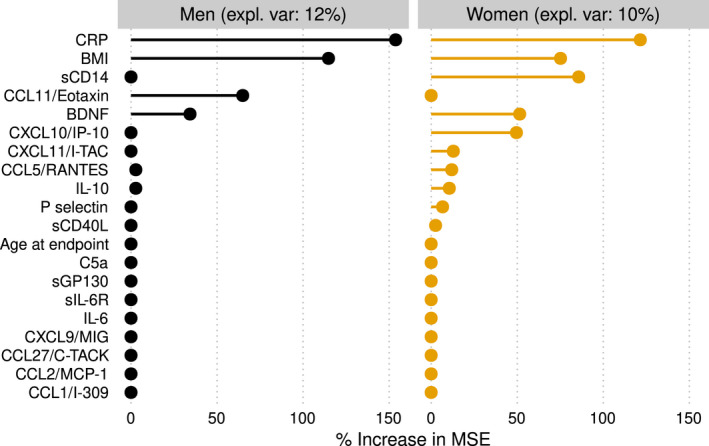
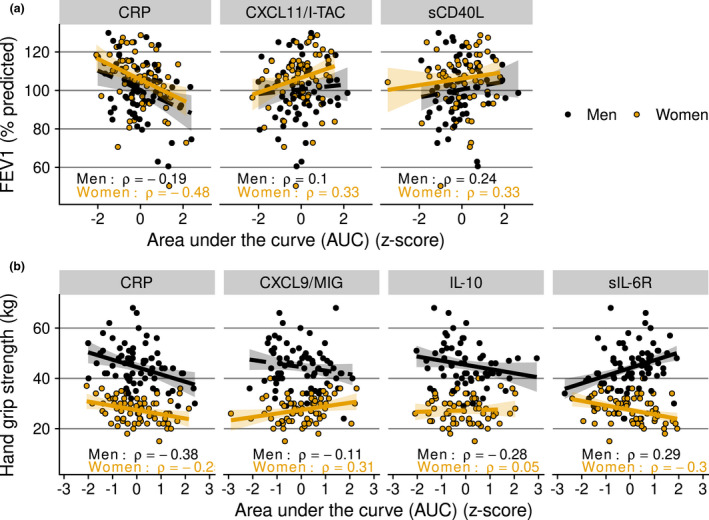
Results: IFN-γ-related markers and platelet activation markers were found to change in synchrony. Chronically elevated levels of IL-6 pathway markers, such as CRP and sIL-6R, were associated with more frailty, poorer lung function and reduced physical strength. Being overweight was a possible driver of these associations. More and stronger associations were detected in women, such as a relation between increasing sCD14 levels and frailty, indicating a possible role for monocyte overactivation. Multivariate prediction of frailty confirmed the main results, but predictive accuracy was low.

Conclusion: In summary, we documented temporal changes in and between inflammatory markers in an ageing population over a period of 20 years, and related these to clinically relevant health outcomes.

Keywords: chemokines; chronic low‐grade inflammation; cytokines; frailty; healthy ageing; longitudinal study.


Conflict of interest statement

The authors declare no conflict of interest. Author Contributions Leonard Daniël Samson: Conceptualization; Data curation; Formal analysis; Investigation; Methodology; Project administration; Software; Validation; Visualization; Writing – original draft; Writing – review & editing. Anne‐Marie Buisman: Conceptualization; Funding acquisition; Supervision; Writing – review & editing. José A Ferreira: Formal analysis; Methodology; Writing – review & editing. H Susan J Picavet: Resources; Writing – review & editing. W M Monique Verschuren: Resources; Supervision; Writing – review & editing. Annemieke M H Boots: Conceptualization; Project administration; Supervision; Writing – review & editing. Peter Engelfriet: Conceptualization; Funding acquisition; Investigation; Methodology; Supervision; Writing – review & editing.

Figures

Figure 1
Figure 1
Timeline of the study. Participants aged 65–75 years at the study endpoint had been followed for more than 20 years, with plasma samples taken and stored at 5‐year intervals. Healthy ageing index scores at baseline were determined. At last assessment, a frailty index based on 35 health parameters, including lung function and handgrip strength, was calculated for each participant.
Figure 2
Figure 2
Trajectories of inflammatory markers as a function of age. Average trajectories are shown for men (n = 73) and women (n = 71) with 95% confidence intervals, estimated by local polynomial regression. A continuous line means that an association was found between inflammatory marker trajectory and age; a dashed line means that no association was found. The y‐axis shows the percentage of the maximum concentration per biomarker. Average concentrations per biomarker (pg mL−1) are given in Supplementary table 1.
Figure 3
Figure 3
Relationships between inflammatory markers shown: (a) correlations between pairs of inflammatory markers at the study endpoint; and (b) similarities between pairs of inflammatory marker trajectories during the approximately 20 years of follow‐up. In (a), direction and strength of the association are visualised by ellipses of different eccentricities and a colour gradient. The inset shows the correlation between one pair of biomarkers (IL‐6 and IL‐10) as an example. In (b), the blue colour gradient and the size of the circles encode the percentage of participants in whom a pair of biomarkers peaked in concentration at the same time interval during follow‐up. For the pair of biomarkers IL‐6 and IL‐10, this was seen in 69% of the participants (see inset). * = existence of an association between two inflammatory markers is confirmed, based on a false discovery rate of 15%. n = 144.
Figure 4
Figure 4
Relationship between frailty at the study endpoint and inflammatory marker levels over time in men (n = 73) and women (n = 71). (a) The cumulative ‘exposure’ to inflammatory marker levels over time, expressed as the area under the inflammatory marker concentration curve versus time (AUC), standardised to take into account differences in follow‐up periods and transformed into z‐scores for visualisation and better comparison between inflammatory markers. (b) Trajectories of individuals (grey lines) and the local polynomial regression lines with 95% confidence intervals per frailty category (bold coloured lines), based on frailty index score at the study endpoint (concentrations are scaled to percentage of maximum concentration per marker). This complements the analysis in (a) and visualises marker levels evolving over time. The frailty categories in (b) were used for illustration purposes only; in the statistical analyses, the continuous frailty index score was used. Inflammatory markers are displayed when their AUCs showed an association with the frailty index score at the endpoint in at least one of the sexes. Plot area backgrounds in (b) are rendered in grey if no association was found. (c) Frailty index score (y‐axis) versus fold change in inflammatory markers over the 20‐year period (x‐axis). A vertical reference line of no increase (fold change of 1.0) is shown in bold grey. (d) Frailty index score (y‐axis) versus average body mass index (BMI) over time, expressed as AUC values (x‐axis).
Figure 5
Figure 5
Variable importance of the inflammatory marker concentrations over the previous 20 years (area under the curve) per individual in predicting frailty at the study endpoint using a random forest algorithm. Age at the study endpoint and BMI were included as variables in the model. Expl. Var: explained variance. % increase in mean‐squared error: percentage increase in mean‐squared error of the prediction of frailty after the variable is replaced by ‘random noise’. A higher value thus means that the variable is more important in predicting frailty.
Figure 6
Figure 6
(a) Subgroup of selected participants who were ‘healthy’ at baseline. 1Health status at baseline was defined by a healthy ageing index (‘healthy’ taken to be a score of 9 or 10 out of 10). 2 Health status at the endpoint was defined by a frailty index score. (b, c) Relation of frailty at the study endpoint with trajectories of CRP and sIL‐6R in the subgroup of people who were ‘healthy’ at study baseline. To capture the cumulative ‘exposure’, trajectories of CRP and sIL‐6R in (b) and of BMI in (d) are expressed as the area under the concentration/BMI versus time curve per individual. Grey lines in (c) are individual trajectories. Bold coloured lines in (b) are (robust) linear regression lines, and in (c) and (d), local polynomial regression lines with 95% confidence intervals. In (c), the colour denotes the ‘frailty category’ at the study endpoint. Frailty categories are used for visualisation of the longitudinal trajectory; for the statistical analyses, the continuous frailty index score was used. Concentrations in (c) are scaled to percentage of maximum concentration per marker.
Figure 7
Figure 7
Inflammatory marker trajectories in men and women of those that showed an association with physiological clinical parameters of ageing at the study endpoint. (a) Lung function assessed by forced expiratory volume in one second (FEV1); and (b) handgrip strength measured as a proxy for physical strength. As a measure of cumulative ‘exposure’, inflammatory marker levels were assessed as the area under the inflammatory marker concentration versus time curve per individual (AUC) during the 20‐year follow‐up. AUC values were transformed to z‐scores for visualisation. % predicted: FEV1 value compared with the reference values from the Global Lung Initiative, specific for age, length and sex. An association is indicated by a continuous trendline; otherwise, a dashed trendline is shown.

References

    1. United Nations . World Population Ageing 2015. UN; 2017. https://www.un‐ilibrary.org/population‐and‐demography/world‐population‐a... (accessed 3 July 2020).
    1. Baylis D, Bartlett DB, Patel HP, Roberts HC. Understanding how we age: insights into inflammaging. Longev Healthspan 2013; 2: 8. - PMC - PubMed
    1. Franceschi C, Garagnani P, Vitale G, Capri M, Salvioli S. Inflammaging and ‘Garb‐aging’. Trends in Endocr Metab 2017; 28: 199–212. - PubMed
    1. Ghigliotti G, Barisione C, Garibaldi S et al. Adipose tissue immune response: novel triggers and consequences for chronic inflammatory conditions. Inflammation 2014; 37: 1337–1353. - PMC - PubMed
    1. Gale CR, Baylis D, Cooper C, Sayer AA. Inflammatory markers and incident frailty in men and women: the English Longitudinal Study of Ageing. Age 2013; 35: 2493–2501. - PMC - PubMed