. 2021 Dec 21;13(1):452-463.
doi: 10.1364/BOE.444696. eCollection 2022 Jan 1.

Imaging deeper than the transport mean free path with multiphoton microscopy

Affiliations

Imaging deeper than the transport mean free path with multiphoton microscopy

Najva Akbari et al. Biomed Opt Express. .

Abstract

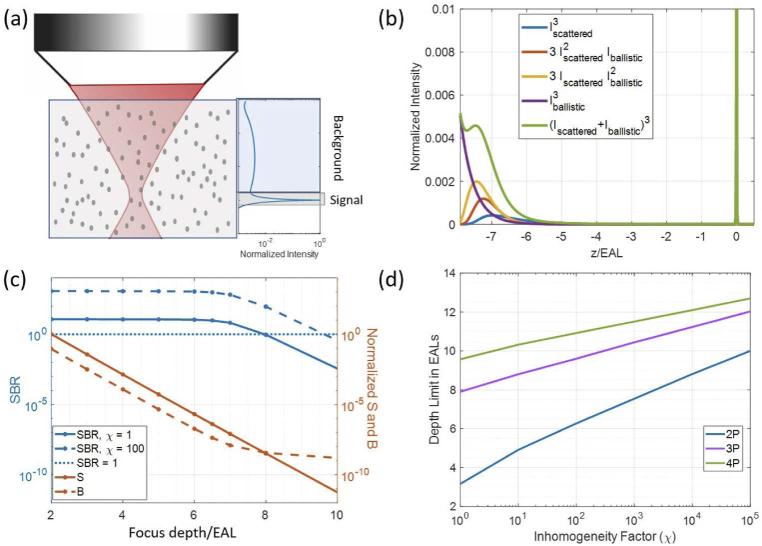
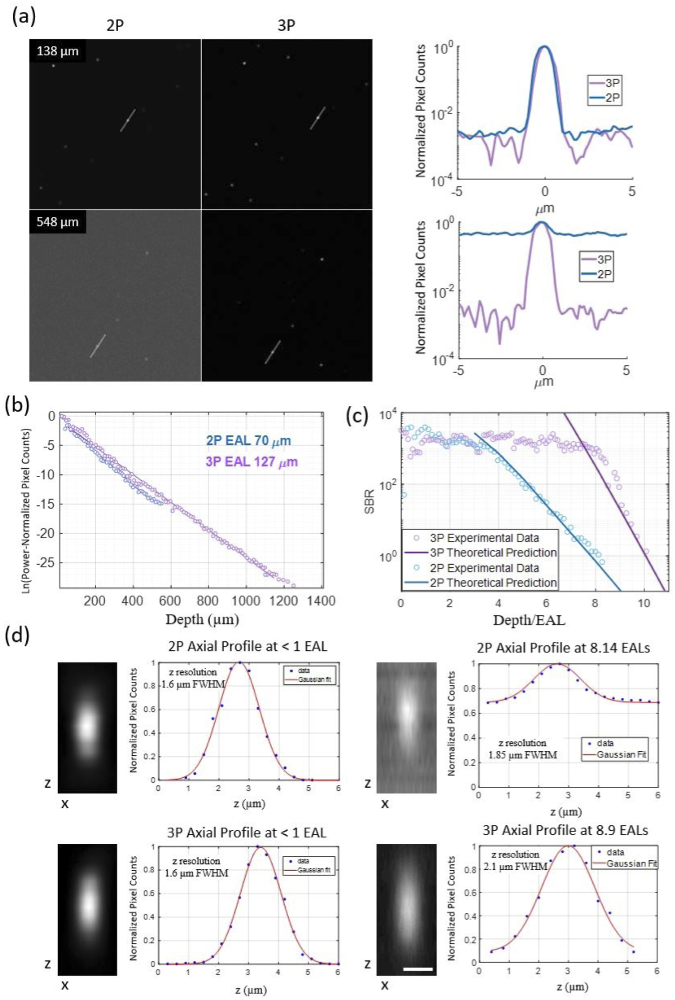
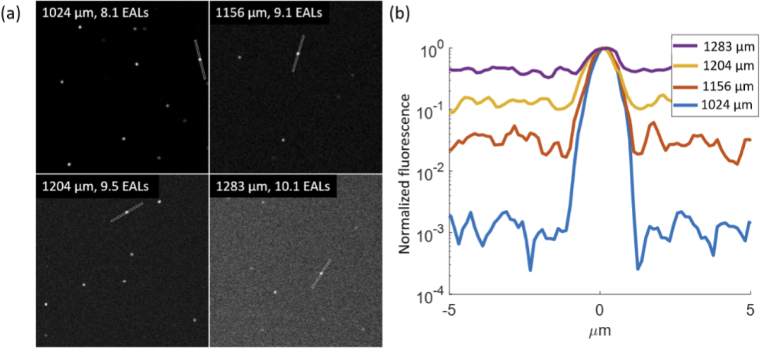
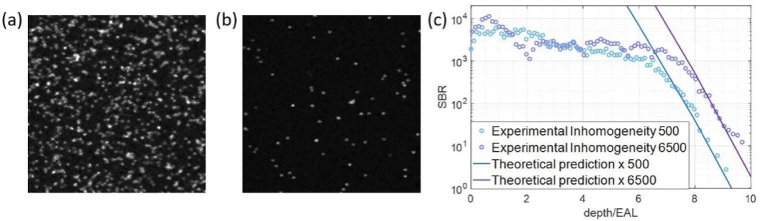
Multiphoton fluorescence microscopy enables deep in vivo imaging by using long excitation wavelengths to increase the penetration depth of ballistic photons and nonlinear excitation to suppress the out-of-focus fluorescence. However, the imaging depth of multiphoton microscopy is limited by tissue scattering and absorption. This fundamental depth limit for two-photon microscopy has been studied theoretically and experimentally. Long wavelength three-photon fluorescence microscopy was developed to image beyond the depth limit of two-photon microscopy and has achieved unprecedented in vivo imaging depth. Here we extend the theoretical framework for characterizing the depth limit of two-photon microscopy to three-photon microscopy. We further verify the theoretical predictions with experimental results from tissue phantoms. We demonstrate experimentally that high spatial resolution diffraction-limited imaging at a depth of 10 scattering mean free paths, which is nearly twice the transport mean free path, is possible with multiphoton microscopy. Our results indicate that the depth limit of three-photon microscopy is significantly beyond what has been achieved in biological tissues so far, and further technological development is required to reach the full potential of three-photon microscopy.


Conflict of interest statement

The authors declare no conflicts of interest.

Figures

Fig. 1.
Fig. 1.
Intensity distribution simulations for typical imaging parameters in biological sample with NA of 1. The parameters used for 2P imaging are: g = 0.88, λ = 920 nm, τ = 100 fs, EAL = 150 µm. The parameters used for 3P imaging are: g = 0.81, λ = 1280 nm, τ = 50 fs, EAL = 300 µm. The parameters used for 4P imaging are: g = 0.73, λ = 1680 nm, τ = 50 fs, EAL = 380 µm. (a) Schematic illustration of a focused Gaussian beam inside a scattering medium, with the corresponding axial fluorescence distribution as a function of depth shown on the right. (b) Example of the axial distribution of 3P excited fluorescence intensity calculated at a focus depth of 8 EALs inside a scattering medium. Values are normalized to the maximum fluorescence at the focus. (c) S, B, and SBR values for 3P excited fluorescence at various focus depths inside a scattering medium. SBR is plotted for inhomogeneity factor (χ) of 1 and 100. S and B values are normalized to the S value at a focus depth of 2 EALs for clarity. Data points are plotted with markers and a line connects them to find the intersection with SBR = 1 (dotted line). (d) Depth limit (depth at which SBR=1) as a function of inhomogeneity factor for 2P, 3P, and 4P excited fluorescence inside a scattering medium.
Fig. 2.
Fig. 2.
2PM and 3PM characterization in a tissue phantom with inhomogeneity factor of 4545. (a) SBR comparison of 2PM and 3PM at different depths. Left panel: 67 µm by 67 µm FOV images collected at different depths as marked on the top left corner of the image. A 5 pixel-wide line was drawn on one fluorescent bead to acquire a line intensity profile. Right panel: Line profiles of images shown on the left. (b) Measured effective attenuation lengths (EALs) at 920 nm and 1280 nm. (c) Experimentally measured and theoretically predicted SBR vs depth of 2PM and 3PM. (d) Measured axial resolution in shallow and deep regions. Zoomed-in XZ images of beads were collected with fine z steps of 0.3 µm. Scale bar indicates 1 µm.
Fig. 3.
Fig. 3.
3PM beyond the TMFP of sample characterized in Fig. 2. (a) Images at various depths with 5 pixel-wide lines drawn on a fluorescent bead. FOV: 67 µm by 67 µm. (b) Fluorescence intensity profiles of the corresponding lines in (a).
Fig. 4.
Fig. 4.
Inhomogeneity-dependent 3PM depth limit. Images are average intensity projections of 67 µm by 67 µm FOV images collected over 20 µm depth at 1 µm steps. (a) Sample with inhomogeneity factor of 500, which is equivalent to 0.2% of the volume labeled. (b) Sample with inhomogeneity factor of 6500. (c) SBR vs depth for the samples in (a) and (b).

References

    1. Choquet D., Sainlos M., Sibarita J.-B., “Advanced imaging and labelling methods to decipher brain cell organization and function,” Nat. Rev. Neurosci. 22(4), 237–255 (2021).10.1038/s41583-021-00441-z - DOI - PubMed
    1. Deisseroth K., Schnitzer M. J., “Engineering approaches to illuminating brain structure and dynamics,” Neuron 80(3), 568–577 (2013).10.1016/j.neuron.2013.10.032 - DOI - PMC - PubMed
    1. Nowzari F., Wang H., Khoradmehr A., Baghban M., Arandian A., Muhaddesi M., Nabipour I., Zibaii M. I., Najarasl M., Taheri P., Latifi H., Tamadon A., “Three-Dimensional Imaging in Stem Cell-Based Researches,” Front. Vet. Sci. 8, 657525 (2021).10.3389/fvets.2021.657525 - DOI - PMC - PubMed
    1. Bocklitz T., Silge A., Bae H., Rodewald M., Legesse F. B., Meyer T., Popp J., “Non-invasive imaging techniques: from histology to in vivo imaging,” in Molecular Imaging in Oncology , (Springer International Publishing, 2020), pp. 795–812. - PubMed
    1. Horton N. G., Wang K., Kobat D., Clark C. G., Wise F. W., Schaffer C. B., Xu C., “In vivo three-photon microscopy of subcortical structures within an intact mouse brain,” Nat. Photonics 7(3), 205–209 (2013).10.1038/nphoton.2012.336 - DOI - PMC - PubMed

LinkOut - more resources