. 2022 Jan 26:12:802482.
doi: 10.3389/fonc.2022.802482. eCollection 2022.

Stromal Fibroblasts Counteract the Caveolin-1-Dependent Radiation Response of LNCaP Prostate Carcinoma Cells

Affiliations

Stromal Fibroblasts Counteract the Caveolin-1-Dependent Radiation Response of LNCaP Prostate Carcinoma Cells

Alina Wittka et al. Front Oncol. .

Abstract

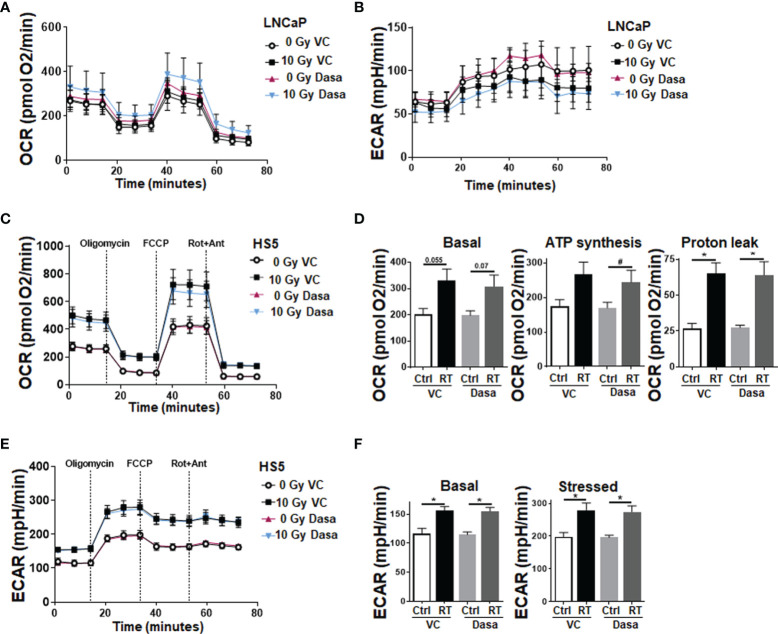
In prostate cancer (PCa), a characteristic stromal-epithelial redistribution of the membrane protein caveolin 1 (CAV1) occurs upon tumor progression, where a gain of CAV1 in the malignant epithelial cells is accompanied by a loss of CAV1 in the tumor stroma, both facts that were correlated with higher Gleason scores, poor prognosis, and pronounced resistance to therapy particularly to radiotherapy (RT). However, it needs to be clarified whether inhibiting the CAV1 gain in the malignant prostate epithelium or limiting the loss of stromal CAV1 would be the better choice for improving PCa therapy, particularly for improving the response to RT; or whether ideally both processes need to be targeted. Concerning the first assumption, we investigated the RT response of LNCaP PCa cells following overexpression of different CAV1 mutants. While CAV1 overexpression generally caused an increased epithelial-to-mesenchymal phenotype in respective LNCaP cells, effects that were accompanied by increasing levels of the 5'-AMP-activated protein kinase (AMPK), a master regulator of cellular homeostasis, only wildtype CAV1 was able to increase the three-dimensional growth of LNCaP spheroids, particularly following RT. Both effects could be limited by an additional treatment with the SRC inhibitor dasatinib, finally resulting in radiosensitization. Using co-cultured (CAV1-expressing) fibroblasts as an approximation to the in vivo situation of early PCa it could be revealed that RT itself caused an activated, more tumor-promoting phenotype of stromal fibroblats with an increased an increased metabolic potential, that could not be limited by combined dasatinib treatment. Thus, targeting fibroblasts and/or limiting fibroblast activation, potentially by limiting the loss of stromal CAV1 seems to be absolute for inhibiting the resistance-promoting CAV1-dependent signals of the tumor stroma.

Keywords: SRC; caveolin-1; dasatinib; fibroblast; prostate cancer; radiotherapy; therapy resistance; tumor microenvironment.


Conflict of interest statement

The authors declare that the research was conducted in the absence of any commercial or financial relationships that could be construed as a potential conflict of interest.

Figures

Figure 1
Figure 1
CAV1-dependent increases in AMP-activated protein kinase (AMPK)-mediated signaling accompanied by EMT phenotypes in LNCaP PCa cells. Expression levels of the indicated proteins were analyzed in whole protein lysates of cultured LNCaP PCa cells stably overexpressing the introduced CAV1 variants (wildtype CAV1, WT; phosphorylation-deficient CAV1, Y14F; the transmembrane localization affecting proline-132-to-leucine substituted CAV1, P132L) with or without radiation treatment (48 h after RT with 10 Gy) using Western blot analysis. Empty vector transduced LNCaP cells with low endogenous CAV1 levels served as controls [Ctrl (CAV-)]. (A) Representative blots from at least 4 independent experiments are shown. (B) Cell proliferation was determined using crystal violet staining. Data are summarized as mean values ± SEM of 6–13 independent experiments measured in quadruplets each. P-values indicate: *p ≤ 0.05 by one-way ANOVA with Tukey’s multiple comparison post-test and additionally by unpaired (two-tailed) t-tests depicted as ####p ≤ 0.001. (C) Cell cycle phases and apoptotic cells (subG1) were analyzed by flow cytometry. Graphs consist of data from 12–15 individual experiments (with SEM). The statistically significant differences within SubG1 (p ≤ 0.001), G1 (p ≤ 0.001), and G2 (p ≤ 0.001) values as estimated by two-way ANOVA with Tukey’s multiple comparison test (0 Gy versus 10 Gy for each CAV1 variant) were not depicted. (D) Clonogenic survival was evaluated 10 days post treatment. Coomassie stained colonies were quantified by counting. Data show the surviving fractions from at least 3 independent experiments (means ± SD) plated in triplicates each. (E) Plating efficiency was determined after 10 days following plating of low cell numbers (500 cells per 35 mm dish, plated in triplicates each). Symbols depict individual values from different independent experiments. P-value indicates: *p ≤ 0.05 by one-way ANOVA with Tukey’s multiple comparison post-test and additionally by unpaired (two-tailed) t-test depicted as #p ≤0.05. ns, not significant.
Figure 2
Figure 2
CAV1 WT-expressing LNCaP PCa cells exhibit an increased spheroid growth while lacking RT-induced growth retardation. LNCaP PCa cells stably overexpressing the introduced CAV1 variants (wildtype CAV1, WT; phosphorylation-deficient CAV1, Y14F; proline-132-to-leucine substituted CAV1, P132L) as well as control (Ctrl) LNCaP cells were cultured in hanging drops for 24 h. After formation of spheroids, cells were plated in growth factor-reduced Matrigel mixed with normal growth medium (1/2, v/v) and irradiated with 0 Gy or 10 Gy. (A) Representative phase contrast images 48 h post radiation treatment (0 and 10 Gy) are shown. Scale bar represents 150 µm. (B) Spheroid growth was measured at the time of irradiation (0 h) and 48 h later and respective volumes were calculated. Graphs depict the measurements from 4 to 8 independent experiments where at least 10 spheroids per condition were measured. P-value indicates: #p ≤ 0.05 by unpaired (two-tailed) t-test. (C) Cell death was analyzed afterwards by fluorescence microscopy using propidium iodide. Hoechst 33342 was used for nuclei staining. Representative fluorescent photographs from CAV1 WT and Ctrl LNCaP cells (with low endogenous CAV1 levels), both expressing the reporter green fluorescent protein (GFP), are exemplarily shown (48-hour time point). Scale bar represents 100 µm.
Figure 3
Figure 3
Induced CAV1 expressions do not obviously affect mitochondrial respiration rates in LNCaP PCa cells but increase respective glycolysis levels. Extracellular flux analyses were performed in order to measure oxygen consumption rates (OCR) and extracellular acidification rates (ECAR) in CAV1 WT, CAV1 Y14F, CAV1 P132L and also in control (Ctrl) LNCaP PCa cells over time, while oligomycin (Oligo; 2 µM), FCCP (0.25 µM) and rotenone/Antimycin A (Rot/Ant; 0.5 µM) were added at indicated time points. (A) OCR levels are shown. (B) Basal respiration, maximal respiration, and ATP production were depicted in separate bar diagrams. (C) Respective ECAR measurements over time are shown. (D) Basal and stressed (following oligomycin treatment) measurements of ECAR were depicted in separate bar diagrams. Data were summarized as mean values ± SD (measured in 4–7 replicates each). One of 3–4 independent experiments with similar results is exemplarily shown. P-values indicate: #p ≤ 0.05, ##p ≤ 0.01, ###p ≤ 0.005 by unpaired (two-tailed) t-tests. (E) Total cholesterol concentrations were determined by a coupled enzyme assay, which results in a colorimetric (570 nm) product proportional to the cholesterol present. Total cholesterol levels of Ctrl (CAV1−) LNCaP cells were set as 100%. Data are shown as means ± SEM of different biological replicates (Ctrl (CAV1−): n = 7; CAV1 WT: n = 10; CAV1 Y14F: n = 6; CAV1 P132L: n = 3. P-value indicates ##p ≤ 0.01 by unpaired (two-tailed) t-test (versus Ctrl).
Figure 4
Figure 4
SRC inhibition by dasatinib efficiently reduces the clonogenic survival of LNCaP cells with differential CAV1 levels and also reduces three-dimensional PCa cell growth. LNCaP PCa cells stably overexpressing the introduced WT CAV1 and control (Ctrl) LNCaP cells with low endogenous CAV1 levels were cultured in normal growth media supplemented with the SRC inhibitors dasatinib, bosutinib or vehicle control (VC) 2 h prior radiation treatment with the indicated doses (0–7.5 Gy). Clonogenic survivals were evaluated 10 days post treatment with dasatinib (A) or bosutinib (B). Coomassie stained colonies were quantified by counting. Data show the surviving fractions from at least 3 independent experiments (means ± SD) plated in triplicates each. P-values indicate: **p ≤ 0.01 by one-way ANOVA with Tukey’s multiple comparison post-test. (C) Growth patterns of CAV1 WT and control LNCaP spheroids were evaluated 48 h post RT (10 Gy) and combined dasatinib treatment. Graphs depict the measurements from 4 to 6 independent experiments where at least 10 spheroids per condition (and per experiment) were measured. P-value indicates: #p ≤ 0.05 by unpaired (two-tailed) t-test. Cell death was analyzed afterwards by fluorescence microscopy using propidium iodide. Hoechst 33342 was used for nuclei staining. Representative fluorescent photographs from CAV1 WT and Ctrl LNCaP cells (with low endogenous CAV1 levels) are shown (48-hour time point). Scale bar represents 100 µm. (D) Expression levels of the indicated proteins were analyzed in whole protein lysates of cultured CAV1 WT and control LNCaP PCa with or without radiation and SRC inhibitor (dasatinib and bosutinib) treatment (48 h after RT with 10 Gy) using Western blot analysis. Representative blots at least 3–4 independent experiments are shown.
Figure 5
Figure 5
Stromal fibroblasts limit the radiosensitizing effect of SRC inhibition by dasatinib in LNCaP spheroid co-cultures. CAV1 expressing stromal fibroblasts (HS5) were co-cultured with LNCaP control (Ctrl) cells expressing low endogenous CAV1 levels and the reporter green fluorescent protein (GFP) in hanging drops for 24 h. After formation of spheroids, cells were plated in growth factor-reduced Matrigel mixed with normal growth medium (1/2, v/v) supplemented with dasatinib or vehicle control (VC) and irradiated with 0 Gy or 10 Gy. Pictures were taken at the time of irradiation (0 h) and 48 h later. (A) Spheroid growth was measured and the respective volumes were calculated for 0 and 48 h after irradiation. Data were derived from 3 to 5 individual experiments, where at least 10 spheroids per condition and per experiment each were measured. (B) Cell death was analyzed afterwards by fluorescence microscopy using propidium iodide. Hoechst 33342 was used for nuclei staining. Representative fluorescent images from the individual experiments are shown (48 h time point). Scale bars represent 100 µm.
Figure 6
Figure 6
Dasatinib treatment does not impact on survival or growth of stromal fibroblasts, nor in combination with RT. CAV1 expressing stromal fibroblasts (HS5) were cultured as monolayers (A, B) or spheroids (C, D) with or without radiation treatment (0 and 10 Gy) in the presence of dasatinib or vehicle control (VC), (A) Apoptotic cells (subG1) were analyzed 48 h post treatment by flow cytometry. Graphs consist of data from 3 individual experiments (with SEM). P-values indicate ***p ≤0.005 as estimated by one-way ANOVA with Tukey’s multiple comparison test. (B) Clonogenic survival was evaluated 10 days post treatment by counting respective colonies. Data show the surviving fractions from 3 independent experiments (means ± SD) plated in triplicates each. (C) Spheroid growth was measured and the respective volumes were calculated for 0 and 48 h after irradiation from 3 to 4 individual experiments where at least 10 spheroids per condition and per experiment each were measured. (D) Cell death was analyzed afterwards by fluorescence microscopy using propidium iodide. Hoechst 33342 was used for nuclei staining. Representative fluorescent images from individual experiments are shown (48 h time point). Scale bar represents 100 µm.
Figure 7
Figure 7
RT treatment causes an increased metabolic potential of fibroblasts, an effect that is not affected upon SRC inhibition; LNCaP PCa cells are not affected. Extracellular flux analyses of LNCaP and fibroblast cell cultures were performed following RT treatment (0 and 10 Gy) in the presence of dasatinib or vehicle control (VC) 24 h post treatments. OCR (A) and ECAR (B) levels of LNCaP PCa cells are shown. Data were summarized as mean values ± SD (measured in 4–7 replicates each). (C) OCR levels of stromal HS5 fibroblasts are shown. (D) Basal respiration, ATP production and proton leak were depicted in separate bar diagrams. (E) Respective ECAR measurement over time are shown. (F) Basal and stressed (following oligomycin treatment) measurements of ECAR were depicted in separate bar diagrams. Data were summarized as mean values ± SD (measured in 4–7 replicates each). P-values indicate: *p ≤ 0.05, by one-way ANOVA with Tukey’s multiple comparison test and additionally by unpaired (two-tailed) t-tests depicted as #p ≤0.05.
Figure 8
Figure 8
RT-induced stromal alterations decisively impact on adjacent prostate carcinoma (PCa) cells. PCa progression is associated with a critical shift of epithelial–stromal CAV1 expression levels. A re-expression of CAV1 within the malignant epithelial cells could be associated with epithelial-to-mesenchymal transition (EMT), an increased three-dimensional spheroid growth and RT resistance as investigated here. Concerning the related signaling, CAV1 seems to are promote adenosine monophosphate-activated protein kinase (AMPK) and potentially heat shock protein 27 (HSP27) activities, at least in combination with RT. As an assumption, increased HSP27 phosphorylations could foster (androgen-independent) androgen receptor (AR) signaling by displacing other HSPs (e.g., HSP90) from the cytosolic complex, with the AR subsequently squiring into the nucleus modulating target gene (e.g., EMT gene) expressions. It was further shown here, that PTRF (cavin-1)-deficient LNCaP PCa cells exhibit long-lasting high-density GM1 ganglioside containing signaling domains that were not affected following a gain in CAV1. In general, upon CAV1 re-expressions, either following increased cellular stress (e.g., by radiation treatment, RT) or by ectopic expression of CAV1, CAV1 can be found at the plasma membrane in non-caveolae plasma membrane domains, so-called scaffolds. Accompanied cholesterol binding reduces the amount of available cholesterol and thus the precursor for the synthesis of the steroid hormones. We therefore speculate that CAV1-dependent receptor signaling and raft-dependent endocytosis might account for signalosome-amplified signaling events that finally foster PCa cells growth, invasion and therapy resistance. Herein CAV1 Tyr14 phosphorylation seemed not to be required for the increased invasion potential of CAV1-expressing LNCaP cells, as it was shown within the present study that CAV1 Y14F-expressing LNCaP cells showed a similar EMT-phenotype but lacked increased three-dimensional spheroid growth. Similarly, non-plasma membrane-localized CAV1 was associated with an EMT phenotype while lacking increased spheroid growth. A gain of epithelial CAV1 could further be linked to increasing metabolic demands that were managed by increased glycolysis levels. Within CAV1 P132L-expressing LNCaP PCa cells, the strongest increase in glycolysis could be observed that, together with increased mitochondrial respiration rates, may compensate a reduced cholesterol utilization due to decreased cholesterol levels. RT-induced HSP27 signaling together with an increased AMPK-dependent signaling might even foster other metabolic processes to generate energy and biomolecules, e.g., fatty acid oxidation. In contrast, an activated fibroblast phenotype either following RT or potentially following ‘education’ by adjacent cancer cells will act tumor supporting, which in turn limits applied therapies. Likewise, a loss of stromal CAV1 was already shown to come along with a more reactive fibroblast phenotype as well as increased radioresistance of advanced PCa. Particularly increases in the metabolic potential as shown here following RT, and thus exocytosis of fibroblast-derived factors could not only fuel adjacent cancer cells but even comprise a feeding with resistance factors finally fostering PCa progression and therapy resistance. Thus, the loss of stromal CAV1 rather than the gain of epithelial CAV1 accounts more decisively for (radiation) therapy failure.

Similar articles

Cited by

References

    1. Sung H, Ferlay J, Siegel RL, Laversanne M, Soerjomataram I, Jemal A, et al. . Global Cancer Statistics 2020: GLOBOCAN Estimates of Incidence and Mortality Worldwide for 36 Cancers in 185 Countries. CA Cancer J Clin (2021) 71:209–49. doi: 10.3322/caac.21660 - DOI - PubMed
    1. Wilt TJ, Ullman KE, Linskens EJ, Macdonald R, Brasure M, Ester E, et al. . Therapies for Clinically Localized Prostate Cancer: A Comparative Effectiveness Review. J Urol (2021) 205:967–76. doi: 10.1097/JU.0000000000001578 - DOI - PubMed
    1. He L, Fang H, Chen C, Wu Y, Wang Y, Ge H, et al. . Metastatic Castration-Resistant Prostate Cancer: Academic Insights and Perspectives Through Bibliometric Analysis. Medicine (Baltimore) (2020) 99:e19760. doi: 10.1097/MD.0000000000019760 - DOI - PMC - PubMed
    1. Cornford P, Bellmunt J, Bolla M, Briers E, De Santis M, Gross T, et al. . EAU-ESTRO-SIOG Guidelines on Prostate Cancer. Part II: Treatment of Relapsing, Metastatic, and Castration-Resistant Prostate Cancer. Eur Urol (2017) 71:630–42. doi: 10.1016/j.eururo.2016.08.002 - DOI - PubMed
    1. Mottet N, Bellmunt J, Bolla M, Briers E, Cumberbatch MG, De Santis M, et al. . EAU-ESTRO-SIOG Guidelines on Prostate Cancer. Part 1: Screening, Diagnosis, and Local Treatment With Curative Intent. Eur Urol (2017) 71:618–29. doi: 10.1016/j.eururo.2016.08.003 - DOI - PubMed