

Dynamic APACHE II Score to Predict the Outcome of Intensive Care Unit Patients
- PMID: 35155461
- PMCID: PMC8826444
- DOI: 10.3389/fmed.2021.744907
Dynamic APACHE II Score to Predict the Outcome of Intensive Care Unit Patients
Abstract
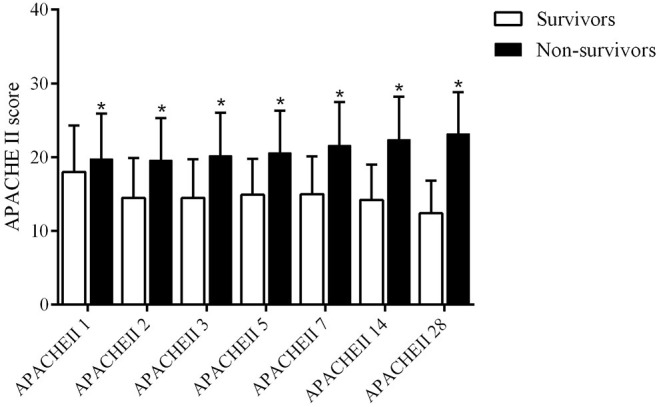
Objective: This study aims to evaluate the accuracy of the Acute Physiology and Chronic Health Evaluation (APACHE) II score on different days in predicting the mortality of critically ill patients to identify the best time point for the APACHE II score.
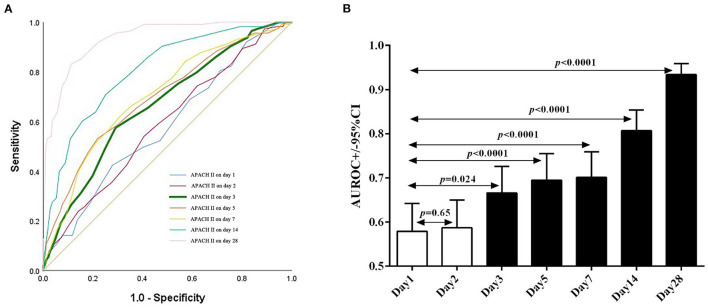
Methods: The demographic and clinical data are retrieved from the Medical Information Mart for Intensive Care (MIMIC)-IV dataset. APACHE II scores on days 1, 2, 3, 5, 7, 14, and 28 of hospitalization are calculated, and their performance is evaluated using the area under the receiver operating characteristic (AUROC) analysis. The cut-off for defining the high risk of mortality is determined using Youden's index. The APACHE II score on day 3 is the best time point to predict hospital mortality of ICU patients. The Hosmer-Lemeshow goodness-of-fit test is then applied to evaluate the calibration of the day 3 APACHE II score.
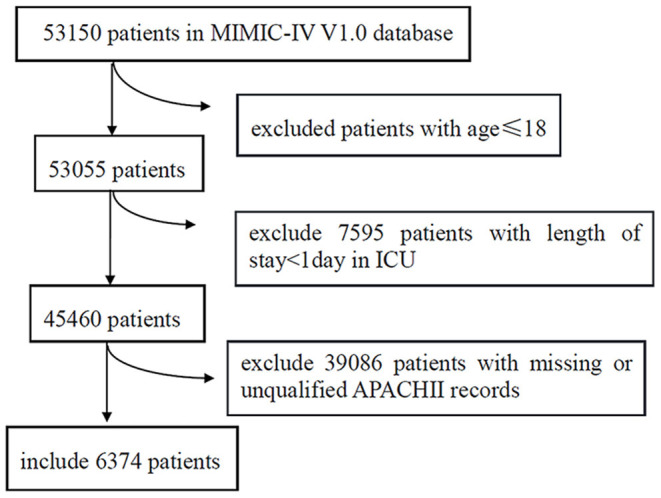
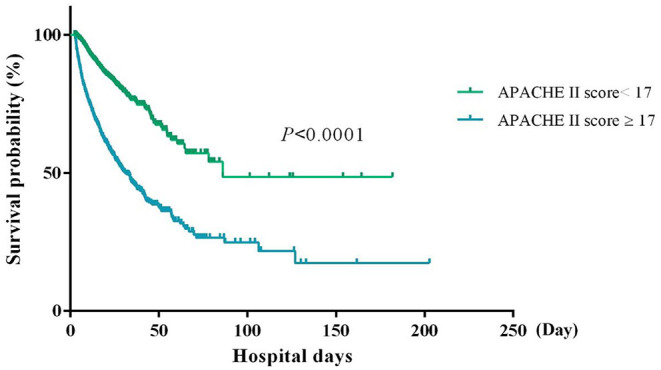
Results: We recruited 6,374 eligible subjects from the MIMIC-IV database. Day 3 is the optimal time point for obtaining the APACHE II score to predict the hospital mortality of patients. The best cut-off for day 3 APACHE II score is 17. When APACHE II score ≥17, the sensitivity for the non-survivors and survivors is 92.8 and 82.2%, respectively, and the positive predictive value (PPV) is 23.1%. When APACHE II socre <17, the specificity for non-survivors and survivors is 90.1 and 80.2%, respectively, and the negative predictive value (NPV) is 87.8%. When day-3 APACHE II is used to predict the hospital mortality, the AUROC is 0.743 (P <0.001). In the ≥17 group, the sensitivity of non-survivors and survivors is 92.2 and 81.3%, respectively, and the PPV is 30.3%. In the <17 group, the specificity of non-survivors and survivors is 100.0 and 80.2%, respectively, and the NPV is 81.6%. The Hosmer-Lemeshow test indicated day-3 APACHE II has a high predicting the hospital mortality (X 2 = 6.198, P = 0.625, consistency = 79.4%). However, the day-1 APACHE II has a poor calibration in predicting the hospital mortality rate (X 2 = 294.898, P <0.001).
Conclusion: Day-3 APACHE II score is an optimal biomarker to predict the outcomes of ICU patients; 17 is the best cut-off for defining patients at high risk of mortality.
Keywords: APACHE II; MIMIC-IV; intensive care units; mortality; predictor.
Copyright © 2022 Tian, Yao, Zhou, Diao, Chen, Cai, Ma and Wang.
Conflict of interest statement
The authors declare that the research was conducted in the absence of any commercial or financial relationships that could be construed as a potential conflict of interest.
Figures
References
-
- Raith EP, Udy AA, Bailey M, McGloughlin S, MacIsaac C, Bellomo R, et al. Australian, outcomes NZICSCf, evaluation R: prognostic accuracy of the SOFA score, SIRS criteria, and qSOFA score for in-hospital mortality among adults with suspected infection admitted to the intensive care unit. JAMA. (2017) 317:290–300. 10.1001/jama.2016.20328 - DOI - PubMed
LinkOut - more resources
Full Text Sources