. 2022 Feb 1:2022:1178874.
doi: 10.1155/2022/1178874. eCollection 2022.

A Novel In Situ Dendritic Cell Vaccine Triggered by Rose Bengal Enhances Adaptive Antitumour Immunity

Affiliations

A Novel In Situ Dendritic Cell Vaccine Triggered by Rose Bengal Enhances Adaptive Antitumour Immunity

Lanlin Zhang et al. J Immunol Res. .

Abstract

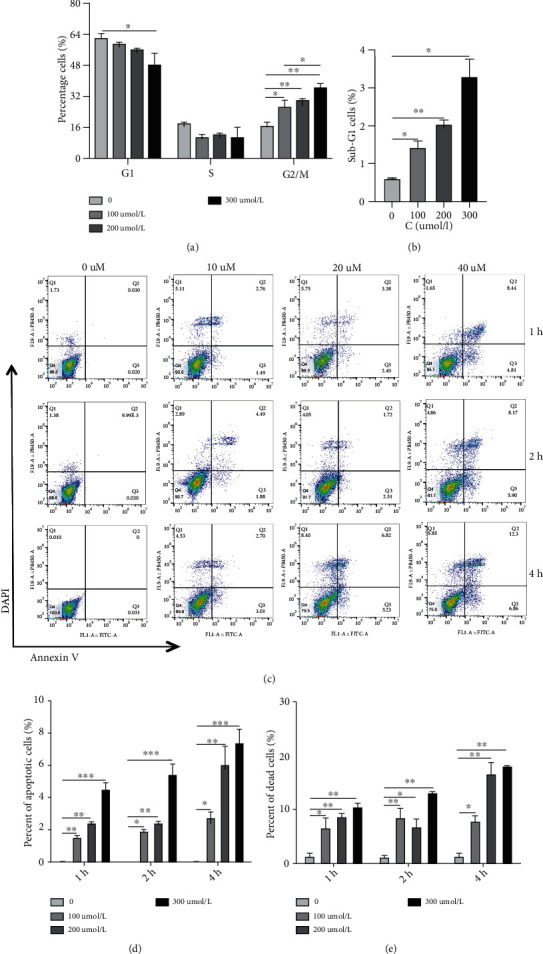
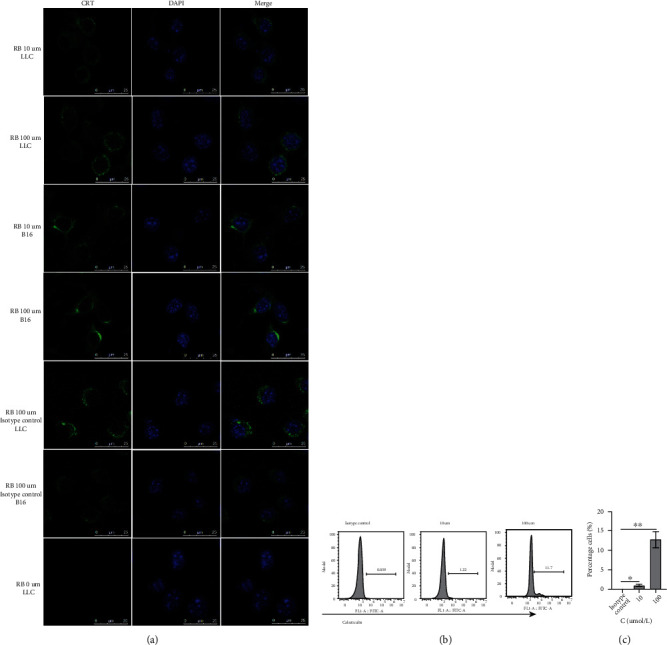
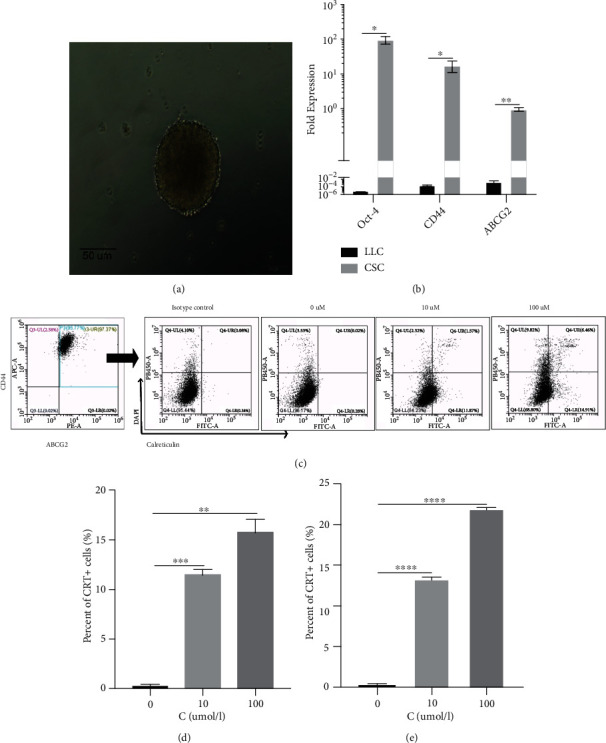
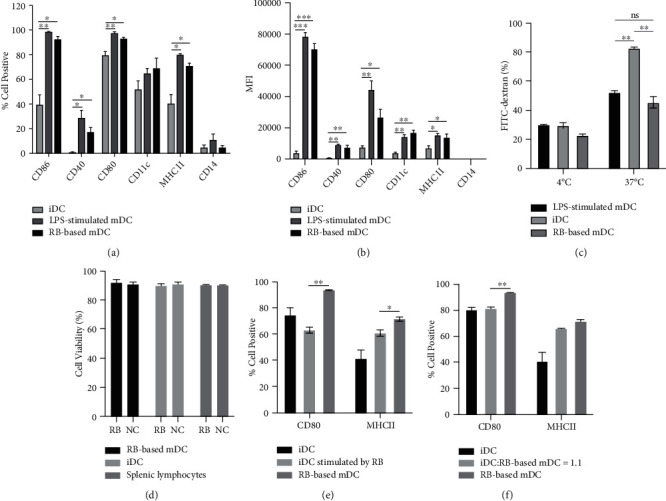
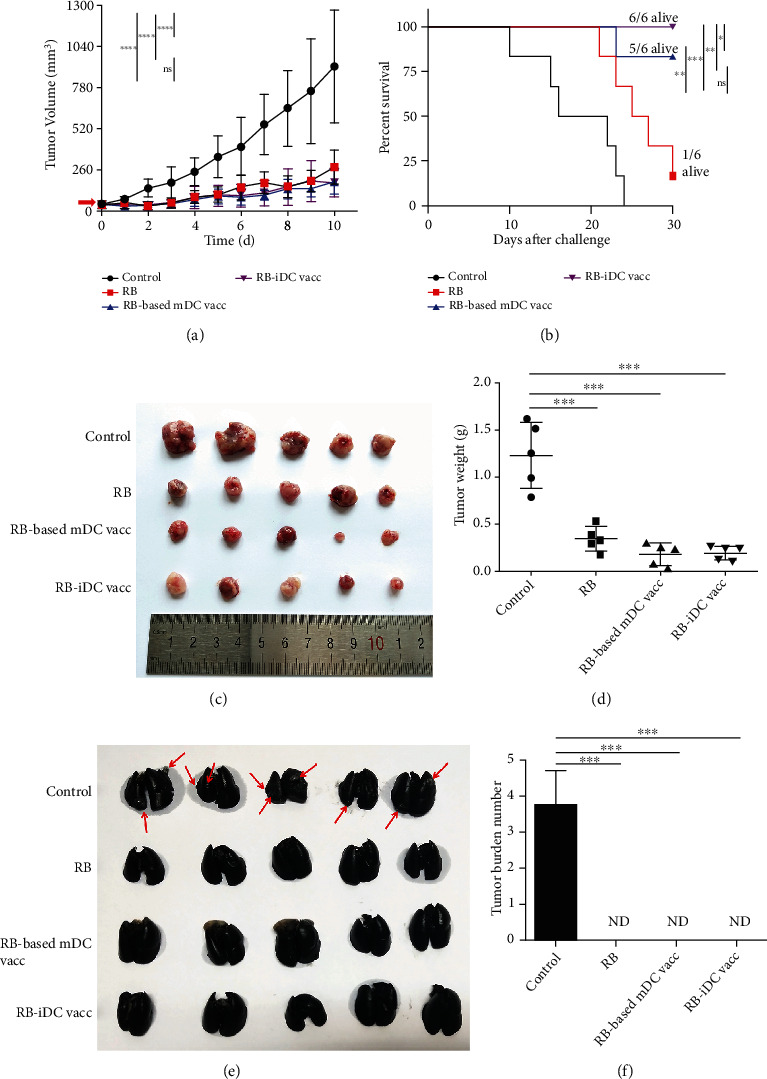
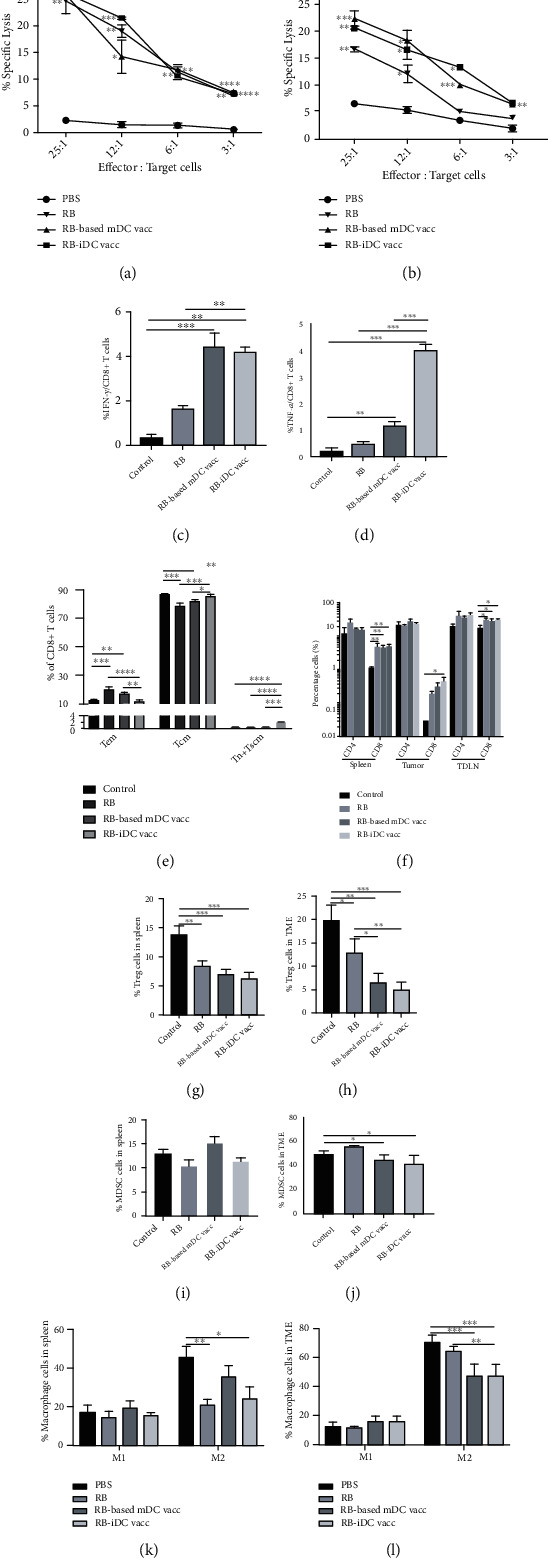
Dendritic cell- (DC-) based vaccination has emerged as a promising antitumour immunotherapy. However, overcoming immune tolerance and immunosuppression in the tumour microenvironment (TME) is still a great challenge. Recent studies have shown that Rose Bengal (RB) can effectively induce immunogenic cell death (ICD) in cancer cells, presenting whole tumour antigens for DC processing and presentation. However, the synergistic antitumour effect of combining intralesional RB with immature DCs (RB-iDCs) remains unclear. In the present study, we investigated whether RB-iDCs have superior antitumour effects compared with either single agent and evaluated the immunological mechanism of RB-iDCs in a murine lung cancer model. The results showed that intralesional RB-iDCs suppressed subcutaneous tumour growth and lung metastasis, which resulted in 100% mouse survival and significantly increased TNF-α production by CD8+ T cells. These effects were closely related to the induction of the expression of distinct ICD hallmarks by RB in both bulk cancer cells and cancer stem cells (CSCs), especially calreticulin (CRT), thus enhancing immune effector cell (i.e., CD4+, CD8+, and memory T cells) infiltration and attenuating the accumulation of immunosuppressive cells (i.e., Tregs, macrophages, and myeloid-derived suppressor cells (MDSCs)) in the TME. This study reveals that the RB-iDC vaccine can synergistically destroy the primary tumour, inhibit distant metastasis, and prevent tumour relapse in a lung cancer mouse model, which provides important preclinical data for the development of a novel combinatorial immunotherapy.


Conflict of interest statement

The authors declare no potential conflicts of interest.

Figures

Figure 1
Figure 1
RB induced cell cycle arrest and cell death. (a) After the treatment for 24 h with different doses of RB, LLCs mainly exhibited G2/M growth arrest. The gating strategy of cell cycle: First, the adherent cells were removed, and the cell cycle was analysed by the cell cycle model version of FlowJo v10. Software programs provided the estimate of cell percentage with fractional DNA content and cell cycle in sub-G1, G1, S, or G2/M phase. Three independent experiments were performed. (b) The percentage of cells with sub-G1 DNA content in LLCs. (c–e) RB induced cell apoptosis and necrosis in a dose- and time-dependent manner. Representative flow cytometry data are presented (c), and three independent experiments were performed (d, e). The gating strategy of cell necrosis: First, the cells were collected, and the voltage was adjusted with the blank control. Then, a new scatterplot was created, the target cells were gated (cross gate), and the scatterplot was finally compensated by FITC and DAPI single-stained controls. The assay was carried out in triplicate and repeated three times. The results are expressed as the mean values ± SD. One-way ANOVA was performed, and significance level was defined as P < 0.05, ∗∗P < 0.01, and ∗∗∗P < 0.001.
Figure 2
Figure 2
Cancer cells treated with RB were exposed to calreticulin on the surface (ecto-CRT). (a) Immunofluorescence analysis of ecto-CRT expression on LLC and B16 cells that were treated with RB (10 or 100 μM, respectively) for 24 h. (b, c) LLC exhibited increased ecto-CRT expression in a dose-dependent manner after 30 min of RB treatment. The gating strategy of ecto-CRT expression of LLCs: First, the cells were collected, and the voltage was adjusted to the blank control. Then, a new scatterplot was created, the target cells were gated (cross gate), and the scatterplot was finally compensated by FITC and DAPI single-stained controls. Representative flow cytometry data are presented (b) as the mean ± SD from three representative independent experiments (c). The assay was carried out in triplicate and repeated three times. The results are expressed as the mean values ± SD. One-way ANOVA was performed, and the significance level was defined as P < 0.05 and ∗∗P < 0.01.
Figure 3
Figure 3
Lewis cancer stem cells treated with RB were exposed to calreticulin on the surface (ecto-CRT). (a) The increased size of the cell spheres after 7 days (magnification of 200x). (b) The results of the real-time quantitative PCR analysis indicated that the expression of the Oct-4, CD44, and ABCG2 genes was significantly elevated in Lewis CSCs than LLCs. (c–e) The RB treatment induced increased ecto-CRT expression in CSCs in a dose-dependent manner. Increased expression was observed on both live (d) and dead cells (e) based on flow cytometric analysis. The gating strategy of ecto-CRT expression in cancer stem cells: First, the cells were collected, and the voltage was adjusted according to the blank control. Then, a new scatterplot was created, and the target cells were gated (cross gate) and finally compensated by APC, PE, FITC, and DAPI single-stained controls. A representative example of three separate experiments is summarized in (d). The mean ± SD are shown. One-way ANOVA was performed, and the significance level was defined as ∗∗P < 0.01, ∗∗∗P < 0.001, and ∗∗∗∗P < 0.0001.
Figure 4
Figure 4
RB-treated LLCs induced the mature DC phenotype. The percentage of positive cells was shown according to the FMO control. On day 6, iDCs were collected and cultured with RB-treated LLCs for 69 h. The results are shown as “RB-based mDC.” As a positive control, iDCs were stimulated with LPS for 24 h. The results are shown as “LPS-stimulated mDC.” And iDCs without stimulation were used as negative control. (a, b) The percentage and the mean fluorescence intensity (MFI) of cells that stained positive for the cell surface markers of the mature DC phenotype. The data are representative of 8 experiments. The assay was carried out in triplicate and repeated three times. (c) RB-based mDCs or LPS-stimulated mDCs significantly reduced FITC-dextran uptake compared with iDCs. (d) iDCs, RB-based mDCs, and splenic lymphocytes were treated with 1 mM RB for 24 h. Cells were cultured in medium without RB as a negative control (referred as “NC”), and then, the cells were quantified using Vi-cell XR. (e, f) iDCs stimulated by RB alone (e) or RB-based mDCs (f) did not undergo maturation. The data shown are mean ± SD from representative of three independent experiments. Significance between samples was calculated by Student's t-test (d) and one-way ANOVA (a–c, e, f) (ns indicates no statistical significance, P < 0.05, ∗∗P < 0.01, ∗∗∗P < 0.001, ∗∗∗∗P < 0.0001).
Figure 5
Figure 5
The antitumour effects of the RB, RB-based mDC vaccine, and RB-iDC vaccine treatments. (a) LLC tumours were grown to approximately 1300 mm3 in the groups, with 5 animals per condition. The graphs describe the tumour growth kinetics of the control animals treated with PBS and the animals receiving the three designated treatments, as indicated by the label in the upper right-hand corner of each graph. All animals received RB by intralesional injection; the mice of the RB-based mDC vaccine-treated group received 1 × 10⁶ bone marrow-derived mature DCs pulsed with RB-treated LLC lysis, and the RB-iDC vaccine-treated group underwent RB injection and then received 1 × 10⁶ bone marrow-derived iDCs 10 min later by intralesional injection. Each group received only one treatment. All animals received RB, the RB-based mDC vaccine, or the RB-iDC vaccine on day 0. (b) Mouse survival is shown as a Kaplan–Meier curve (n = 6/group). Significant differences in survival were observed between the RB-iDC vaccine group and the other three groups. (c) The tumours were removed from all the mice of the four groups and photographed. (d) LLC tumour weight comparisons among the four groups were performed on day 30 after the tumour challenge. (e) Representative lungs from the treated mice are shown. (f) Dots represent the mean number ± SD of lung metastasis lesions. ND: not detected. The data represent three independent experiments. Significance between samples was evaluated by one-way ANOVA (ns: not statistically significant, P < 0.05, ∗∗P < 0.01, ∗∗∗P < 0.001, ∗∗∗∗P < 0.0001).
Figure 6
Figure 6
RB, RB-based mDC vaccine, and RB-iDC vaccine treatments led to tumour-specific T cell responses, the induction of immune effector cells and the attenuation of immunosuppressive cells in the LLC mouse model. (a, b) The CTL responses in the PBS-, RB-, RB-based mDC vaccine-, and RB-iDC vaccine-treated mice are shown. CTL responses were assessed in vitro using LLCs and Lewis CSCs as the target cells, respectively. The spleen was harvested at the end of the experiment. Splenic lymphocytes stimulated with RB-treated LLCs were used as the effector cells. Three mice per group were analysed. (c, d) After restimulating the splenocytes with RB-treated LLC in vitro, the intracellular IFN-γ and TNF-α production of CD8+ T cells was measured by flow cytometry. PBS served as a control. The results are shown as the percentages of IFN-γ- and TNF-α-producing CD8+ T cells among the total CD8+ T cell population. (e) The percentages of Tem (CD8+ CD62L CD44+), Tscm+Tn (CD8+ CD62L+ CD44), and Tcm (CD8+ CD62L+ CD44+) cells are shown. (f) Ten days after therapy, the CD4+ T and CD8+ T cells of the splenic lymphocyte, tumour-infiltrating cell, and TDLN populations were analysed by flow cytometry (n = 6). The data are representative of three independent experiments. (g, h) The Treg percentages. (i, j) The MDSC percentages. (k, l) The macrophage percentages in the TME and spleen are shown. Immune effector cells and immunosuppressive cells were analysed by flow cytometry (n = 5). The data are representative of three independent experiments. The mean ± SD are shown. Significance between samples was calculated by one-way ANOVA (P < 0.05, ∗∗P < 0.01, ∗∗∗P < 0.001).

Similar articles

Cited by

References

    1. Bray F., Ferlay J., Soerjomataram I., Siegel R. L., Torre L. A., Jemal A. Global cancer statistics 2018: GLOBOCAN estimates of incidence and mortality worldwide for 36 cancers in 185 countries. CA: a Cancer Journal for Clinicians . 2018;68(6):394–424. doi: 10.3322/caac.21492. - DOI - PubMed
    1. Zhang S., Bai X., Shan F. The progress and confusion of anti-PD1/PD-L1 immunotherapy for patients with advanced non-small cell lung cancer. International Immunopharmacology . 2020;80:p. 106247. doi: 10.1016/j.intimp.2020.106247. - DOI - PubMed
    1. Barnet M. B., Cooper W. A., Boyer M. J., Kao S. Immunotherapy in non-small cell lung cancer: shifting prognostic paradigms. Journal of Clinical Medicine . 2018;7(6):p. 151. doi: 10.3390/jcm7060151. - DOI - PMC - PubMed
    1. Zhang L., Qi Y., Xing K., Qian S., Zhang P., Wu X. A novel strategy of EGFR‑TKI combined chemotherapy in the treatment of human lung cancer with EGFR‑sensitive mutation. Oncology Reports . 2018;40(2):1046–1054. doi: 10.3892/or.2018.6499. - DOI - PubMed
    1. Yang Q., Xu Z., Zheng L., Zhang L., You Q., Sun J. Multimodal detection of PD-L1: reasonable biomarkers for immune checkpoint inhibitor. American Journal of Cancer Research . 2018;8(9):1689–1696. - PMC - PubMed

MeSH terms