. 2022 Jan 26;7(5):4001-4010.
doi: 10.1021/acsomega.1c05060. eCollection 2022 Feb 8.

Artificial Intelligent Olfactory System for the Diagnosis of Parkinson's Disease

Affiliations

Artificial Intelligent Olfactory System for the Diagnosis of Parkinson's Disease

Wei Fu et al. ACS Omega. .

Abstract

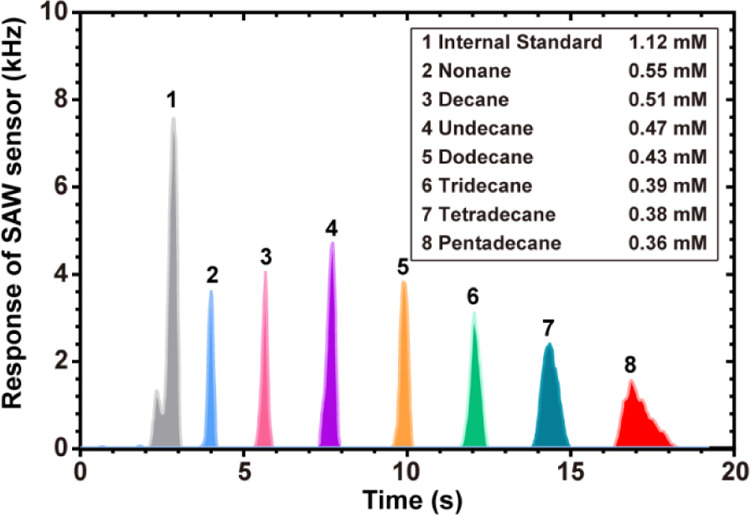
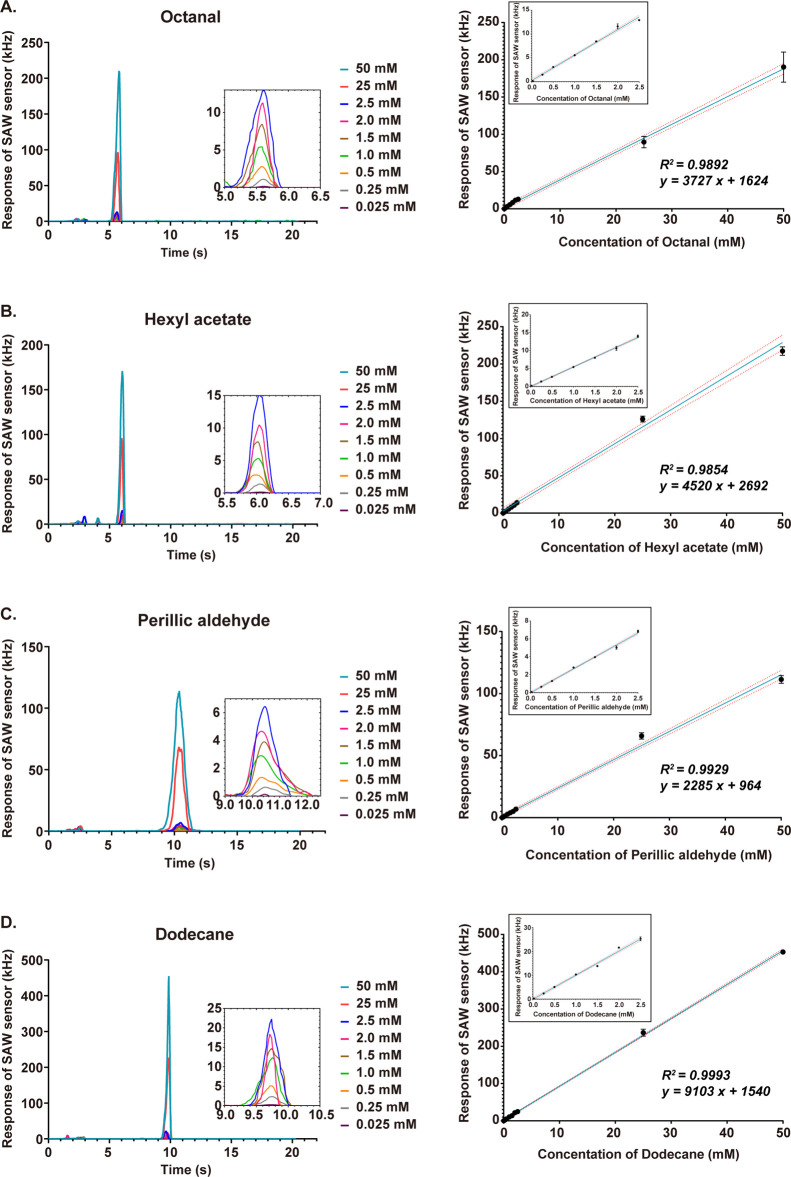
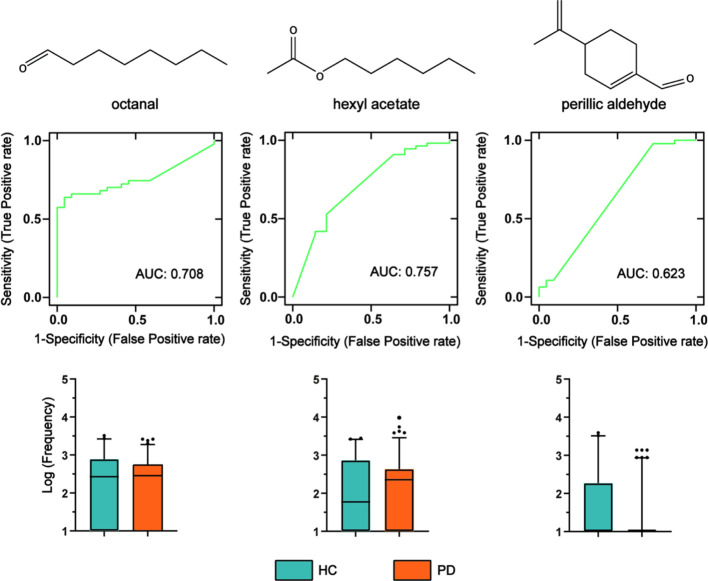
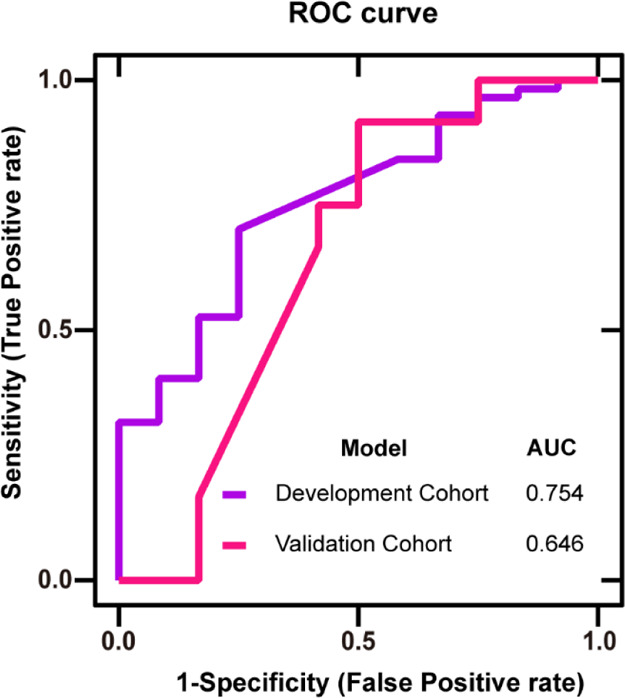
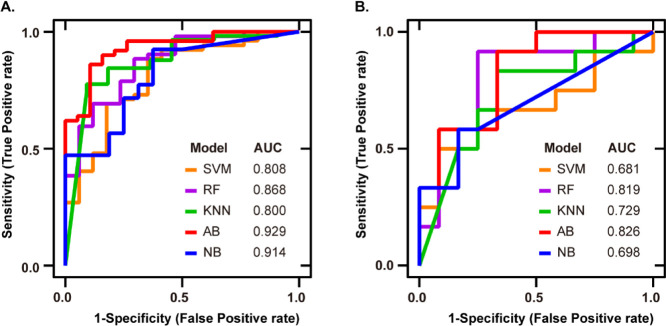
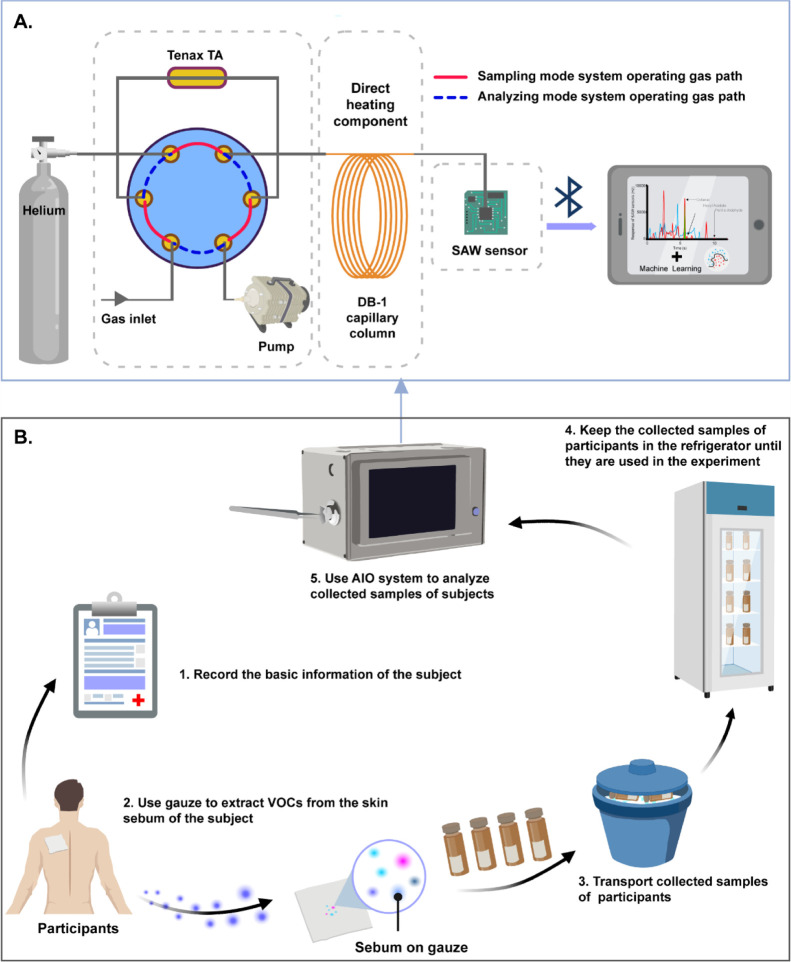
Background: Currently, Parkinson's disease (PD) diagnosis is mainly based on medical history and physical examination, and there is no objective and consistent basis. By the time of diagnosis, the disease would have progressed to the middle and late stages. Pilot studies have shown that a unique smell was present in the skin sebum of PD patients. This increases the possibility of a noninvasive diagnosis of PD using an odor profile. Methods: Fast gas chromatography (GC) combined with a surface acoustic wave sensor with embedded machine learning (ML) algorithms was proposed to establish an artificial intelligent olfactory (AIO) system for the diagnosis of Parkinson's through smell. Sebum samples of 43 PD patients and 44 healthy controls (HCs) from Fourth Affiliated Hospital of Zhejiang University School of Medicine, China, were smelled by the AIO system. Univariate and multivariate methods were used to identify the significant volatile organic compound (VOC) features in the chromatograms. ML algorithms, including support vector machine, random forest (RF), k nearest neighbor (KNN), AdaBoost (AB), and Naive Bayes (NB), were used to distinguish PD patients from HC based on the VOC peaks in the chromatograms of sebum samples. Results: VOC peaks with average retention times of 5.7, 6.0, and 10.6 s, respectively, corresponding to octanal, hexyl acetate, and perillic aldehyde, were significantly different in PD and HC. The accuracy of the classification based on the significant features was 70.8%. Based on the odor profile, the classification had the highest accuracy and F1 of the five models with 0.855 from NB and 0.846 from AB, respectively, in the process of model establishing. The highest specificity and sensitivity of the five classifiers were 91.6% from NB and 91.7% from RF and KNN, respectively, in the evaluating set. Conclusions: The proposed AIO system can be used to diagnose PD through the odor profile of sebum. Using the AIO system is helpful for the screening and diagnosis of PD and is conducive to further tracking and frequent monitoring of the PD treatment process.


Conflict of interest statement

The authors declare no competing financial interest.

Figures

Figure 1
Figure 1
Chromatographic frequency response curve of a mixed solution in the AIO system: peak 1 is the internal standard at a concentration of 1.12 mM; peaks 2, 3, 4, 5, 6, 7, and 8 are nonane, decane, undecane, dodecane, tridecane, tetradecane, and pentadecane, respectively, and all VOCs were diluted to parts per million of the original concentration.
Figure 2
Figure 2
Calibrations of AIO by different reagent concentrations of the gas phase (0.025, 0.25, 0.5, 1.0, 1.5, 2.0, 2.5, 25, and 50 mM): (A) responses of AIO to the concentrations of nine different samples of octanal and the detection spectra of different octanal concentrations in the gas phase; (B) responses of AIO to the concentrations of nine different samples of hexyl acetate and the detection spectra of different hexyl acetate concentrations in the gas phase; and (C) responses of AIO to the concentrations of nine different samples of perillic aldehyde and the detection spectra of different perillic aldehyde concentrations in the gas phase. (D) Responses of AIO to the concentrations of nine different samples of dodecane and the detection spectra of different dodecane concentrations in the gas phase. The linear correlation with red dashed lines represents the fitting with 95% confidence interval.
Figure 3
Figure 3
ROC curves and box plots of three biomarker features for the discovery cohort. The ROC curve comprehensively considers the characteristics of sensitivity and specificity. Box plots show a comparison of means of log scaled peak intensities of these analytes, where black dots are outliers. In the box plots, the green on the left represents HC, and the orange on the right represents PD patients.
Figure 4
Figure 4
ROC curve of the development cohort and validation cohort based on significant features: X-axis: false positive rate, Y-axis: true positive rate, purple line: development cohort, and pink line: validation cohort. The AUCs were 0.754 and 0.646, respectively.
Figure 5
Figure 5
ROC curve analysis to evaluate the performance of different classifier construction models. Each colored line represents the ROC curve of the Parkinson’s odor diagnosis model constructed by different classifiers: (A) development cohort: the ROC curve of the model. The AUCs of five classifiers (SVM, RF, KNN, AB, and NB) are 0.808, 0.868, 0.800, 0.929, and 0.914, respectively and (B) validation cohort: the ROC curve of the medical diagnostic tests. The AUCs of five classifiers are 0.681, 0.819, 0.729, 0.826, and 0.698, respectively.
Figure 6
Figure 6
(A) System design of the AIO system; solid red line: sampling mode system operating gas path; dotted blue line analyzing mode system operating gas path. (B) Process of clinical experiments: (1) basic information about the participants was recorded; (2) the gauze was placed on the participants’ back to extract the skin sebum VOCs, and then, the sample gauze was placed in a glass bottle with an inert brown background gas; (3) the bottles were transported in ice packs; (4) the samples were taken back to the laboratory and placed in the refrigerator; and (5) analytical experiments were carried out on the collected samples by the AIO system to obtain odor profiles (created with BioRender.com).

References

    1. Poewe W.; Seppi K.; Tanner C. M.; Halliday G. M.; Brundin P.; Volkmann J.; Schrag A.-E.; Lang A. E. Parkinson disease. Nat. Rev. Dis. Primers 2017, 3, 17013. 10.1038/nrdp.2017.13. - DOI - PubMed
    1. Savica R.; Rocca W. A.; Ahlskog J. E. When does Parkinson disease start?. Arch. Neurol. 2010, 67, 798–801. 10.1001/archneurol.2010.135. - DOI - PubMed
    1. Balestrino R.; Schapira A. H. V. Parkinson disease. Eur. J. Neurol. 2020, 27, 27–42. 10.1111/ene.14108. - DOI - PubMed
    1. von Campenhausen S.; Bornschein B.; Wick R.; Bötzel K.; Sampaio C.; Poewe W.; Oertel W.; Siebert U.; Berger K.; Dodel R. Prevalence and incidence of Parkinson’s disease in Europe. Eur. Neuropsychopharmacol. 2005, 15, 473–490. 10.1016/j.euroneuro.2005.04.007. - DOI - PubMed
    1. Marras C.; Beck J. C.; Bower J. H.; Roberts E.; Ritz B.; Ross G. W.; Abbott R. D.; Savica R.; Van Den Eeden S. K.; Willis A. W.; Tanner C. M. Prevalence of Parkinson’s disease across North America. npj Parkinson’s Dis. 2018, 4, 21. 10.1038/s41531-018-0058-0. - DOI - PMC - PubMed