

Effects of water quality on growth performance and health of nursery pigs
- PMID: 35155995
- PMCID: PMC8827558
- DOI: 10.1093/tas/txac002
Effects of water quality on growth performance and health of nursery pigs
Abstract
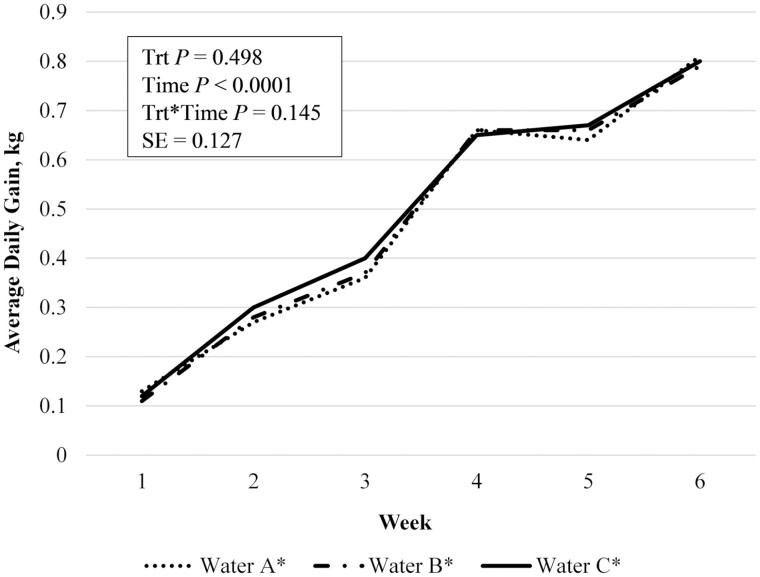
An experiment was conducted to determine the effects of providing drinking water of differing qualities on growth performance and health of nursery pigs. Weanling pigs (n = 450; 150 pigs/group; 10 pigs/pen) were assigned randomly to one of three experimental groups consisting of three water sources of varying qualities: 1) Water source A containing 1,410 ppm hardness (CaCO3 equivalent), 1,120 ppm sulfates, and 1,500 ppm total dissolved solids (TDS); 2) Water source B containing 909 ppm hardness (CaCO3 equivalent), 617 ppm sulfates, and 1,050 ppm TDS; and 3) Water source C containing 235 ppm hardness (CaCO3 equivalent), 2 ppm sulfates, and 348 ppm TDS. Pigs were provided ad libitum access to their respective water sources for the duration of the study which began at weaning (21 d of age) and ended 40 d later (61 d of age). Individual pig weights were recorded weekly along with feed intake on a pen basis. Occurrences of morbidity and mortality were recorded daily. Subjective fecal scores were assigned on a pen basis and blood samples were used to evaluate blood chemistry, cytokine concentrations, and phagocytic activity. A differential sugar absorption test was used to assess intestinal permeability. Fecal grab samples were used to establish diet digestibility, and drinking behavior was video-recorded to assess pigs' acceptance of water sources provided. The statistical model considered fixed effects of water source, room, and their interaction with the random effect of pen. A repeated measures analysis was conducted to determine the effects of water quality over time. There were no differences (P > 0.440) among water sources in average daily gain (A, 0.46 kg/d; B, 0.46 kg/d; C, 0.47 kg/d) or average daily feed intake (A, 0.68 kg/d; B, 0.69 kg/d; C, 0.71 kg/d). Overall mortality of pigs was 0.44% and did not differ across the three water sources. There were no differences in apparent total tract digestibility of the diet, intestinal permeability, immune parameters, or blood chemistry attributable to quality of water consumed by pigs. Pigs did not show an aversion to the water sources provided, because total time pigs spent at the drinker did not differ (P > 0.750) among water sources on days 1 through 3 of the experiment. These data indicate that the water sources of differing quality studied did not affect growth performance or health of nursery pigs.
Keywords: drinking behavior; growth performance; health; nursery pigs; water quality.
© The Author(s) 2022. Published by Oxford University Press on behalf of the American Society of Animal Science.
Figures


Similar articles
-
Total Dissolved Solids (TDS) Less than 1000 ppm in Drinking Water Did Not Impact Nursery Pig Performance.Vet Sci. 2022 Nov 8;9(11):622. doi: 10.3390/vetsci9110622. Vet Sci. 2022. PMID: 36356099 Free PMC article.
-
Water intake of pigs consuming tiamulin during the nursery phase.Transl Anim Sci. 2021 Feb 8;5(1):txab023. doi: 10.1093/tas/txab023. eCollection 2021 Jan. Transl Anim Sci. 2021. PMID: 33748686 Free PMC article.
-
The effect of creep feed composition and form on pre- and post-weaning growth performance of pigs and the utilization of low-complexity nursery diets.Transl Anim Sci. 2021 Nov 10;5(4):txab211. doi: 10.1093/tas/txab211. eCollection 2021 Oct. Transl Anim Sci. 2021. PMID: 34909601 Free PMC article.
-
Comparative efficacy of commercially available deoxynivalenol detoxifying feed additives on growth performance, total tract digestibility of components, and physiological responses in nursery pigs fed diets formulated with naturally contaminated corn.Transl Anim Sci. 2021 Mar 10;5(2):txab050. doi: 10.1093/tas/txab050. eCollection 2021 Apr. Transl Anim Sci. 2021. PMID: 34085027 Free PMC article.
-
Wean-to-finish feeder space availability effects on nursery and finishing pig performance and total tract digestibility in a commercial setting when feeding dried distillers grains with solubles.J Anim Sci. 2015 Apr;93(4):1905-15. doi: 10.2527/jas.2014-8136. J Anim Sci. 2015. PMID: 26020213
Cited by
-
Total Dissolved Solids (TDS) Less than 1000 ppm in Drinking Water Did Not Impact Nursery Pig Performance.Vet Sci. 2022 Nov 8;9(11):622. doi: 10.3390/vetsci9110622. Vet Sci. 2022. PMID: 36356099 Free PMC article.
-
Impact of water flow rate on finishing pig performance.Transl Anim Sci. 2022 Sep 1;6(3):txac125. doi: 10.1093/tas/txac125. eCollection 2022 Jul. Transl Anim Sci. 2022. PMID: 36172459 Free PMC article.
References
-
- Adeola, O. 2001. Digestion and balance techniques in pigs. In: Lewis A. J. and Souther L. L., editors, Swine nutrition, 2nd ed. CRC Press, Boca Raton, FL. p. 903.– .
-
- Anderson, J. S., Anderson D. M., and Murphy J. M.. . 1994. The effect of water quality on nutrient availability for grower/finisher pigs. Can. J. Anim. Sci. 74:141–148. doi: 10.4141/cjas94-021 - DOI
-
- AOAC International. 2006. Official methods of analysis of AOAC International. 18th ed. AOAC Int., Arlington, VA.
-
- Cornelius, C. E. 1980. Liver function. In: Kaneko J. J., editor. Clinical biochemistry of domestic animals. 3rd ed. Academic Press, New York, NY. p. 201–250.
-
- Canadian Council of Ministers of the Environment (CCME). 1987. Canadian Water Quality Guidelines. Available upon request from Environment and Climate Change Canada, https://www.canada.ca/en/environment-climate-change.html.
LinkOut - more resources
Full Text Sources