. 2022 Jul;112(1):81-89.
doi: 10.1002/cpt.2561. Epub 2022 Mar 20.

In Vivo Cellular Expansion of Lisocabtagene Maraleucel and Association With Efficacy and Safety in Relapsed/Refractory Large B-Cell Lymphoma

Affiliations

In Vivo Cellular Expansion of Lisocabtagene Maraleucel and Association With Efficacy and Safety in Relapsed/Refractory Large B-Cell Lymphoma

Ken Ogasawara et al. Clin Pharmacol Ther. 2022 Jul.

Abstract

Lisocabtagene maraleucel (liso-cel) is an autologous, CD19-directed, chimeric antigen receptor T-cell product for the treatment of adult patients with relapsed or refractory large B-cell lymphoma (LBCL) after 2 or more lines of systemic therapy. In vivo cellular expansion after single-dose administration of liso-cel has been characterized. In this article, in vivo liso-cel expansion in the pivotal study TRANSCEND NHL 001 (ClinicalTrials.gov identifier, NCT02631044) was further characterized to assess the relationship between in vivo cellular expansion after single-dose administration of liso-cel and efficacy or safety after adjusting for key baseline characteristics. Two bioanalytical methods, quantitative polymerase chain reaction and flow cytometry, were used for the assessment of cellular kinetics of liso-cel, which showed high concordance for in vivo cellular expansion. Multivariable logistic regression analyses demonstrated that higher in vivo cellular expansion of liso-cel was associated with a higher overall response and complete response rate, and a higher incidence of cytokine release syndrome and neurological events in patients with relapsed or refractory LBCL. Age and tumor burden (by sum of the product of perpendicular diameters) were likely to confound the relationship between in vivo cellular expansion and efficacy, where the association became stronger after controlling for these factors. Repeat dosing of liso-cel was tested in the study; however, in vivo cellular expansion of liso-cel was lower after repeat dosing than after the initial dose. These findings should enable a comprehensive understanding of the in vivo cellular kinetics of liso-cel and the association with outcomes in relapsed/refractory LBCL.


Conflict of interest statement

K.O., J.L., T.M., J.D., C.H., J.S., L.P., and A.K. are employees of Bristol Myers Squibb and hold stock in Bristol Myers Squibb.

Figures

Figure 1
Figure 1
Median (Q1, Q3) transgene (qPCR) and EGFRt+ T cell (flow cytometry) over time in patients with relapsed or refractory large B‐cell lymphoma. EGFRt, truncated epidermal growth factor receptor; Q1, first quartile; Q3, third quartile; qPCR, quantitative polymerase chain reaction.
Figure 2
Figure 2
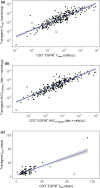
Correlation of in vivo cellular expansion parameters between transgene (qPCR) and CD3+ EGFRt+ T cells (flow cytometry): Cmax (a), AUC0–28 days (b), and tmax (c). AUC0–28 days, area under the curve from 0 to 28 days post‐infusion; Cmax, maximum expansion; EGFRt, truncated epidermal growth factor receptor; qPCR, quantitative polymerase chain reaction; tmax, time to maximum expansion. Black lines and gray areas denote regression lines and the 95% confidence intervals [Colour figure can be viewed at wileyonlinelibrary.com].
Figure 3
Figure 3
Relationship between Cmax (qPCR) and probability of efficacy or safety outcomes by a certain covariate controlling for other covariates: overall response (CR or PR) by pre‐LDC SPD ≥ 50 cm2 vs. < 50 cm2 in patients < 65 years (a) and by age ≥ 65 years vs. < 65 years in patients with pre‐LDC SPD < 50 cm2 (b); CR by pre‐LDC SPD ≥ 50 cm2 vs. < 50 cm2 in patients < 65 years who received bridging therapy (c), by age ≥ 65 years vs. < 65 years in patients with pre‐LDC SPD < 50 cm2 who received bridging therapy (d), and by bridging therapy in patients < 65 years with pre‐LDC SPD < 50 cm2 (e); any‐grade CRS by CRP ≥ 20 mg/L vs. < 20 mg/L in patients with refractory LBCL and pre‐LDC LDH < 500 U/L who received bridging therapy (f), by pre‐LDC LDH ≥ 500 U/L vs. < 500 U/L in patients with refractory LBCL and CRP ≥ 20 mg/L who received bridging therapy (g), by relapsed vs. refractory LBCL in patients with CRP ≥ 20 mg/L and pre‐LDC LDH < 500 U/L who received bridging therapy (h), and by bridging therapy in patients with refractory LBCL, CRP ≥ 20 mg/L, and pre‐LDC LDH < 500 U/L (i); any‐grade NE by CRP ≥ 20 mg/L vs. < 20 mg/L in all evaluable patients (j); and grade ≥ 3 NE by CRP ≥ 20 mg/L vs. < 20 mg/L in all evaluable patients (k). Lines indicate logistic regression curve and 95% confidence bands. Closed circles and vertical error bars indicate observed proportion and the 95% confidence intervals in tertiles of Cmax (qPCR) for each subgroup. On the y‐axis, 1 and 0 indicate yes and no, respectively. Cmax, maximum expansion; CR, complete response; CRP, C‐reactive protein; CRS, cytokine release syndrome; LBCL, large B‐cell lymphoma; LDC, lymphodepleting chemotherapy; LDH, lactate dehydrogenase; NE, neurological event; PR, partial response; qPCR, quantitative polymerase chain reaction; SPD, sum of the product of perpendicular diameters.
Figure 4
Figure 4
Comparison of in vivo cellular expansion parameters (qPCR) after the first dose with those after second dose at dose level 1 as a 2‐dose schedule: Cmax (a) and tmax (b). Cmax, maximum expansion; qPCR, quantitative polymerase chain reaction; tmax, time to maximum expansion.
Figure 5
Figure 5
Comparison of in vivo cellular expansion parameters (qPCR) after the first dose with those after re‐treatmenta: Cmax (a), AUC0–28 days (b), and tmax (c). aPatients who experienced progressive disease after achieving a CR were eligible for re‐treatment with liso‐cel if additional doses were available. AUC0–28 days, area under the curve from 0 to 28 days post‐infusion; Cmax, maximum expansion; CR, complete response; liso‐cel, lisocabtagene maraleucel; qPCR, quantitative polymerase chain reaction; tmax, time to maximum expansion.
Figure 6
Figure 6
Comparison of in vivo cellular expansion parameters (qPCR) in patients who received liso‐cel with patients who received nonconforming producta: Cmax (a), AUC0–28 days (b), and tmax (c). a Nonconforming product was defined as any product wherein one of the CD8+ or CD4+ cell components did not one of the requirements to be considered liso‐cel. AUC0–28 days, area under the curve from 0 to 28 days post‐infusion; Cmax, maximum expansion; liso‐cel, lisocabtagene maraleucel; qPCR, quantitative polymerase chain reaction; tmax, time to maximum expansion.

Comment in

References

    1. Pagel, J.M. & West, H.J. Chimeric antigen receptor (CAR) T‐cell therapy. JAMA Oncol. 3, 1595 (2017). - PubMed
    1. Turtle, C.J. Chimeric antigen receptor modified T cell therapy for B cell malignancies. Int. J. Hematol. 99, 132–140 (2014). - PubMed
    1. Turtle, C.J. , Riddell, S.R. & Maloney, D.G. CD19‐targeted chimeric antigen receptor‐modified T‐cell immunotherapy for B‐cell malignancies. Clin. Pharmacol. Ther. 100, 252–258 (2016). - PubMed
    1. Holstein, S.A. & Lunning, M.A. CAR T‐cell therapy in hematologic malignancies: a voyage in progress. Clin. Pharmacol. Ther. 107, 112–122 (2020). - PubMed
    1. Benmebarek, M.R. , Karches, C.H. , Cadilha, B.L. , Lesch, S. , Endres, S. & Kobold, S. Killing mechanisms of chimeric antigen receptor (CAR) T cells. Int. J. Mol. Sci. 20, 1283 (2019). - PMC - PubMed

Publication types

Associated data