. 2022 May;596(9):1111-1123.
doi: 10.1002/1873-3468.14314. Epub 2022 Feb 21.

Mitochondrial energy metabolism regulates the nutrient import activity and endocytosis of APC transporters

Affiliations

Mitochondrial energy metabolism regulates the nutrient import activity and endocytosis of APC transporters

Akshay Moharir et al. FEBS Lett. 2022 May.

Abstract

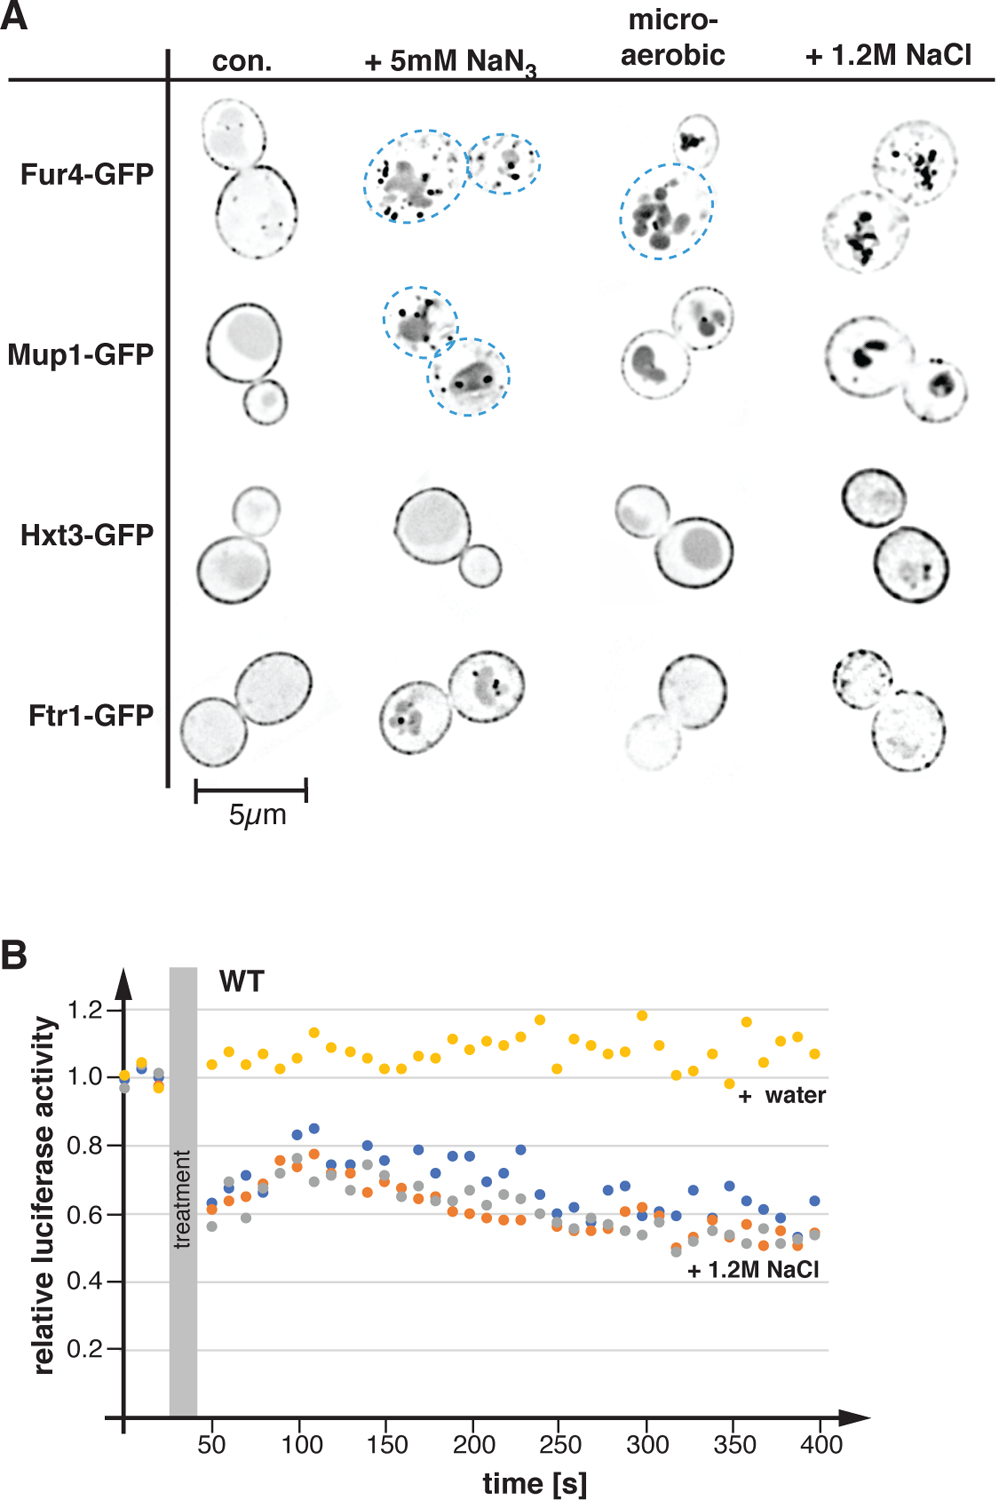
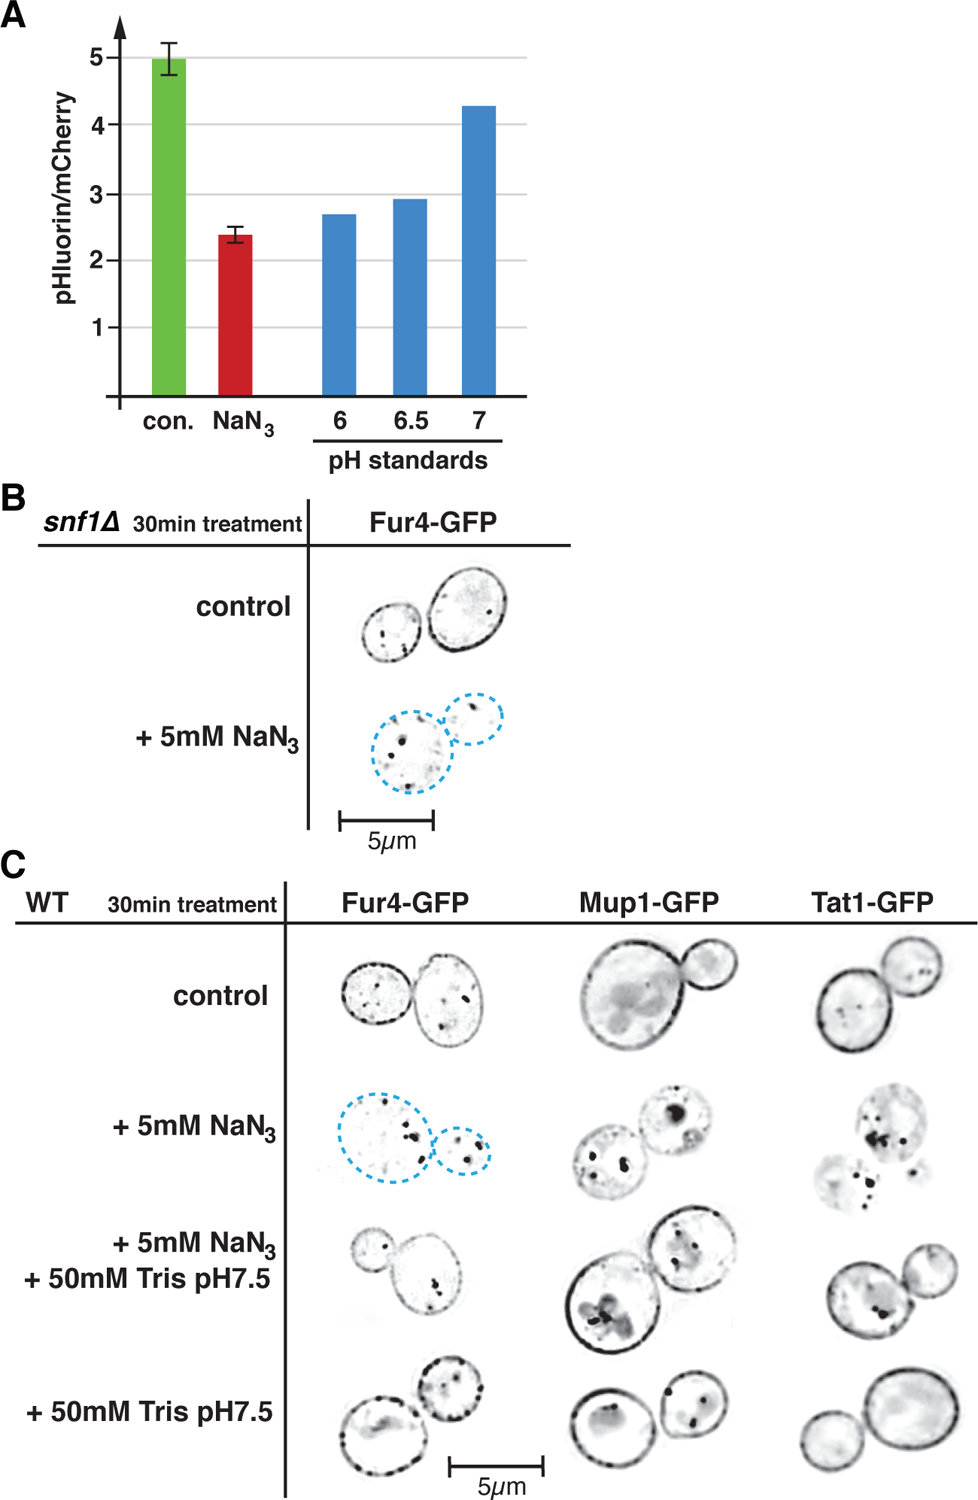
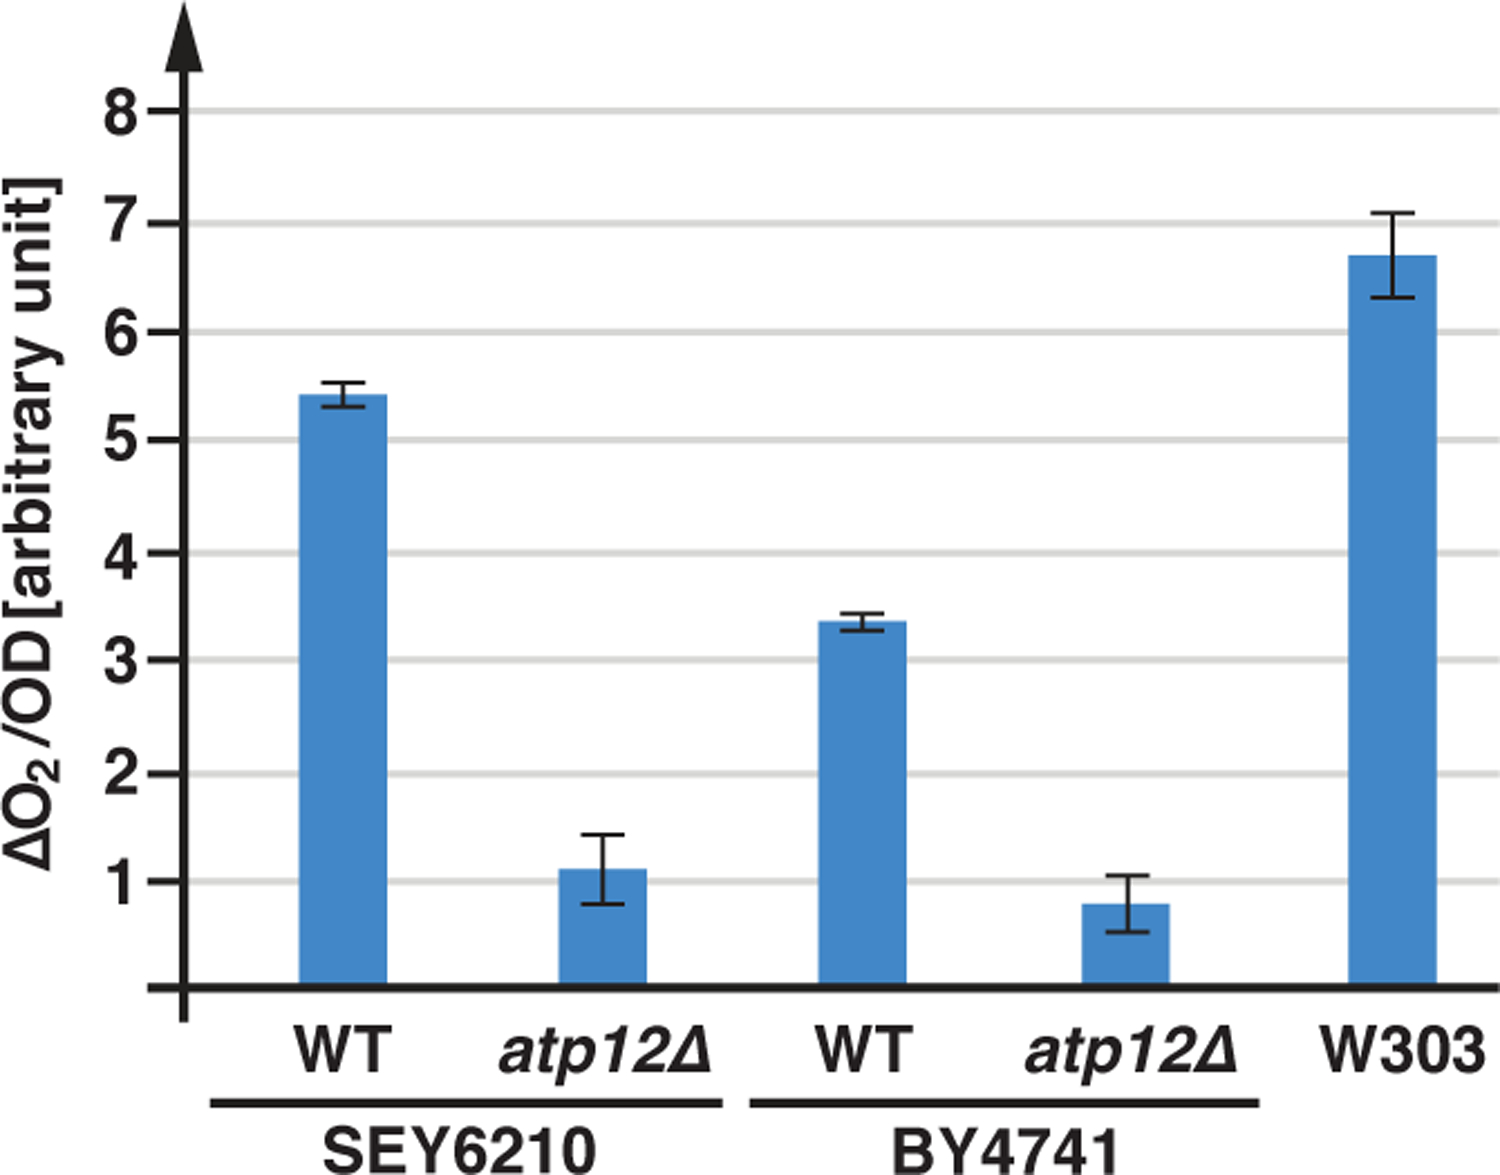
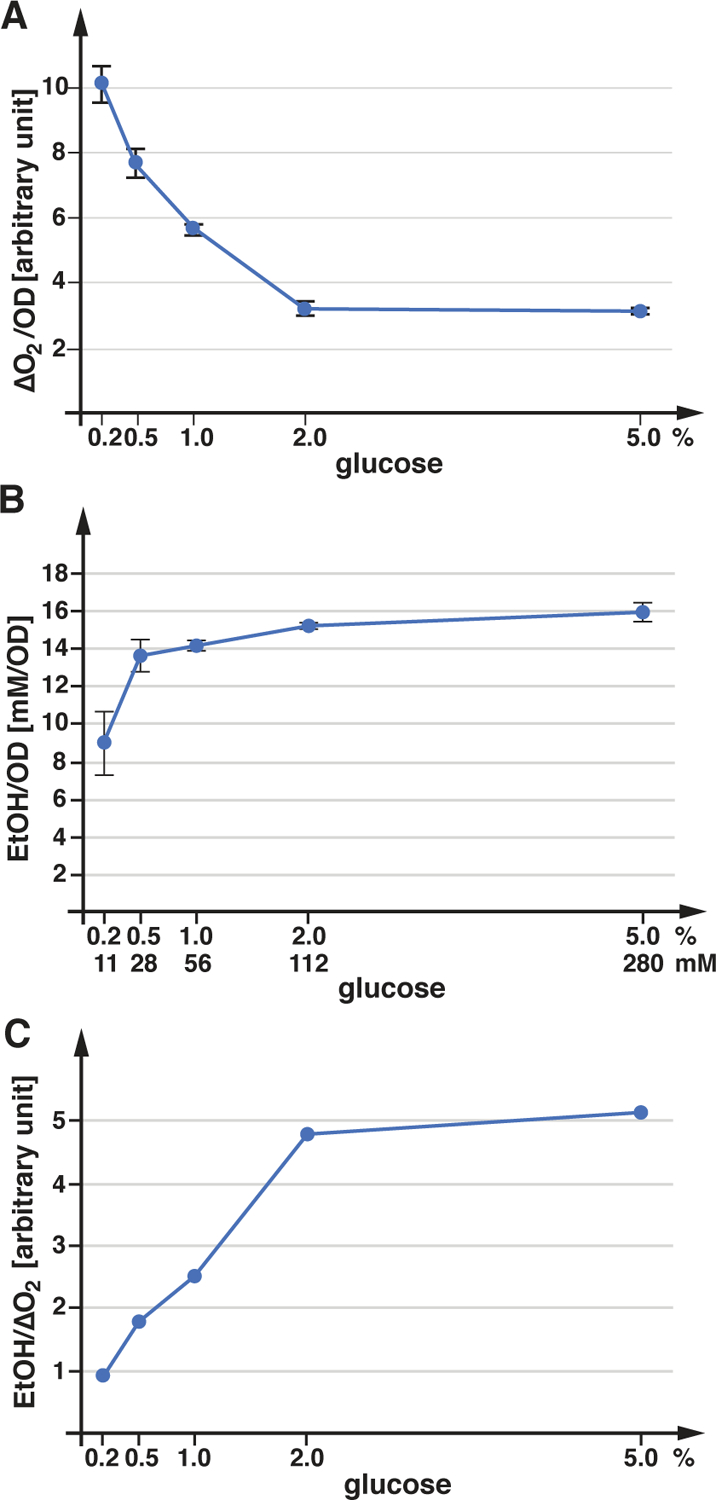
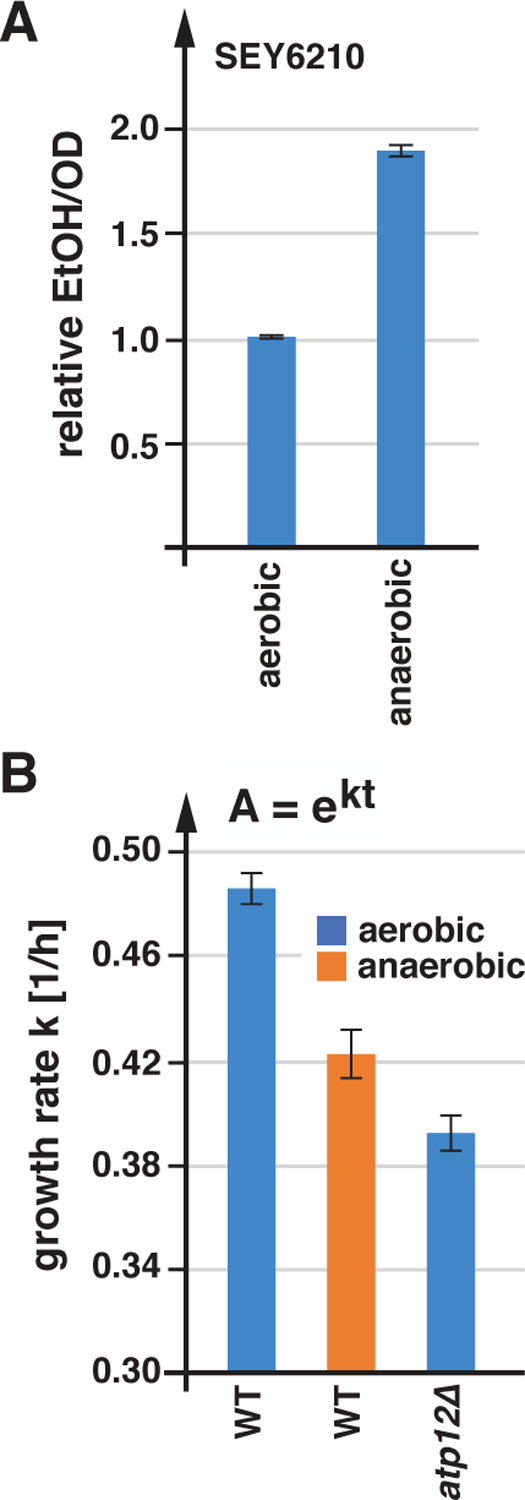
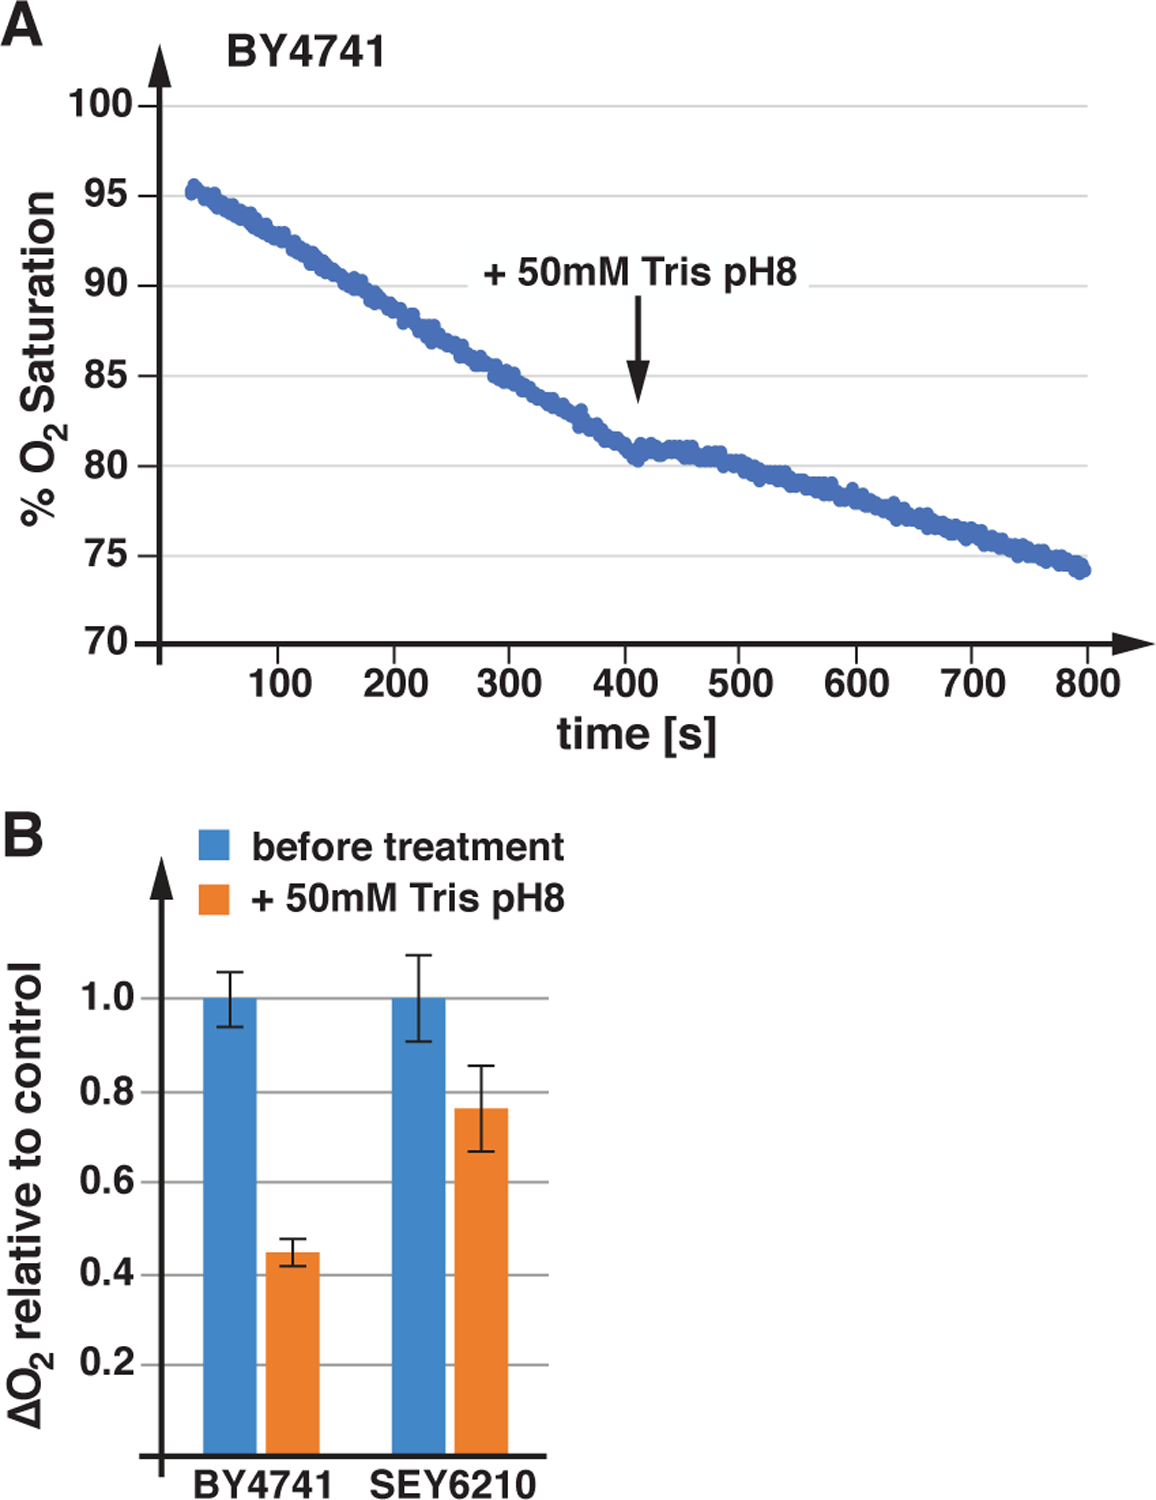
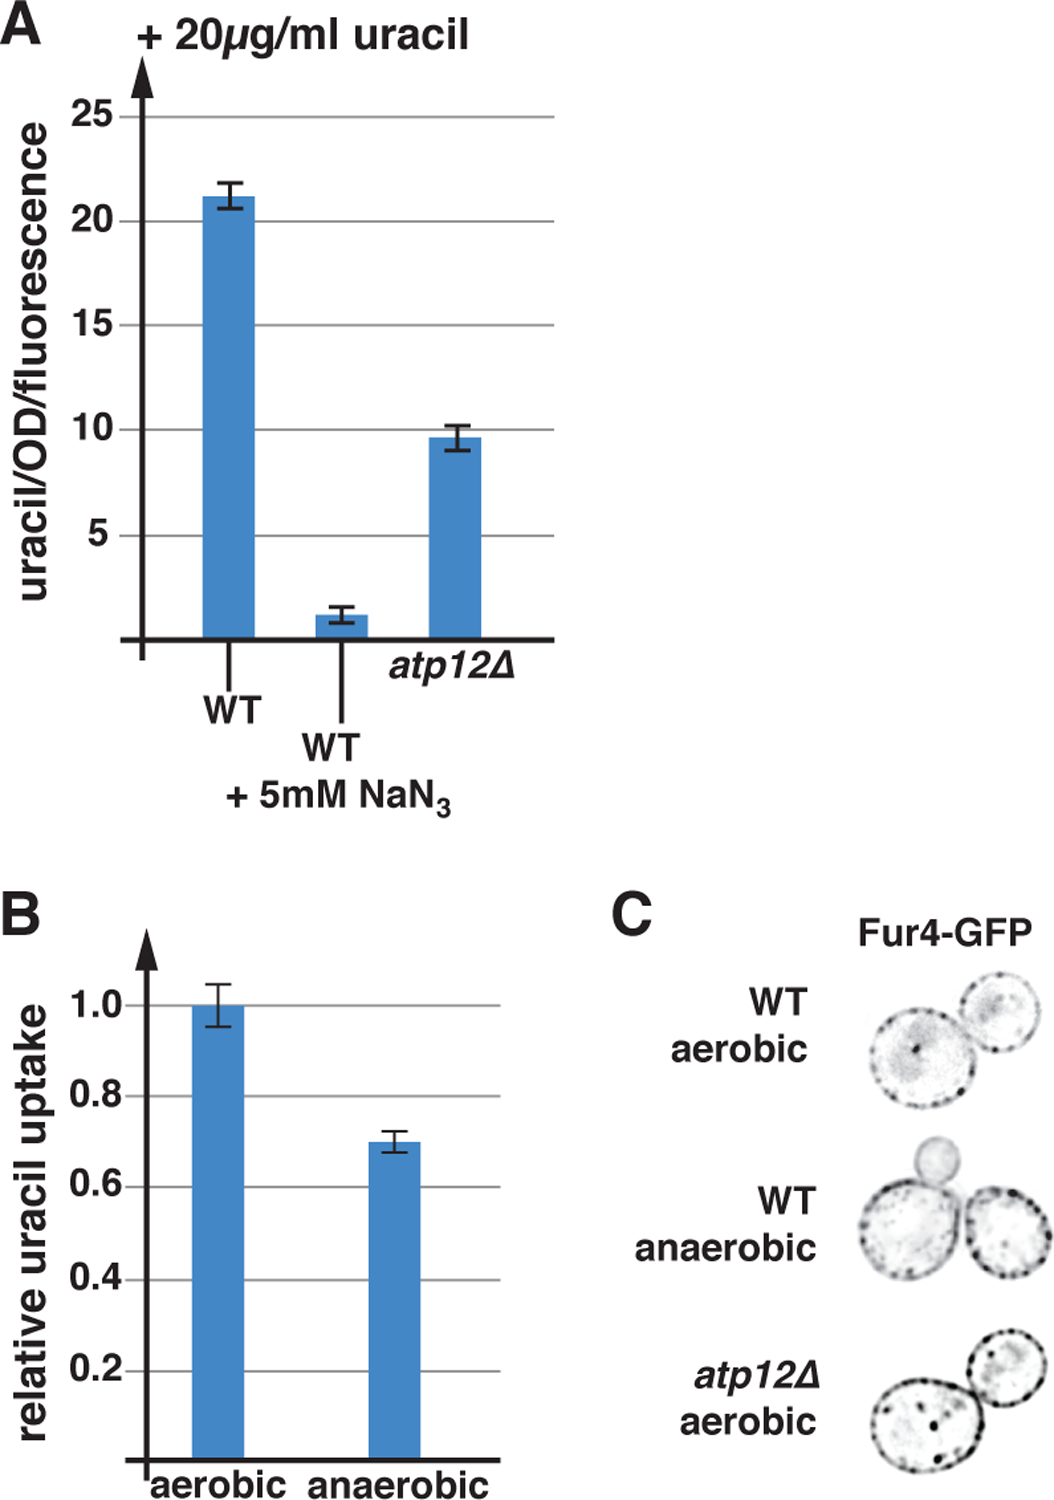
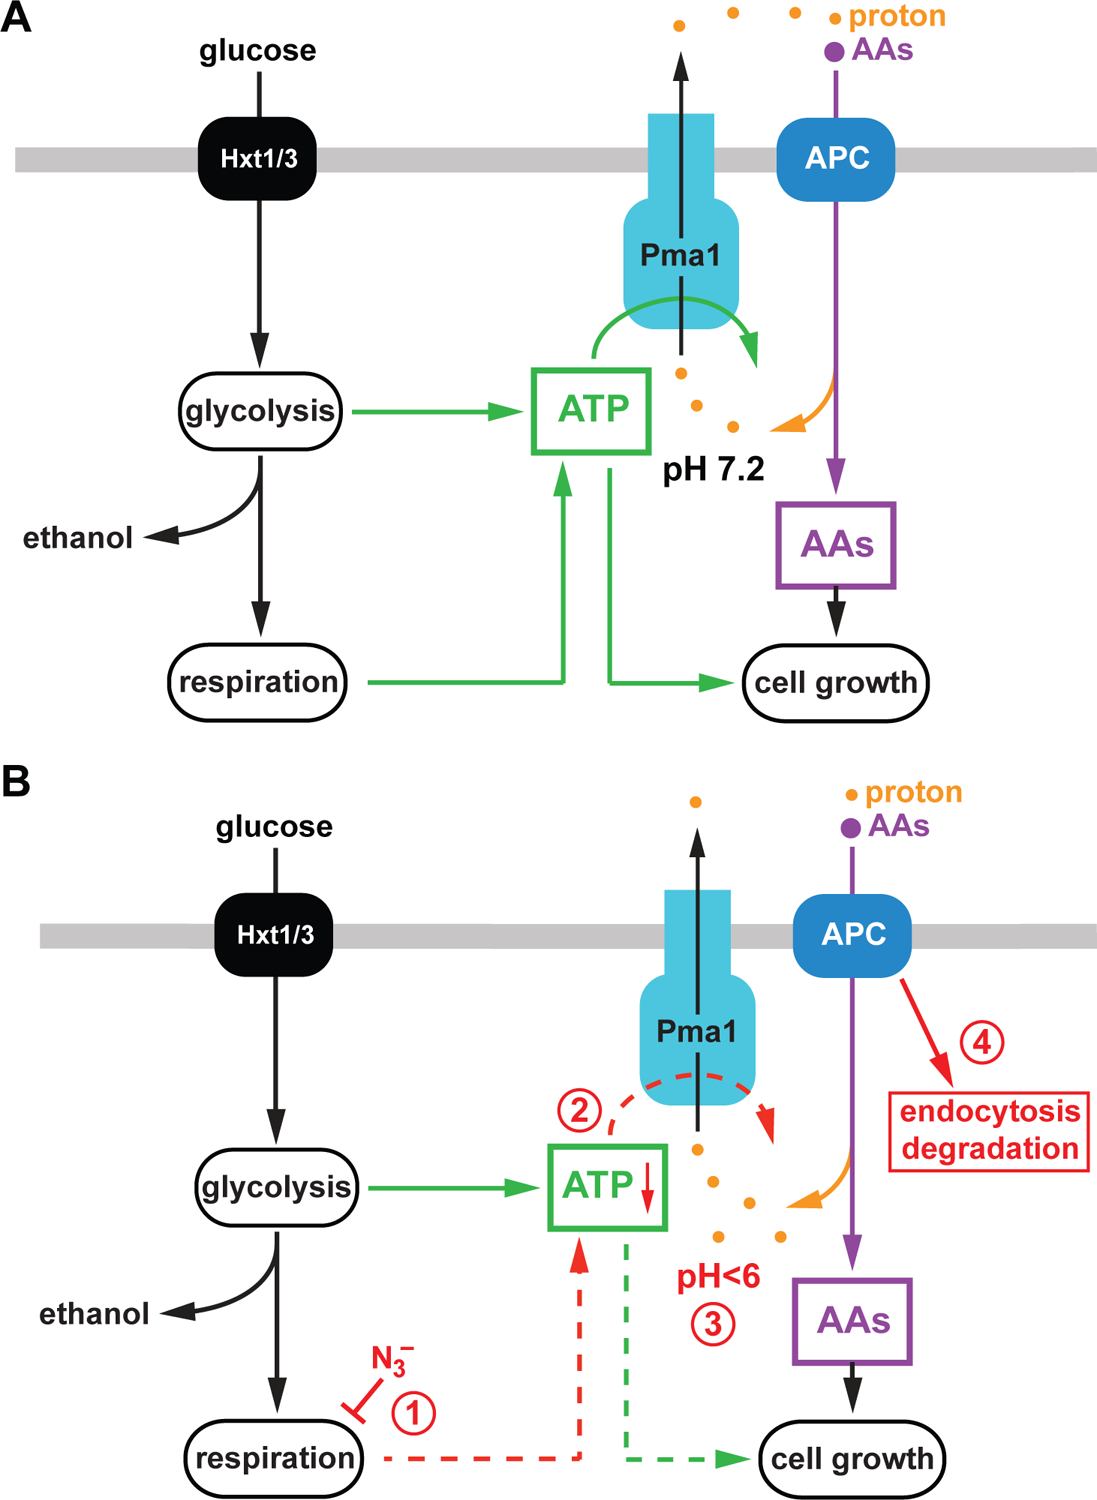
Nutrient import by APC-type transporters is predicted to have a high energy demand because it depends on the plasma membrane proton gradient established by the ATP-driven proton pump Pma1. We show that Pma1 is indeed a major energy consumer and its activity is tightly linked to the cellular ATP levels. The low Pma1 activity caused by acute loss of respiration resulted in a dramatic drop in cytoplasmic pH, which triggered the downregulation of the major proton importers, the APC transporters. This regulatory system is likely the reason for the observed rapid endocytosis of APC transporters during many environmental stresses. Furthermore, we show the importance of respiration in providing ATP to maintain a strong proton gradient for efficient nutrient uptake.

Keywords: membrane trafficking; nutrient import; respiration.


Figures

Figure 1.
Figure 1.
Stress conditions affect ATP levels and the localization of APC transporters. A) Yeast strains were grown in SDcom, SDcom-ura or SDcom-leu-met medium to mid-log phase, treated for 1h as indicated and analyzed by fluorescence microscopy (con.: control before treatment). The pictures show one optical section from the middle of the cell. The pictures were inverted for better visualization of the GFP signal (GFP signal is shown in black). Blue dashed line indicates the cell outline where surface expression of the GFP-tagged protein is low. The following strains were used: Fur4-GFP (SEY6210 pJK19), Mup1-GFP (SEY6210 pPL4146), Hxt3-GFP (DLY050), Ftr1-GFP (CBY118). B) The cellular ATP levels of BY4741 pMB522 (WT) grown in SDcom-ura medium were determined by a luciferase assay. The values of the luciferase activity were standardized relative to starting conditions. For the treatment, NaCl (5M stock solution, 1.2M final concentration; orange, grey and blue data points) or equal volume water (yellow data point) was added.
Figure 2.
Figure 2.
Loss of respiration causes low cytoplasmic pH which triggers APC transporter downregulation. A) Azide induced changes in cytoplasmic pH were determined by measuring the ratio of pHluorin to mCherry fluorescence of cells expressing a pHluorin-mCherry fusion protein (SEY6210 pMB517). The green column shows the ratio before treatment (con.), the red column shows the ratio 2min after addition of 5mM NaN3. Using the same culture, the pH standards were determined by resuspending the cells in 1M buffer solution (pH6 MES, pH6.5 MES, pH7 Tris) in presence of 5mM NaN3 and 5mM NaF (blocks ATP production and thus collapses all proton gradients). Each data point represents the median of 150,000 cells (analyzed by flow cytometry). The control and azide treated samples were measured in triplicates. B) Fluorescence microscopy of snf1Δ (AMY20 pJK19) expressing Fur4-GFP (optical section through the middle of the cell). The cells were analyzed after 30min of azide treatment. Black represents GFP signal, dashed blue lines mark the outlines of the cells with no Fur4-GFP surface signal. C) Wild type cells expressing GFP-tagged APC transporters (SEY6210 pJK19, SEY6210 pPL4146, QAY1055) were analyzed by fluorescence microscopy as described in B.
Figure 3.
Figure 3.
Respiration of lab strains. Wild-type and atp12Δ (AMY36, YJL180C) strains were grown in YPD to a density of OD600=0.7–1.0 and oxygen consumption was measured using a Clark electrode. The data were standardized by the cell density (OD). The graphs show the average and standard deviation of 3 measurements (based on t-test analysis, all discussed differences are statistically relevant with p<0.05).
Figure 4.
Figure 4.
Energy metabolism of SEY6210. The graphs in A and B show the average and standard deviation of 3 measurements. A) SEY6210 was grown in SDcom containing the indicated glucose concentrations (concentration of the starting growth medium) and oxygen consumption was determined. B) SEY6210 was grown in SDcom in presence of various glucose concentrations. The ethanol concentrations present in the growth medium was quantified by GC-MS and standardized by the cell density. C) Ratio of ethanol concentration to oxygen consumption, using the data sets from A and B.
Figure 5.
Figure 5.
Anaerobically grown cells show increased fermentation and decreased growth rates. A) Ethanol concentrations of SEY6210 grown in SDcom either aerobically or anaerobically were measured by GC-MS. The data were standardized to the cell density and represented relative to the measurements of the aerobically grown cells (n=3; standard deviation). B) Growth rates of SEY6210 strains growing in SDcom medium either aerobically or anaerobically. The data represent the average and standard deviation of the growth rates of 3 cultures.
Figure 6.
Figure 6.
Loss of plasma membrane proton gradient lowers respiration rates. A) Drop in oxygen saturation of the growth medium containing wild type (BY4741), before and after Tris treatment. B) The bar graph indicates the average and standard deviation of three oxygen consumption measurements performed before and after Tris pH8 addition (as shown in A).
Figure 7.
Figure 7.
Respiration plays an important role in nutrient import. A) For the uracil uptake assays the strains were grown in SDcom-ura medium. The following strains were used for these experiments: WT (SEY6210 pJK88), atp12Δ (AMY36 pJK88) (n=3). B) Relative uracil uptake of wild-type (SEY6210 pJK88) grown under aerobic or anaerobic conditions (n=3). C) Fluorescence microscopy of yeast strains grown in SDcom-ura expressing Fur4-GFP (single cross section). The imaged strains are: WT (SEY6210 pJK19), atp12Δ (AMY36 pJK19).
Figure 8.
Figure 8.
Model of the link between the APC transporter system and the metabolic state of yeast. A) The APC transporters require a strong plasma membrane proton gradient for their function, which is maintained by the ATP-dependent proton pump Pma1. ATP required for Pma1 activity is synthesized by mitochondrial oxidative phosphorylation (respiration) and glycolysis/fermentation. High levels of amino acids (AAs) and ATP support the fast growth rates of yeast. B) The presence of azide blocks respiration (1), which causes in a drop of ATP levels (2). The resulting decrease of Pma1 activity lowers the cytoplasmic pH (3) which serves as a signal to induce endocytosis and degradation of APC transporters (4).

Similar articles

Cited by

References

    1. Appadurai D, Gay L, Moharir A, Lang MJ, Duncan MC, Schmidt O, Teis D, Vu TN, Silva M, Jorgensen EM, et al. (2020). Plasma membrane tension regulates eisosome structure and function. Mol Biol Cell 31, 287–303. - PMC - PubMed
    1. Babst M (2014). Quality control: quality control at the plasma membrane: one mechanism does not fit all. J Cell Biol 205, 11–20. - PMC - PubMed
    1. Becuwe M, and Leon S (2014). Integrated control of transporter endocytosis and recycling by the arrestin-related protein Rod1 and the ubiquitin ligase Rsp5. eLife 3. - PMC - PubMed
    1. Becuwe M, Vieira N, Lara D, Gomes-Rezende J, Soares-Cunha C, Casal M, Haguenauer-Tsapis R, Vincent O, Paiva S, and Leon S (2012). A molecular switch on an arrestin-like protein relays glucose signaling to transporter endocytosis. J Cell Biol 196, 247–259. - PMC - PubMed
    1. Bultynck G, Heath VL, Majeed AP, Galan JM, Haguenauer-Tsapis R, and Cyert MS (2006). Slm1 and slm2 are novel substrates of the calcineurin phosphatase required for heat stress-induced endocytosis of the yeast uracil permease. Mol Cell Biol 26, 4729–4745. - PMC - PubMed

Publication types

MeSH terms