

RNA sensing via the RIG-I-like receptor LGP2 is essential for the induction of a type I IFN response in ADAR1 deficiency
- PMID: 35156720
- PMCID: PMC8922249
- DOI: 10.15252/embj.2021109760
RNA sensing via the RIG-I-like receptor LGP2 is essential for the induction of a type I IFN response in ADAR1 deficiency
Abstract
RNA editing by the adenosine deaminase ADAR1 prevents innate immune responses to endogenous RNAs. In ADAR1-deficient cells, unedited self RNAs form base-paired structures that resemble viral RNAs and inadvertently activate the cytosolic RIG-I-like receptor (RLR) MDA5, leading to an antiviral type I interferon (IFN) response. Mutations in ADAR1 cause Aicardi-Goutières Syndrome (AGS), an autoinflammatory syndrome characterized by chronic type I IFN production. Conversely, ADAR1 loss and the consequent type I IFN production restricts tumor growth and potentiates the activity of some chemotherapeutics. Here, we show that another RIG-I-like receptor, LGP2, also has an essential role in the induction of a type I IFN response in ADAR1-deficient human cells. This requires the canonical function of LGP2 as an RNA sensor and facilitator of MDA5-dependent signaling. Furthermore, we show that the sensitivity of tumor cells to ADAR1 loss requires LGP2 expression. Finally, type I IFN induction in tumor cells depleted of ADAR1 and treated with some chemotherapeutics fully depends on LGP2 expression. These findings highlight a central role for LGP2 in self RNA sensing with important clinical implications.
Keywords: RIG-I-like receptor family; RNA editing; autoinflammation; innate immunity; type I interferon.
© 2022 The Authors. Published under the terms of the CC BY 4.0 license.
Figures

THP‐1 monocytes were genetically engineered to knockout RIG‐I, MDA5, or LGP2 using CRISPR/Cas9. Cells were differentiated toward macrophage‐like cells using PMA and treated with recombinant type I IFN to upregulate RLR expression. Correct gene editing and intact type I IFN responsiveness were validated by SDS‐PAGE and immunoblotting using the indicated antibodies (n = 3). *, nonspecific band.
Cells generated in (A) were differentiated using PMA and transfected with a control siRNA (siCtrl) or an ADAR1‐targeting siRNA (siADAR1). The type I IFN response was monitored 56 h post‐transfection by RT‐qPCR analysis to determine IFN‐β and IFIT1 transcript expression, normalized to a housekeeping gene (ACTB). ADAR1 knockdown efficiency was monitored by ADAR1 p110 expression, normalized to ACTB, and displayed relative to siCtrl. Data are means ± s.d. from a representative of three biological replicate experiments.
Primary human monocyte‐derived macrophages were transfected with the indicated siRNAs. Cells were harvested 96 h post‐transfection and RT‐qPCR analysis was used to monitor the type I IFN response (IFN‐β, IFIT1, and ISG15 transcripts) and knockdown efficiency of ADAR1 and LGP2 (DHX58). All transcripts were normalized to ACTB. Data from two independent donors (denoted with distinct symbols) are shown with mean ± s.d.
HEK293 cells were genetically engineered to knockout RIG‐I, MDA5, or both, and subsequently subjected to retroviral transduction to stably express FLAG‐LGP2 or an empty vector (EV). Correct gene editing and intact type I IFN responsiveness were validated by SDS‐PAGE and immunoblotting using the indicated antibodies (n = 2). *, nonspecific band.
Cells generated in (D) were transfected with siCtrl or siADAR1. The type I IFN response and ADAR1 knockdown efficiency were monitored 78 h post‐transfection as in (B). Data are means ± s.d. from a representative of four biological replicate experiments.
Cells generated in (D) were transfected with siCtrl (siC) or siADAR1 (siA). Protein lysates were prepared 78 h post‐transfection, followed by SDS‐PAGE and immunoblotting using the indicated antibodies (n = 2).
HEK293 WT cells and FLAG‐LGP2‐expressing HEK293 cells were transfected with siCtrl or siADAR1 and subsequently plated on coverslips for immunofluorescence microscopy. Cells were fixed, permeabilized, and stained 72 h post‐transfection with anti‐FLAG (red) and anti‐IRF3 (green) antibodies. Nuclei were stained with DAPI (blue). Scale bar is 50 μm. Total nuclei (> 450 nuclei per experimental condition) and IRF3‐positive nuclei were counted using semi‐automated software analysis and plotted as percentage IRF3‐positive nuclei of total nuclei per field of view (a representative of three biological replicate experiments is quantified). The boxplot indicates the interquartile range as a box, the median as a central line, and the whiskers extend from the minimum to the maximum value. Statistical analyses were performed using unpaired two‐tailed Mann–Whitney U tests. ns, not significant; ****P < 0.0001.

PMA‐differentiated THP‐1 WT, RIG‐I‐, MDA5‐, and LGP2‐knockout cells were transfected with siCtrl (siC) or siADAR1 (siA). Protein lysates were prepared 56 h post‐transfection and ADAR1 knockdown efficiency was monitored by immunoblot analysis. Data correspond to the biological replicate shown in Fig 1B.
Expression level and type I IFN inducibility of relevant proteins in HEK293 and THP‐1. HEK293 and PMA‐differentiated THP‐1 cells were treated with or without recombinant type I IFN. Protein lysates were analyzed by SDS‐PAGE followed by immunoblotting with the indicated antibodies (n = 3). *, nonspecific band.
Kinetics of siRNA‐mediated depletion of ADAR1 and induction of the type I IFN response in HEK293. HEK293 cells stably expressing FLAG‐LGP2 were transfected with an siRNA targeting ADAR1 (siADAR1) and harvested at the indicated time points post‐transfection. ADAR1 knockdown and IFIT1 upregulation were monitored by RT‐qPCR analysis (using Taqman probes) and normalized to ACTB. Data are means ± s.d. from one experiment.
HEK293 WT cells were transfected with siADAR1 or a control siRNA (siCtrl) and 8 h later with increasing amounts of a vector encoding FLAG‐LGP2. As a control, cells were transfected with 250 ng of an empty vector (EV). Cells were harvested 80 h post siRNA transfection. RT‐qPCR analysis was used to monitor IFN‐β and IFIT1 expression, ADAR1 knockdown, and LGP2 (DHX58) expression. All transcripts were normalized to ACTB. Data are means ± s.d. from a representative of two biological replicate experiments.
Cells were treated as in (D). Protein lysates were prepared and analyzed by SDS‐PAGE followed by immunoblotting using the indicated antibodies.

- A
WT and LGP2‐knockout (clones 1 and 2) HEK293 cells were transfected with an siRNA targeting ADAR1 (siADAR1) or a control siRNA (siCtrl) and were treated 8 h later with recombinant type I IFN to upregulate RLR expression. Cells were harvested 80 h post siRNA transfection and RT‐qPCR analysis was used to monitor IFN‐β and IFIT1 expression and ADAR1 knockdown. All transcripts were normalized to ACTB. Data are means ± s.d. from a representative of three biological replicate experiments.
- B
Cells were treated as in (A). Protein lysates were prepared 80 h post siRNA transfection, followed by SDS‐PAGE and immunoblotting using the indicated antibodies (n = 3). siC, siCtrl; siA, siADAR1.
- C
LGP2‐knockout (clones 1 and 2) HEK293 cells were transfected with siADAR1 or siCtrl and 8 h later with a vector encoding FLAG‐LGP2 or an empty vector (EV). Cells were harvested 80 h post siRNA transfection and RT‐qPCR analysis was used to monitor IFN‐β and IFIT1 expression and ADAR1 knockdown. All transcripts were normalized to ACTB. Data are means ± s.d. from a representative of two biological replicate experiments.
- D
Cells were treated as in (C). Protein lysates were prepared 80 h post siRNA transfection, followed by SDS‐PAGE and immunoblotting using the indicated antibodies (n = 2).
- E, F
WT, LGP2‐knockout (clones 1 and 2), and stably expressing FLAG‐LGP2 HEK293 cells were transfected with transfection reagent only (LF2000), poly(I:C) (56, 112, 225, or 450 ng in (E)), or RNA isolated from HEK293 cells infected with EMCV in the presence of ribavirin (450 or 900 ng in (F)). Cells were harvested 16 h post‐transfection and RT‐qPCR analysis was used to monitor IFN‐β and IFIT1 expression. All transcripts were normalized to ACTB. Data are means ± s.d. from a representative of four (E) or three (F) biological replicate experiments.
- G
MDA5‐knockout HEK293 cells stably expressing FLAG‐LGP2 or an empty vector (EV) were transfected with increasing amounts (5, 20, 40, 80, or 240 ng/ml) of a vector encoding FLAG‐MDA5 WT or FLAG‐MDA5 G495R. As a control, cells were transfected with 240 ng/ml control vector or left untreated. Cells were harvested 24 h post‐transfection and RT‐qPCR analysis was used to monitor IFN‐β and IFIT1 expression. All transcripts were normalized to ACTB. Data are means ± s.d. from a representative of two biological replicate experiments.

HEK293 cells were genetically engineered to knock out ADAR1 using CRISPR/Cas9. Cells were treated for 24 h with recombinant type I IFN to upregulate ADAR1 p150 and ISG60 to confirm correct gene editing and type I IFN responsiveness, respectively. Protein lysates were analyzed by SDS‐PAGE followed by immunoblotting using the indicated antibodies (n = 3).
ADAR1‐knockout HEK293 cells (clone 1) were cotransfected with an empty vector (EV) or a FLAG‐LGP2‐encoding vector (LGP2) combined with a vector encoding GFP‐tagged ADAR1 p110 or p150. Cells were harvested 72 h post‐transfection and the type I IFN response was monitored by RT‐qPCR analysis of IFN‐β and IFIT1 expression, normalized to ACTB. Data are means ± s.d. from a representative of four biological replicate experiments.
ADAR1‐knockout cells (clone 1) were transfected as in (B). Protein lysates were analyzed by SDS‐PAGE followed by immunoblotting using the indicated antibodies (n = 4).

ADAR1‐knockout HEK293 cells (clone 2) were cotransfected with an empty vector (EV) or a FLAG‐LGP2‐encoding vector (LGP2) combined with a vector encoding GFP‐tagged ADAR1 p110 or p150. Cells were harvested 48 h post‐transfection and the type I IFN response was monitored by measuring IFN‐β and IFIT1 transcript expression, relative to ACTB expression, by RT‐qPCR. Data are means ± s.d. from a representative of three biological replicate experiments.
ADAR1‐knockout HEK293 cells (clone 2) were transfected as in (A). Protein lysates were analyzed by SDS‐PAGE followed by immunoblotting using the indicated antibodies (n = 3).
MDA5‐knockout HEK293 cells, generated in Fig 1D, were transfected with an ADAR1‐targeting siRNA (siADAR1) or a control siRNA (siCtrl) and 8 h later with an empty vector (EV) or a vector encoding the indicated WT, truncation, or point mutant(s) of MDA5. Cells were harvested 72 h post‐siRNA transfection and RT‐qPCR analysis was used to monitor ADAR1 knockdown and MDA5 (IFIH1) expression. All transcripts were normalized to ACTB. Data are means ± s.d. from a representative of two biological replicate experiments.

ADAR1‐knockout HEK293 cells (clone 1) were modified with a lentiviral‐based inducible system to express FLAG‐LGP2 WT or a FLAG‐LGP2 RNA binding mutant (K138E/R490E/K634E, denoted as “KRK mutant”) in a doxycycline‐regulated manner. Cells were treated 72 h with doxycycline (dox). Protein lysates were analyzed by SDS‐PAGE and immunoblotting using the indicated antibodies (n = 3). iEV, inducible empty vector; iLGP2, inducible LGP2.
Cells generated in (A) were treated with doxycycline for 72 h to induce LGP2 WT or KRK mutant gene expression. The type I IFN response (IFN‐β and IFIT1 transcripts) and LGP2 (DHX58) expression were monitored by RT‐qPCR analysis. All transcripts were normalized to ACTB. Data are means ± s.d. from a representative of three biological replicate experiments.
Cells generated in (A) were plated on coverslips and treated with or without doxycycline for 72 h. Cells were fixed, permeabilized, and stained with anti‐FLAG (red) and anti‐IRF3 (green) antibodies. Nuclei were stained with DAPI (blue). Scale bar is 50 μm. Total nuclei (> 500 nuclei per experimental condition) and IRF3‐positive nuclei were counted using semi‐automated software analysis and plotted as percentage IRF3‐positive nuclei of total nuclei per field of view (a representative of two biological replicate experiments is quantified). The boxplot indicates the interquartile range as a box, the median as a central line, and the whiskers extend from the minimum to the maximum value. Statistical analysis was performed using a Kruskal–Wallis test with a Dunn's post hoc test for multiple comparisons. ns, not significant; ****P < 0.0001.
Cells generated in (A) were treated with doxycycline for 72 h. During the last 24 h, recombinant type I IFN was added to upregulate endogenous MDA5 protein expression. Protein lysates were analyzed by SDD‐AGE and SDS‐PAGE using the indicated antibodies to determine protein oligomerization and total expression levels, respectively (n = 3).
MDA5‐knockout HEK293 cells, generated in Fig 1D, were transfected with an ADAR1‐targeting siRNA (siADAR1) or a control siRNA (siCtrl) and 8 h later with an empty vector (EV) or a vector encoding the indicated WT, truncation, or point mutant(s) of MDA5. Cells were harvested 72 h post‐siRNA transfection and the type I IFN response was monitored by RT‐qPCR analysis of IFIT1 and ISG15 transcript expression, normalized to ACTB. Data are means ± s.d. from a representative of two biological replicate experiments.

Schematic illustration of the domain structure of LGP2 and various point mutants and truncation mutants that are used in this study. The N‐terminal domain (NTD) of LGP2 is composed of a conserved DExH/D helicase domain, subdivided into the helicase 1 (Hel1), helicase 2 (Hel2) and helicase insertion (Hel2i) domain, and a pincer motif (P). The NTD is followed by a C‐terminal domain (CTD), involved in RNA binding.
HEK293 WT or ADAR1‐knockout cells (clone 1) were transiently transfected with an empty vector (EV) or a vector encoding the indicated WT, truncation, or point mutant(s) of LGP2. Cells were harvested 72 h post‐transfection and the type I IFN response was monitored by RT‐qPCR analysis of IFN‐β and IFIT1 transcript expression, normalized to ACTB. Data are means ± s.d. from a representative of three biological replicate experiments.
Cells were treated as in (B). Protein lysates were prepared and analyzed by SDS‐PAGE followed by immunoblotting using the indicated antibodies (n = 3). The dotted line indicates the juxtaposition of two nonadjacent lanes.

Kaplan–Meier plots showing overall survival of ADAR low and ADAR high patients stratified by DHX58 levels in bladder cancer (BLCA; n = 407), breast cancer (BRCA; n = 1099), and sarcoma (SARC; n = 263) TCGA datasets. Median cut‐offs were used for patient stratification and logrank test P values are shown.
CAL27 cells transduced with doxycycline‐inducible shRNAs targeting ADAR1 or GFP (negative control) were treated with doxycycline and transfected with two independent siRNAs targeting LGP2 (siLGP2 #1 or #2) or a control siRNA (siCtrl). To determine cell confluency at 120 h post‐transfection, cells were fixed, stained with Crystal Violet, and imaged. Images of a representative experiment are shown (n = 3).
Crystal Violet was extracted from stained cells (B) and the dye intensity was quantified using a colorimetric assay (OD590). OD590 values of doxycycline‐treated cells were normalized to the OD590 values of untreated cells. Quantification of data from three independent experiments is shown as mean ± s.d. Statistical analysis was performed using ordinary two‐way ANOVA with Tukey's post hoc test. ns, not significant; *P < 0.05; **P < 0.01; ****P < 0.0001.

- A
ADAR low patients with concomitant DHX58 high expression have prolonged survival across multiple cancer types. Hazard ratios and 95% confidence intervals from univariate Cox regression models for DHX58 stratification in ADAR low (left panel) and ADAR high (right panel) patients from 17 TCGA datasets (sarcoma = SARC, liver = LIHC, esophageal = ESCA, breast = BRCA, bladder = BLCA, endometrial = UCEC, rectal = READ, cervical = CESC, melanoma = SKCM, ovarian = OV, pancreas = PAAD, lung adenocarcinoma = LUAD, stomach = STAD, head and neck = HNSC, clear cell renal cell carcinoma = KIRC, lung squamous = LUSC, colon = COAD). Median cut‐off values for both ADAR and DHX58 were used for patient stratification. Dashed lines indicate a hazard ratio of 1. Wald test P values are shown.
- B–D
CAL27 cells were transduced with doxycycline‐inducible shRNAs targeting ADAR1 or GFP (negative control) and subsequently treated with doxycycline and/or transfected with two independent siRNAs targeting LGP2 (siLGP2 #1 or #2) or a control siRNA (siCtrl). (B) Cells were harvested 72 h post‐treatment and RT‐qPCR analysis was used to monitor knockdown efficiency of ADAR1 and LGP2 (DHX58) upon doxycycline treatment or siRNA transfection, respectively. All transcripts were normalized to ACTB. Data are means ± s.d. from a representative of three biological replicate experiments. (C) Cell confluency was measured every 4 h on a IncuCyte S3 Live‐Cell Analysis machine. Data are means ± s.e.m (16 replicate fields of view per experimental condition) from a representative of two biological replicate experiments. (D) Knockdown efficiency of ADAR1 and LGP2 (DHX58) in samples of (C) at 120 h post‐treatment was determined as in (B). Data are means ± s.d. from one experiment.

Endogenous expression level and type I IFN inducibility of relevant proteins in HT29, LIM1215, and CAL27 cells. Cells were treated with or without recombinant type I IFN. Protein lysates were analyzed by SDS‐PAGE followed by immunoblotting with the indicated antibodies. *, nonspecific band.
HT29 cells were transfected with the indicated siRNAs. Cells were harvested 72 h post‐transfection and RT‐qPCR analysis was used to monitor the type I IFN response (IFN‐β, IFIT1, and ISG15 transcripts) and knockdown efficiency of ADAR1 and LGP2 (DHX58). All transcripts were normalized to ACTB. Data are means ± s.d. from a representative of three biological replicate experiments.
LIM1215 cells were transfected with the indicated siRNAs. Cells were harvested 72 h post‐transfection and knockdown efficiency of ADAR1 and LGP2 (DHX58) was analyzed as in (C). Data are means ± s.d. from a representative of three biological replicate experiments.
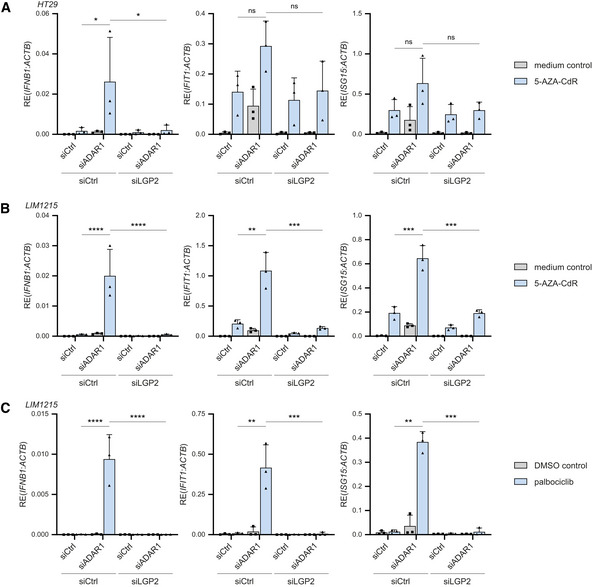
HT29 cells were treated with or without 300 nM 5‐AZA‐CdR for 2 days and subsequently washed and transfected with the indicated siRNAs. Cells were harvested 72 h post‐transfection and the type I IFN response was analyzed by RT‐qPCR analysis of IFN‐β, IFIT1, and ISG15 transcript expression, normalized to ACTB.
LIM1215 cells were treated with or without 300 nM 5‐AZA‐CdR for 2 days and subsequently washed and transfected with the indicated siRNAs. Cells were harvested 72 h post‐transfection and the type I IFN response was analyzed as in (A).
LIM1215 cells were treated with 250 nM of palbociclib or a DMSO control for 7 days. Three days after treatment initiation, cells were transfected with the indicated siRNAs and cultured for an additional 72 h. The type I IFN response was monitored as in (A).
Similar articles
-
Adenosine deaminase acting on RNA 1 limits RIG-I RNA detection and suppresses IFN production responding to viral and endogenous RNAs.J Immunol. 2014 Oct 1;193(7):3436-45. doi: 10.4049/jimmunol.1401136. Epub 2014 Aug 29. J Immunol. 2014. PMID: 25172485 Free PMC article.
-
Adenosine-to-inosine editing of endogenous Z-form RNA by the deaminase ADAR1 prevents spontaneous MAVS-dependent type I interferon responses.Immunity. 2021 Sep 14;54(9):1961-1975.e5. doi: 10.1016/j.immuni.2021.08.011. Immunity. 2021. PMID: 34525337 Free PMC article.
-
Aicardi-Goutières syndrome-associated mutation at ADAR1 gene locus activates innate immune response in mouse brain.J Neuroinflammation. 2021 Jul 31;18(1):169. doi: 10.1186/s12974-021-02217-9. J Neuroinflammation. 2021. PMID: 34332594 Free PMC article.
-
The role of RNA editing enzyme ADAR1 in human disease.Wiley Interdiscip Rev RNA. 2022 Jan;13(1):e1665. doi: 10.1002/wrna.1665. Epub 2021 Jun 8. Wiley Interdiscip Rev RNA. 2022. PMID: 34105255 Free PMC article. Review.
-
LGP2 synergy with MDA5 in RLR-mediated RNA recognition and antiviral signaling.Cytokine. 2015 Aug;74(2):198-206. doi: 10.1016/j.cyto.2015.02.010. Epub 2015 Mar 18. Cytokine. 2015. PMID: 25794939 Free PMC article. Review.
Cited by
-
Function conservation and disparities of zebrafish and human LGP2 genes in fish and mammalian cells responsive to poly(I:C).Front Immunol. 2022 Aug 17;13:985792. doi: 10.3389/fimmu.2022.985792. eCollection 2022. Front Immunol. 2022. PMID: 36059486 Free PMC article.
-
Activation of cytosolic RNA sensors by endogenous ligands: roles in disease pathogenesis.Front Immunol. 2023 May 24;14:1092790. doi: 10.3389/fimmu.2023.1092790. eCollection 2023. Front Immunol. 2023. PMID: 37292201 Free PMC article. Review.
-
Interplay between RNA interference and transposable elements in mammals.Front Immunol. 2023 Jul 5;14:1212086. doi: 10.3389/fimmu.2023.1212086. eCollection 2023. Front Immunol. 2023. PMID: 37475864 Free PMC article. Review.
-
Longitudinal analysis of influenza vaccination implicates regulation of RIG-I signaling by DNA methylation.Sci Rep. 2024 Jan 17;14(1):1455. doi: 10.1038/s41598-024-51665-9. Sci Rep. 2024. PMID: 38228690 Free PMC article.
-
Exploiting RIG-I-like receptor pathway for cancer immunotherapy.J Hematol Oncol. 2023 Feb 8;16(1):8. doi: 10.1186/s13045-023-01405-9. J Hematol Oncol. 2023. PMID: 36755342 Free PMC article. Review.
References
-
- Ablasser A, Hur S (2020) Regulation of cGAS‐ and RLR‐mediated immunity to nucleic acids. Nat Immunol 21: 17–29 - PubMed
-
- Andersen J, VanScoy S, Cheng T‐F, Gomez D, Reich NC (2008) IRF‐3‐dependent and augmented target genes during viral infection. Genes Immun 9: 168–175 - PubMed
-
- Bhate A, Sun T, Li JB (2019) ADAR1: a new target for immuno‐oncology therapy. Mol Cell 73: 866–868 - PubMed
Publication types
MeSH terms
Substances
Grants and funding
LinkOut - more resources
Full Text Sources
Medical
Research Materials
