

Targeting human CALR-mutated MPN progenitors with a neoepitope-directed monoclonal antibody
- PMID: 35156745
- PMCID: PMC8982588
- DOI: 10.15252/embr.202152904
Targeting human CALR-mutated MPN progenitors with a neoepitope-directed monoclonal antibody
Abstract
Calreticulin (CALR) is recurrently mutated in myelofibrosis via a frameshift that removes an endoplasmic reticulum retention signal, creating a neoepitope potentially targetable by immunotherapeutic approaches. We developed a specific rat monoclonal IgG2α antibody, 4D7, directed against the common sequence encoded by both insertion and deletion mutations. 4D7 selectively bound to cells co-expressing mutant CALR and thrombopoietin receptor (TpoR) and blocked JAK-STAT signalling, TPO-independent proliferation and megakaryocyte differentiation of mutant CALR myelofibrosis progenitors by disrupting the binding of CALR dimers to TpoR. Importantly, 4D7 inhibited proliferation of patient samples with both insertion and deletion CALR mutations but not JAK2 V617F and prolonged survival in xenografted bone marrow models of mutant CALR-dependent myeloproliferation. Together, our data demonstrate a novel therapeutic approach to target a problematic disease driven by a recurrent somatic mutation that would normally be considered undruggable.
Keywords: calreticulin; monoclonal antibody; myelofibrosis; myeloproliferative neoplasm; stem cell progenitor.
© 2022 The Authors. Published under the terms of the CC BY 4.0 license.
Figures
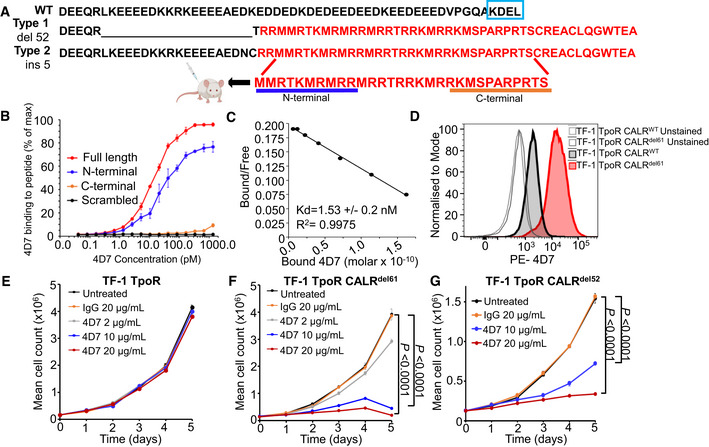
Schematic showing wild‐type C‐terminal calreticulin protein sequence and neoepitope sequences for 52 bp deletion or 5 bp insertion and peptide sequence used for immunization.
Diluting concentrations of 4D7 to bound full‐length 30 amino acid peptide compared to scrambled, C‐terminal and N‐terminal 11 amino acid peptides as shown in A (n = 3 biological replicates).
Scatchard analysis showing dissociation constant of 4D7 using 125I‐labelled and unlabelled 4D7 bound to full‐length 30 amino acid peptide (n = 3 biological replicates).
Histogram showing fluorescence intensity of 4D7 conjugated to phycoerythrin at a 4 µg/ml TF‐1 TpoR CALRdel61 vs. TF‐1 TpoR CALRWT compared to unstained.
TF‐1 TpoR cells with endogenous wild‐type CALR cultured in the presence of TPO and 2, 10 or 20 µg/ml 4D7 anti‐mutant CALR antibody or 20 µg/ml control IgG antibody (n = 3 biological replicates).
Proliferation curves of factor‐independent TF‐1 TpoR CALRdel61 cells cultured with 2, 10 or 20 µg/ml 4D7 or 20 µg/ml of control IgG antibody (n = 3 biological replicates).
Proliferation curves of factor‐independent TF‐1 TpoR CALRdel52 cells cultured with 10 or 20 µg/ml 4D7 or 20 µg/ml of control IgG antibody (n = 3 biological replicates).
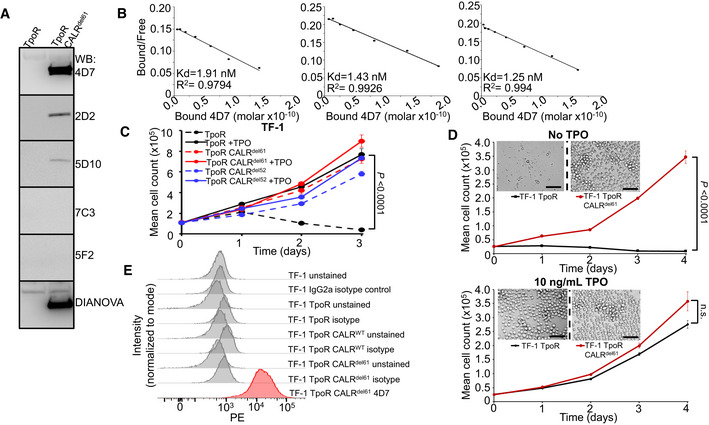
Western blot screening of various mutant CALR antibody clones produced from hybridomas in TF‐1 TpoR and TF‐1 TpoR CALRdel61 cells. Varying levels of intensity can be observed compared to commercial Dianova monoclonal mutCALR antibody. 4D7 is able to detect mutant CALR protein in CALRdel61 cells but not in CALR wild‐type TF‐1 cells.
Biological replicate Scatchard analyses of 4D7 using 125I‐labelled and unlabelled 4D7 bound to full‐length peptide (n = 3 technical replicates).
TF‐1 cells expressing TpoR and CALRdel61 or CALRdel52 demonstrate factor independence in absence of TPO. Cells were cultured in the presence or absence of 10 ng/ml TPO (n = 3 biological replicates).
Paracrine CALR‐mutant protein is not sufficient to maintain TPO‐sensitive cells in culture. TF‐1 TpoR and TF‐1 TpoR CALRdel61 cells were seeded at the same density and cultured in the presence or absence of TPO. Cells were separated by semi‐permeable membrane in a horizontal co‐culture system. Cell populations on either side of the membrane were counted every 24 h over 4 days in triplicate and representative images were taken on day 4. Exogenous CALR secreted by TF‐1 TpoR CALRdel61 was unable to assist growth of factor‐dependent TF‐1 TpoR cells. Scale bar indicates 100 µm (n = 3 biological replicates).
Histogram overlays showing fluorescence intensity of unstained and PE‐conjugated IgG2a isotype control in TF‐1, TF‐1 TpoR, TF‐1 TpoR CALRWT and TF‐1 TpoR CALRdel61 compared to 4D7 conjugated to PE.
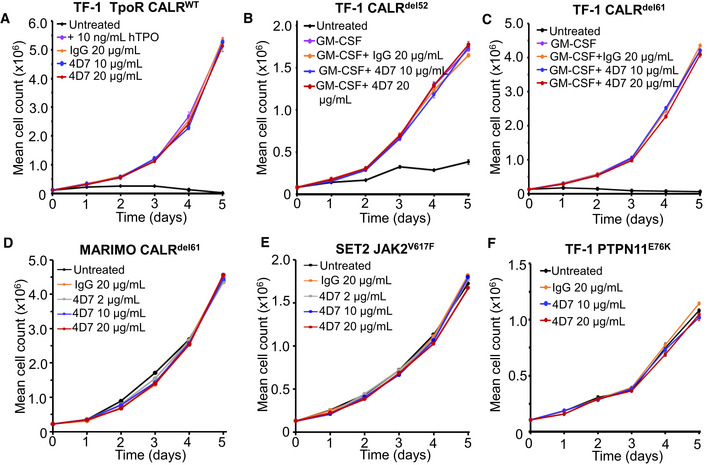
Cytokine‐dependent TF‐1 TpoR cells with an overexpression of WT CALR cultured in the absence of TPO, 10 ng/ml hTPO and 10 or 20 µg/ml 4D7 or 20 µg/ml control IgG antibody for 5 days and the number of trypan blue‐negative cells were counted every 24 h (n = 3 biological replicates with three technical replicates).
Cytokine‐dependent TF‐1 CALRdel52 cells lacking TpoR were cultured in the presence of 2 ng/ml GM‐CSF and 10 or 20 µg/ml 4D7 or 20 µg/ml control IgG antibody (n = 3 biological replicates with three technical replicates).
Cytokine‐dependent TF‐1 CALRdel61 cells lacking TpoR were cultured in the presence of 2 ng/ml GM‐CSF and 10 or 20 µg/ml 4D7 or 20 µg/ml control IgG antibody (n = 3 biological replicates with three technical replicates).
MARIMO cells from which the CALRdel61 mutation was originally amplified were cultured in the presence of 2, 10 or 20 µg/ml 4D7 or 20 µg/ml control IgG antibody (n = 3 biological replicates with three technical replicates).
Cytokine‐independent SET2 cells which harbour the pathogenic JAK2V617F mutation were cultured in the presence of 2, 10 or 20 µg/ml 4D7 or 20 µg/ml control IgG antibody (n = 3 biological replicates with three technical replicates).
Cytokine‐independent TF‐1 PTPN11E76K cells were cultured in the presence of 10 or 20 µg/ml 4D7 or 20 µg/ml control IgG antibody (n = 3 biological replicates with three technical replicates).
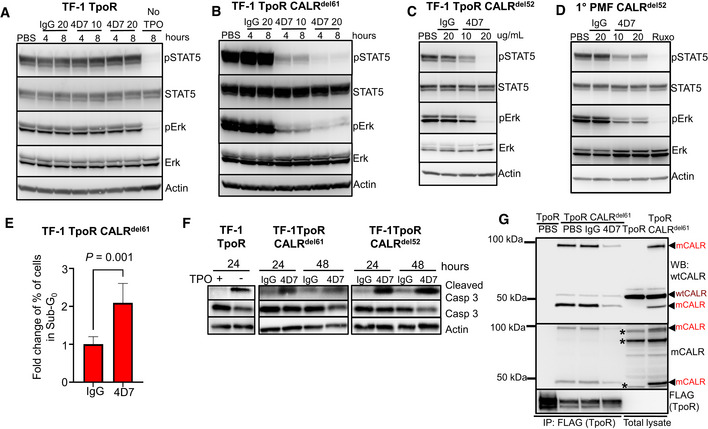
Cell extracts blotted for phospho‐STAT5, total STAT5, phospho‐ERK, total ERK and actin from TF‐1 TpoR cells after incubation with 10 or 20 µg/ml 4D7 or IgG for 4 or 8 h, in presence of TPO. The last line indicates TPO withdrawal.
Similar experiment using TPO‐independent TF‐1 TpoR CALRdel61 cells.
Similar experiment using TPO‐independent TF‐1 TpoR CALRdel52 cells at 8 h.
Similar experiment using PBMNCs from CALRdel52 PMF primary cells at 8 h. Additionally, cells were treated with 280 nM of ruxolitinib as a positive control.
Fraction of apoptotic sub‐G0 population of TF‐1 TpoR CALRdel61 cells after 48 h of 4D7 or IgG treatment (n = 3 biological replicates, bars represent standard deviation for three replicates, normalized to IgG, with a Student's unpaired t‐test used to determine statistical significance).
Western blot showing caspase 3 cleavage occurring within 24 h of TPO withdrawal in TPO‐dependent TF‐1 TpoR cells. An increase in cleaved caspase 3 is observed after 48 h of treatment with 20 µg/ml 4D7 in TF‐1 TpoR CALRdel61 and TF‐1 TpoR CALRdel52 cells.
Western blot of TpoR immunoprecipitation under non‐reducing conditions showing associated CALR 50 kDa monomers and 100 kDa dimers (red arrowheads) present only in TF‐1 TpoR CALRdel61 disrupted by 8‐h treatment with 20 µg/ml 4D7 but not PBS or 20 µg/ml IgG. CALR monomers and dimers are detectable by polyclonal anti‐wild‐type CALR or anti‐mutant CALR monoclonal antibodies. Red arrowheads, detected mutant CALR protein; brown arrowheads, detected wild‐type CALR protein; asterisk, non‐specific bands.
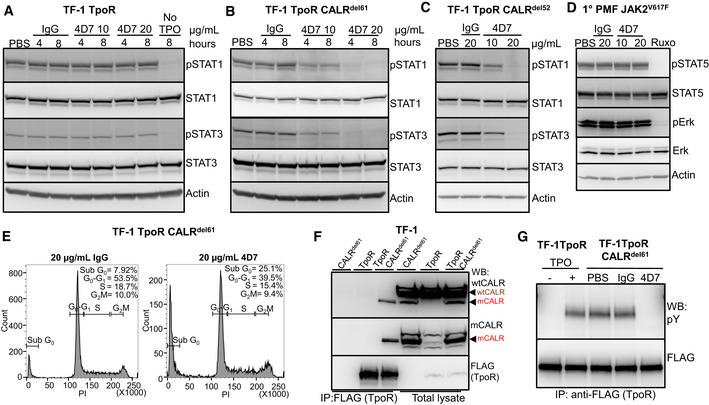
Cell extracts blotted for phospho‐STAT1, total STAT1, phospho‐STAT3, total STAT3 and actin from TF‐1 TpoR cells after incubation with 10 or 20 µg/ml 4D7 or IgG for 4 or 8 h as indicated.
Similar experiment using TPO‐independent TF‐1 TpoR CALRdel61 cells at 4 and 8 h.
Similar experiment shown using TPO‐independent TF‐1 TpoR CALRdel52 cells, 8 h.
Similar experiment using PBMNCs from JAK2V617F PMF primary cells at 8 h. Additionally, cells were treated with 280 nM of ruxolitinib as a positive control.
Flow cytometry analysis for cell cycle distribution of TF‐1 TpoR CALRdel61 cells exposed to 20 µg/ml IgG or 4D7 for 48 h. Cells were harvested and fixed and stained with propidium iodide and their DNA contents were analysed. Results from one representative experiment shown. Percentages of cells in Sub G0, G1, S and G2/M cycle indicated.
Western blot showing specific co‐immunoprecipitation of mutant CALRdel61 cells with TpoR anti‐FLAG antibody under reducing conditions detected by WT and mutant‐specific CALR antibodies. Red arrowheads, detected mutant CALR protein; brown arrowheads, detected wild‐type CALR protein.
Western blot showing decreased TpoR phosphorylation in a TpoR immunoprecipitated after 8 h of 20 µg/ml 4D7 treatment compared to PBS or IgG control in TF‐1 TpoR CALRdel61.
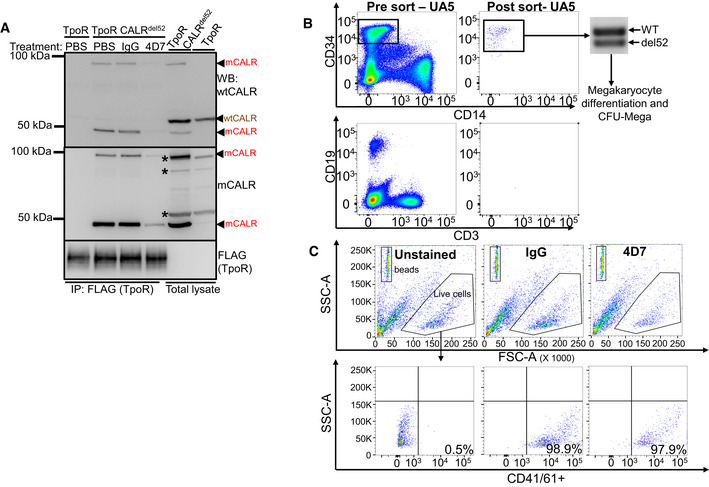
Western blot of TpoR immunoprecipitation under non‐reducing conditions showing associated CALR 50 kDa monomers and 100 kDa dimers (red arrowheads) present only in TF‐1 TpoR CALRdel52 disrupted by 8‐h treatment with 20 µg/ml 4D7 but not PBS or 20 µg/ml IgG. CALR monomers and dimers are detectable by polyclonal anti‐wild‐type CALR or anti‐mutant CALR monoclonal antibodies. Red arrowheads, detected mutant CALR protein; brown arrowheads, detected wild‐type CALR protein; asterisk, non‐specific bands.
Peripheral blood mononuclear cells from PMF samples were thawed and stained for CD34, CD14, CD19 and CD3 prior to FACS sorting. Each population was collected and purity was verified prior to proceeding with any further analysis. PCR amplification of CALR exon 9 was carried out to confirm mutational status of CD34+ cells which were utilized in megakaryocyte differentiation assays and colony forming assays in the presence of 4D7 or IgG.
Representative flow cytometry plots for determination of CD41+/61+ populations from liquid culture assay from one PMF patient. Beads shown in the upper left panel with high SSC‐A. Live cell population shown in hexagon gate (top panel). CD41/61+ population gates shown in lower panel with % CD41/61+ cells indicated for unstained, IgG‐ and 4D7‐treated cells over 12 days. The number of CD41/61+ cells‐to‐bead ratio used to enumerate effect of 4D7 on megakaryopoiesis.
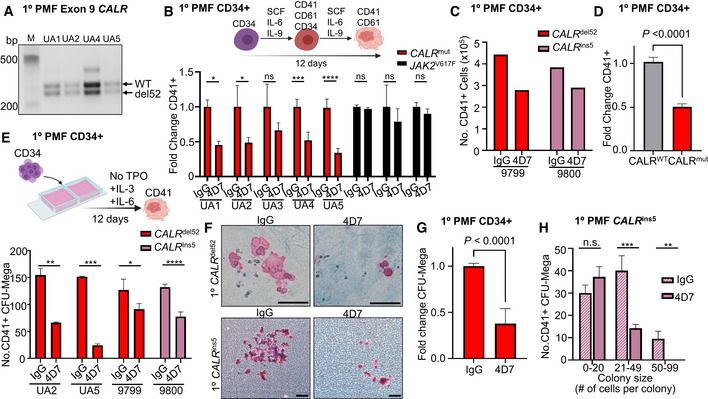
PCR amplification of CALR exon 9 from patients confirming heterozygous del52 mutation in sorted CD34+ cells obtained from CALR‐mutated myelofibrosis samples.
Graph showing the decreased fold change of CD41+CD61+ megakaryocytes cultured in 4D7 compared to IgG. FACS‐sorted CD34+ from myelofibrosis patients with CALR or JAK2 mutation was cultured over 12 days without TPO in the presence of SCF, IL‐6 and IL‐9. Black columns show JAK2 V617F mutation‐positive samples (n = 4 technical replicates of samples from different patients).
Number of CD41+ megakaryocytes derived from isolated CD34+ progenitors from myelofibrosis patients. Number of CD41/CD61+ cells counted on day 12 using trypan blue exclusion (n = 1 technical replicate).
Summary of fold change reduction of CD41/CD61+ megakaryocytes by 4D7 in all tested CALR‐mutated patient samples compared to CALR wild type, normalized to IgG (n = 11 samples from different patients, with four technical replicates per sample).
Number of CD41+ megakaryocyte colonies from patient samples after 4D7 treatment. CD34+ from patients with myelofibrosis with CALR del52 or CALR ins5 was plated on collagen‐based matrix in presence of 20 µg/ml 4D7 or IgG control (n = 3 biological replicates).
Representative micrographs showing CD41+ colonies in pink and CD41‐ colonies in blue after treatment with 4D7 or IgG at 100× or 40× magnification. Scale bar indicates 100 µm.
Summary of fold change reduction in CD41+ megakaryocytes in CALR‐mutated samples cultured MegaCult treated with 4D7 compared to IgG (n = 4 biological replicates).
Number of megakaryocyte colony forming units grouped according to colony cell number after 4D7 treatment in a mutant CALR ins5 sample (n = 3 biological replicates).
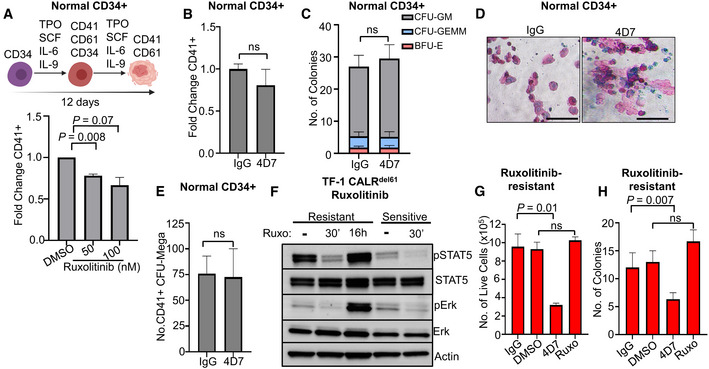
Graph showing effect of ruxolitinib on megakaryocyte differentiation at 50 and 100 nM in healthy CD34+ cells (n = 4 different cords collected with three technical replicates).
Effect of 4D7 on TPO‐dependent megakaryocyte differentiation of healthy CD34+ cells cultured with 20 µg/ml 4D7 or IgG control (n = 2 biological replicates, with two technical replicates).
Total numbers of haematopoietic colonies plated in MethoCult from healthy cord blood after treatment with 4D7 or IgG. CFU‐GM, colony forming unit–granulocyte macrophage; BFU‐E, blast forming unit–erythroid; CFU‐GEMM, colony forming unit–granulocyte, erythroid, monocyte and megakaryocyte (n = 3 biological replicates).
CD41+ megakaryocyte colonies from healthy CD34+ cells observed on collagen matrix after 4D7 treatment. Colonies were cultured in TPO, SCF, IL‐9 and IL‐3. Scale bar indicates 100 µm.
Number of megakaryocyte colony forming units observed in MegaCult assay after treatment of healthy cord blood CD34+ cells with either IgG or 4D7 (n = 3 biological replicates).
Western blot showing signalling in ruxolitinib‐resistant TF‐1 TpoR CALRdel61 compared to ruxolitinib‐sensitive TF‐1 TpoR CALRdel61 cells after treatment with 100 nM ruxolitinib for 16 h or 30 min and blotted for phospho‐STAT5, total STAT5, phospho‐ERK, total ERK and actin as indicated. Ruxolitinib‐sensitive cells were non‐viable after 16 h of treatment.
Comparison of cell growth after DMSO, 20 µg/ml 4D7, IgG or 100 nM ruxolitinib treatment over 4 days of ruxolitinib‐resistant TF‐1 TpoR CALRdel61. Cells counted using trypan blue exclusion (n = 3 biological replicates with three technical replicates).
Number of colonies observed from cells plated in MethoCult following 72 h of treatment with DMSO, 20 µg/ml 4D7, IgG or 100 nM ruxolitinib performed in ruxolitinib‐resistant TF‐1 TpoR CALRdel61 cells (n = 3 biological replicates with three technical replicates).
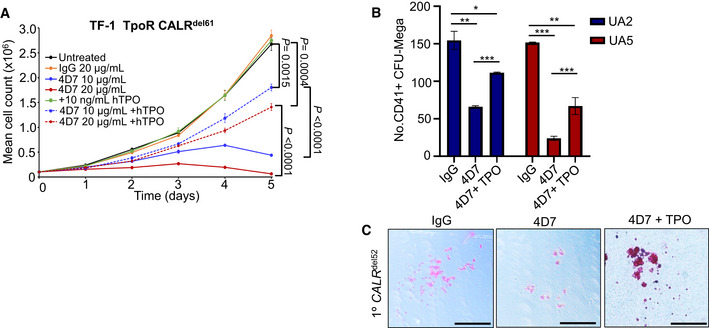
Proliferation curves of factor‐independent TF‐1 TpoR CALRdel61 cells cultured with 10 or 20 µg/ml 4D7 or 20 µg/ml of control IgG antibody in presence or absence of 10 ng/ml TPO (n = 3 biological replicates with three technical replicates).
Number of CD41+ megakaryocyte colonies CALRdel52 patient after 4D7 treatment in the presence of TPO. Samples were seeded in a collagen‐based matrix in presence of 20 µg/ml 4D7 or IgG control with 50 ng/ml TPO (n = 2 patient samples with two technical replicates).
Representative micrographs showing CD41+ colonies in pink and CD41‐ colonies in blue after treatment with IgG or 4D7 in absence or presence of 50 ng/ml TPO. Scale bar indicates 100 µm.
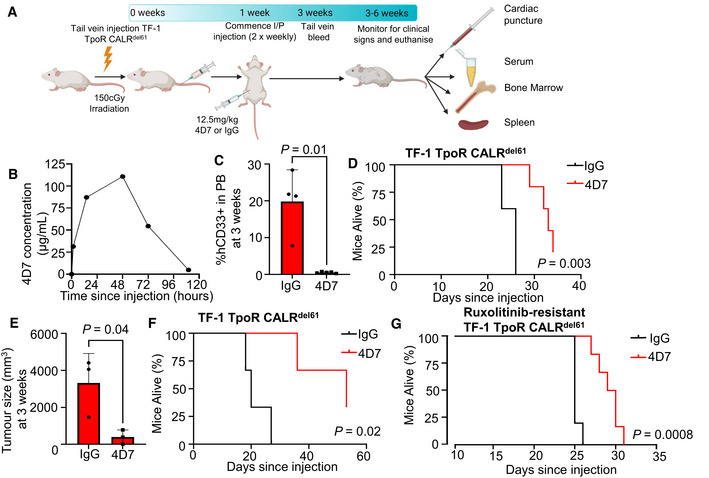
Illustration showing bone marrow NSG engraftment model with TPO‐independent TF‐1 TpoR CALRdel61 cells treated with 4D7 or IgG control twice weekly, starting 7 days after engraftment via intraperitoneal injection and final measurements taken from euthanized mice.
Pharmacokinetic measurements of serum levels of 4D7 in mice after intraperitoneal injection at 0, 1, 24, 48, 72 and 110 h since administration.
Percentage of TF‐1 TpoR CALRdel61 human CD33+ cells measured in peripheral blood at 3 weeks post‐tail vein engraftment (n = 5 mice per treatment).
Kaplan–Meier survival curve of bone marrow engraftment model of TF‐1 TpoR CALRdel61 cells showing improved survival of mice treated with 4D7 compared with IgG control commencing 1 week after tail vein injection (n = 5 mice per treatment).
Mean tumour volume at 21 days after subcutaneous injection of TF‐1 TpoR CALRdel61 cells following treatment with 4D7 or IgG. Cells were pre‐treated with 4D7 or IgG control for 1 h prior to injection and treatment continued twice weekly at 12.5 mg/kg until euthanasia (n = 3 mice per treatment).
Kaplan–Meier survival curve of TF‐1 TpoR CALRdel61 chloroma mice treated with 4D7 or IgG until humane killing due to tumour diameter > 30 mm or ulceration (n = 3 mice per treatment).
Kaplan–Meier survival curve of NSG mice engrafted with ruxolitinib‐resistant TF‐1 TpoR CALRdel61 treated with 12.5 mg/kg 4D7 or IgG twice weekly (n = 5 and 6 mice for IgG and 4D7, respectively).
References
-
- Achyutuni S, Nivarthi H, Majoros A, Hug E, Schueller C, Jia R, Varga C, Schuster M, Senekowitsch M, Tsiantoulas D et al (2021) Hematopoietic expression of a chimeric murine‐human CALR oncoprotein allows the assessment of anti‐CALR antibody immunotherapies in vivo . Am J Hematol 96: 698–707 - PubMed
-
- Araki M, Yang Y, Masubuchi N, Hironaka Y, Takei H, Morishita S, Mizukami Y, Kan S, Shirane S, Edahiro Y et al (2016) Activation of the thrombopoietin receptor by mutant calreticulin in CALR‐mutant myeloproliferative neoplasms. Blood 127: 1307–1316 - PubMed
-
- Araki M, Yang Y, Imai M, Mizukami Y, Kihara Y, Sunami Y, Masubuchi N, Edahiro Y, Hironaka Y, Osaga S et al (2019) Homomultimerization of mutant calreticulin is a prerequisite for MPL binding and activation. Leukemia 33: 122–131 - PubMed
-
- Baade PD, Ross DM, Anderson LA, Forsyth C, Fritschi L (2019) Changing incidence of myeloproliferative neoplasms in Australia, 2003–2014. Am J Hematol 94: E107–E109 - PubMed
-
- Balligand T, Achouri Y, Pecquet C, Gaudray G, Colau D, Hug E, Rahmani Y, Stroobant V, Plo I, Vainchenker W et al (2020) Knock‐in of murine Calr del52 induces essential thrombocythemia with slow‐rising dominance in mice and reveals key role of Calr exon 9 in cardiac development. Leukemia 34: 510–521 - PubMed
Publication types
MeSH terms
Substances
Grants and funding
LinkOut - more resources
Full Text Sources
Other Literature Sources
Molecular Biology Databases
Research Materials
Miscellaneous
