Large-scale analysis of Drosophila core promoter function using synthetic promoters
- PMID: 35156763
- PMCID: PMC8842121
- DOI: 10.15252/msb.20209816
Large-scale analysis of Drosophila core promoter function using synthetic promoters
Abstract
The core promoter plays a central role in setting metazoan gene expression levels, but how exactly it "computes" expression remains poorly understood. To dissect its function, we carried out a comprehensive structure-function analysis in Drosophila. First, we performed a genome-wide bioinformatic analysis, providing an improved picture of the sequence motifs architecture. We then measured synthetic promoters' activities of ~3,000 mutational variants with and without an external stimulus (hormonal activation), at large scale and with high accuracy using robotics and a dual luciferase reporter assay. We observed a strong impact on activity of the different types of mutations, including knockout of individual sequence motifs and motif combinations, variations of motif strength, nucleosome positioning, and flanking sequences. A linear combination of the individual motif features largely accounts for the combinatorial effects on core promoter activity. These findings shed new light on the quantitative assessment of gene expression in metazoans.
Keywords: gene expression; modeling; motif search; mutational analysis; promoter.
© 2022 The Authors. Published under the terms of the CC BY 4.0 license.
Figures

- A
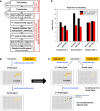
The promoter region was divided into 7 building blocks: block 1 with 239 bp of a potential −1 nucleosomal sequence; block 2 with 73 bp sequence representing the ecdysone receptor binding region; block 3‐6 with 131 bp sequence representing the native and perturbative core promoter regions from different architectures; block 7 with 240 bp of a potential +1 nucleosomal sequence.
- B
Synthetic promoter design—building blocks. The promoter region (sketch in lower panel) was divided into 7 building blocks: block 1 with 239 bp sequence representing a potential −1 nucleosome; block 2 with 73 bp sequence representing the ecdysone receptor binding region; block 3‐6 with 131 bp sequence representing the native and perturbative core promoter regions from different architectures; block 7 with 240 bp sequence representing a potential +1 nucleosome.
- C
Control co‐transfected vector (backbone not represented) used for data normalization (Material and Methods), and consisting in a pTran promoter driving the expression of the Renilla Luciferase gene.
- D
Simplified dual luciferase assay experimental workflow. To measure promoter activity quantitatively on a large scale with high reproducibility, we integrated the golden gate cloning strategy (BsaI cloning) with a high‐throughput experimental pipeline using automated robot systems for colony picking, reporter plasmids isolation, transient co‐transfection and dual luciferase assay (Fig EV1 and Materials and Methods for details).
- E
Normalized expression levels of the native core promoters. Their activities spanned over a broad range of three orders of magnitude (promoter constructs contained block 1.11 and block 7.11 combination as nucleosomal sequences). Each color represents a different class of core promoter architecture. The middle hinge represents the median. The interquartile range the difference between the 75th and 25th percentiles. Individual points represent values over 1.5 times the interquartile range. 3‐4 biological replicate measurements (including new cell transfection procedures and measurements of promoter activities).
- F
Confocal fluorescence sections of living D. melanogaster embryos (after ~40min at stage5 during embryonic development) expressing an optimized reporter mNeonGreen protein (Ceolin et al, 2020), and carrying hunchback anterior enhancer—tested core promoter—mNeon. The fluorescence signal of mNeonGreen can be seen (in false colors) in the nuclei at the embryo peripheries. The promoters tested correspond to motif knockouts or motif substitution with consensus sequences from the constitutive MED4 (on the left) and the developmental pain (on the right) promoters. The ko motifs or the type of mutations are indicated in white, together with the normalized expression levels (in bracket) measured with our luciferase assay pipeline. Whereas MED4 promoters drive strong expression along the entire anterior (A)—posterior (P) axis of the embryo, pain embryos show weaker expression, consistently with the expression levels measured in the luciferase assay. Noteworthy, in contrast to the homogenous AP expression with the constitutive MED4 gene, the A‐P expressions patterns for developmental pain resemble the known AP gradient of expression typically observed for the Hb enhancer. The white arrows indicate the fluorescence signals of the nuclei in the anterior part of the embryos.
- G, H
Quantification of the expression patterns in developing embryos, projected along the A‐P axis for MED4 (G) and for pain (H) for the different promoter variants, respectively. The errors bars are standard deviations from 3 to 4 biological replicates measurements (different embryos). The fluorescence background measured in a wild‐type embryo is shown as yellow dotted lines. The fluorescence patterns for pain recapitulate the typical hb_ant enhancer activity, characterized by a gradient of reporter expression (black arrow in H) with a sharp drop at around A‐P = 50%, which was expected for a developmental gene. An exemplary AP profile for the hb_ant enhancer is shown as gray empty triangles (the background was adjusted at about 3,000 a.u for better comparison). In contrast, the constructs containing the constitutive MED4 gene promoter lead to a stronger and more homogeneous expression with an only slightly enhanced expression level at the anterior tip (black arrow in G).
- I
Scatter plot of expression levels obtained in D. melanogaster S2 cells by our luciferase assay pipeline versus mNeonGreen reporter expression in living D. melanogaster embryos, revealing a high correlation (Pearson coefficient 0.91) between the two datasets. Error bars represent standard deviations of 3–4 biological replicate measurements.

- A
Workflow for automated transfection in 96‐well plate format, followed by dual luciferase (DLR) assay in 384‐well plate format (Materials and Methods). The transfection, lysis, and cell detachment occur in four cell culture 96‐wellplates, followed by their splitting into two 384‐well plates for separate readout of the Firefly and Renilla luminescence signals. This enabled to gain 4‐fold higher throughput and to save 2/3 of the luciferase assay reagent.
- B, C
Experimental strategy to eliminate crosstalk artifacts. Separating Firefly and Renilla readouts (the two upper panels) avoids potential crosstalk between the Firefly and Renilla luminescence light within the same well. A second readout of the Firefly signal after removal of the solution from wells with very strong signal eliminates the crosstalk between neighboring wells.
- D
Comparison of expression level measurements for three 96‐well plates containing the same promoter construct samples measured on different days with and without ecdysone induction. Standard normalization (before optimization) uses only the ratios of Firefly and Renilla signals. After optimization of data normalization procedure of the luciferase assay readout (Materials and Methods), the mean reproducibility of the measurements improved from a mean coefficient of variation ~13% after optimizations, versus ~18% before.

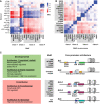
Core promoter motifs of D. melanogaster we detected using XXmotif. Motifs underlined in blue are the ones used in our experimental pipeline. The first twelve motifs were previously described in literature, while the seven below the gap are novel. Column “E‐values” indicates the significance level obtained with XXmotif. Column “Distr” depicts a smoothed distribution (over five nucleotides) of all identified binding sites within the gene set having the highest mutual information (and positive correlation), indicated in column “Gene set” (details in B and in Appendix Table S2). XXmotif reports the region (relative to the defined TSS) with the highest enrichment of binding sites (Column “Range”). Column “Conserv.” indicates the average conservation of binding sites, where 1 represents a perfect conservation, and 0 the background conservation. The bars correspond to 11 related Drosophila species, ordered by ascending evolutionary distance (details in Appendix Fig S1). The novel motifs are highly conserved. Column “Occ [%]” gives the frequency of motif sites within the whole sequence set (the gene set of highest mutual information).
Legend for the abbreviations used in the column “Gene Set” and in Fig EV3.

Correlation of core promoter motifs with different features (motifs and meaning of the different features listed in Fig EV2B) reveals four distinct motif classes: class 1 motifs enriched in the gene sets of stalledPol, MAD medhigh, NP, and min low; class 2 motifs enriched in the gene sets of max high, adult low, elf low, adult high, min off and MAD high; class 3 motifs enriched in the gene sets of min med, MAD low, adult med and BP; class 4 motifs enriched in the gene sets of min high and max high (details on the motifs in Fig EV2A and on the different gene sets in Appendix Table S1). MCC: Matthews correlation coefficient. Groups of core promoter motifs that correlate strongly positively with particular features are highlighted with black dashed boxes.
Core promoter elements co‐occur in architectures. Correlation of all core promoter elements to each other reveals elements that occur preferentially within the same promoter (positive correlation, blue, examples highlighted with black dashed boxes) or avoid each other (red). With the exception of the housekeeping class (class3)—which consists of two architectures (see C)—each promoter classes matches one architecture. In agreement with the four identified classes, most CPEs are positively correlated to all elements within their class and negatively correlated to CPEs belonging to other classes. Only the Class 4 elements are positively correlated to some motifs of especially Class 3. Negative correlations between elements within the same class are only found for elements located on both strands (e.g., GAGA versus revGAGA, TTGTT versus revTTGTT) and for two groups of elements within Class 3 (highlighted with black dotted squares): Class 3A (DRE and Ohler7) and Class 3B (INR2 and Ohler6). The two groups are correlated internally and anticorrelated with each other, indicating that the elements of each group bind a complex together. The remaining elements of Class 3, TTGTT, revTTGTT, revINR2, and E‐box1 show weak positive correlations to all other elements of their class suggesting that both transcription initiating complexes acting in this class have overlapping subunits.
The four core promoter architectures identified. Class 1 motifs (INR, MTEDPE, CGpal, GAGA, GAGArev) occur in genes with NP core promoters (Architecture 1, 3,976 genes). The enriched genes are intermediately regulated and show strong correlations to stalled Pol II. Class 2 motifs including TATA‐Box and ATGAA also present in NP promoter genes; however, the enriched genes are strongly regulated ones that are either not expressed or most highly expressed in at least one developmental stage (Ar.2, 815 genes). Class 3 motifs (INR2, Ohler6, DRE, Ohler7, E‐Box1, TTGTT, TTGTTrev, INR2rev, AAG3) are the ones only found in genes with BP core promoters (Ar.3, 5,170 genes). The enriched genes are not regulated and similarly expressed in all developmental stages (housekeeping function). Ar.3 can be further subdivided in two additional sub‐architectures Ar.3.1 and Ar.3.2, as discussed in B. Class 4 motifs (TCT, RDPE) correlate with strongly expressed genes which mainly encode the ribosomal proteins (Ar.4, 64 genes).


- A
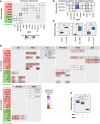
Motif‐wise combinatorial mutations within the core promoter: motif strength and motif position are changed individually. From top to bottom: knockout of motifs (individual or pairwise knockout of motifs, and knockout of all motifs); replacing the original motif with its computationally (XXmotif) derived sequences with different PWM scores (consensus with the highest score), or insertion of the consensus into the motif‐less promoter sequences; point mutation of motifs; substitution with functionally or positionally equivalent motifs from other architectures; shift of motif positions; sequence context exchange between different core promoters. The Mec2 motif composition is shown here as an example.
- B, C
Comparison of normalized expression levels between wild‐type configuration and motif knockouts for two types of core promoters (developmental: CG8157 (B); constitutive: RpL5 (C)). Upper panels: schematic depiction of the wild‐type motif compositions (TTGTT motif in RpL5 is ignored due to its strong overlap with R‐INR). Two‐sample t‐test: ns, not significant, *P ≤ 0.05; **P ≤ 0.01; ***P ≤ 0.001; ****P ≤ 0.0001. The middle hinge represents the median. The interquartile range the difference between the 75th and 25th percentiles. 3–4 biological replicate measurements.
- D
Mean expression fold changes compared to wild‐type expressions for individual knockout of motifs in different core promoters. Constitutive and developmental promoters are highlighted in red and green, respectively.
- E, F
Effect of pairwise motif knockout (log2 scale) in core promoters CG7712 (E) and pain (F), respectively. The heatmaps display the mean expression fold changes compared to wild‐type expressions for pairwise knockout of motifs compared to individual knockouts (diagonals). Additivity was calculated as the difference between the pairwise effect and the sum of two individual effects, subadditive (in blue): > 0; superadditive (in yellow): < 0; Additivity values for effects > 3 × SDnoise shown in the right lower corner of each pairwise effect.

Intra‐architectural mutations: both change of motif strength and motif position within the same construct. The Mec2 motif composition is shown here as an example.
Linear regression applied to predict the synthetic promoter activity based on individual motif features (intra‐architectural mutations). The measured expressions (on the y‐axis) for 6 tested core promoter sequences with combinatorial motif mutations compared to the predicted expressions (on the x‐axis) from the linear regression (log2 scale). Red solid line: y = x; red dashed lines: y = x ± 3 × SD, where SD denotes the median of all standard deviations over all measured synthetic promoter constructs. It is an estimate for the noise in the expression measurements. The linear regression model can explain on average 88% of the variance in expression (average r = 0.88).
Context exchange between different core promoters: the motifs of promoter 2 with their respective relative distance are conserved and are incorporated in the sequence context of promoter 1.
Effect of motif context sequence exchange. Heatmap depicting the mean expression fold changes caused by motifs (y‐axis) inserting of RpL5, RpL36A, thoc6, CG8157, and cas to different context sequences (x‐axis). The heatmap shows the expression changes relative to wild‐type expressions of the context‐origin promoters CG10915, CG15674, cas, CG8157, thoc6, RpL36A’, and RpL5, respectively.
Inter‐architectural mutations: block‐wise combinatorial mutations between different core promoters. The motifs together with their sequence context within a block are swapped with others.
Linear regression analysis for inter‐architectural block‐wise combinatorial mutations. The measured expressions (on the y‐axis) for inter‐architectural block‐wise combinatorial mutations compared to the predicted expressions (on the x‐axis) from the linear regression fit (log2 scale). Red solid line: y = x; red dashed lines: y = x ± 3 × SD, where SD denotes the median of all standard deviations over all measured synthetic promoter constructs. Pearson coefficient 0.81.

Heatmap depicting the relative expression level measurements of promoter constructs with different pairs of the nucleosomal sequences block 1 and block 7 compared to B1.11 + B7.11 expressions (log2 scale). Results were pooled for all tested native core promoters to calculate the average deviation to B1.11 + B7.11 expressions.
Heatmap depicting the relative expression level measurements of promoter constructs with different free combinations of block 1 and block 7 compared to B1.11 + B7.11 expressions (marked with a red rectangle). Results were pooled for all tested native core promoters to calculate the average deviation to B1.11 + B7.11 expressions. Bar plots on the top and the left represent the GC content of each block 1 and block 7 sequence. Block 7 with column “w/o B7” represents the results obtained from promoters without block 7 sequence.
Boxplots depicting block 1 effects for tested core promoters. Effects of different block 7s were merged in each column (within the same block 1): the median SD is 0.66 for developmental promoters compared to 1.23 for constitutive promoters (lower right corner); Wilcoxon rank‐sum test ***P = 3.1 × 10⁻⁴, significant. The middle hinge represents the median. The interquartile range the difference between the 75th and 25th percentiles. Individual points represent values over 1.5 times the interquartile range. 3–4 biological replicate measurements.
Boxplots depicting block 7 effects for tested core promoters. Effects of different block 1s were merged in each column (within the same block 7): the median SD is 0.54 for developmental promoters compared to 0.64 for constitutive promoters (lower right corner); Wilcoxon rank‐sum test P = 0.3, not significant. Block 7 with column “w/o B7” represents the results obtained from promoters without block 7 sequence. Developmental and constitutive promoters are highlighted in green and red, respectively. The middle hinge represents the median. The interquartile range the difference between the 75th and 25th percentiles. Individual points represent values over 1.5 times the interquartile range. 3–4 biological replicate measurements.

Consensus replacement. Heatmap depicting the mean expression fold changes compared to wild‐type expressions after replacing with motif consensus sequences derived by XXmotif. Constitutive and developmental promoters are highlighted in red and green, respectively.
Heatmap depicting the mean expression fold changes compared to wild‐type expressions after replacing consensus insertion into motif‐less core promoters.
Boxplots depicting log expression change and significance level upon inserting consensus motifs of INR, INR2, and Ohler7 motifs (columns in A) into the core promoters (rows in A). Left panel: INR into CG15674 (two‐sample t‐test **P = 0.0033); middle panel: INR2 into CG10915 and CG15674 (Wilcoxon rank‐sum test ***P = 0.00018); right panel: Ohler7 into Geminin, CG10915, and CG15674 (Wilcoxon rank‐sum test ****P = 3.4 × 10⁻⁵). The middle hinge represents the median. The interquartile range the difference between the 75th and 25th percentiles. Individual points represent values over 1.5 times the interquartile range. 3–4 biological replicate measurements.
Heatmap depicting the mean expression fold changes compared to wild‐type expressions for motif knockout and substitution with positionally or functionally equivalent motifs from other architectures. Constitutive and developmental promoters are highlighted in red and green, respectively.
Boxplot depicting the effects of INR being substituted by INR2 in cas and CG8157 (all measurements in these two core promoter constructs were pooled together; Wilcoxon rank‐sum test **P = 0.0051 for comparing substitution with knockout (significant) and P = 0.17 for comparing substitution with wild‐type (not significant). The middle hinge represents the median. The interquartile range the difference between the 75th and 25th percentiles. 3–4 biological replicate measurements.

left panel: effect on expression of the single point mutation compared to the consensus sequence (indicated as dots whose size scales with the loss of expression after mutation). Middle and right panels: comparison of the XXmotif logos with the expression‐based activity logos for INR, TATA‐Box, INR2, DRE, and Ohler7. Expression‐based activity logos show an overall lower specificity. IC, information content.
Effect of motif positional shifts. log2 expression of native promoters (cyan dots) and promoters with motifs shifted relative to their original locations (red dots), for INR, MTEDPE, TATA‐Box in cas, and DRE, Ohler7 in RpL36A.
Motif occurrence around TSS (at position 0) discovered in the genome‐wide analysis by XXmotif. The blue rectangular boxes indicate the −20 to 20 bp region surrounding the original positions of the motifs in the tested core promoters (strictly positioned INR, MTEDPE, TATA‐Box in cas; broadly distributed DRE, Ohler7 in RpL36A).

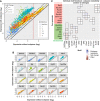
Scatterplot depicting the expression measurements with ecdysone induction versus measurements without ecdysone for all tested promoters separated by promoter architecture (Fig EV3c). Each color represents one architecture (color‐code indicated in the insert). Three types of line are used to indicate the expression fold change with no increase (y = x; solid line), 2‐fold increase (y = x + 1; dotted line), and 4‐fold increase (y = x + 2; dashed line). Red vertical dashed line: log2 basal expressions = 2. Log2 expressions > 2 on the right of the red dotted line.
Expression fold changes (ecdysone inducibility) versus measurements without ecdysone and grouped by native core promoter sequences. The colors refer to different core promoter architectures. Three types of line are used to indicate the expression fold change with no increase (y = x; solid line), 2‐fold increase (y = x + 1; dotted line), and 4‐fold increase (y = x + 2; dashed line). Red vertical dashed line: log2 basal expressions = 2.
Heatmap depicting the ecdysone inducibility fold changes caused by individual knockout of motifs in different core promoters. Disrupted INR (highlighted with the black dotted line rectangle) had a slightly negative effect on changing the core promoter responsiveness to ecdysone. (~2.3‐fold reduction on average, Wilcoxon rank‐sum test P = 2.1 × 10⁻⁵). Constitutive and developmental promoters highlighted in red and green, respectively.

Scatterplot depicting the expression measurements with ecdysone induction versus measurements without ecdysone for all tested promoters separated by core promoter architectures. Constitutive and developmental promoters are plotted in red and green, respectively. Three types of line are used to indicate the expression fold change with no increase (y = x; solid line), 2‐fold increase (y = x + 1; dotted line), and 4‐fold increase (y = x + 2; dashed line). Log2 expressions > 2 on the right of the red dotted line.
Comparison of the expression fold changes versus measurement values without ecdysone for all native promoters and their mutated versions, grouped by native core promoter sequences. The colors refer to different core promoter architectures. Three types of line are used to indicate the expression fold change with no increase (y = x; solid line), 2‐fold increase (y = x + 1; dotted line), and 4‐fold increase (y = x + 2; dashed line).
Comparison of the PCC rs obtained in A grouped by constitutive and developmental core promoters. Wilcoxon rank‐sum test P = 0.0054. The middle hinge represents the median. The interquartile range the difference between the 75th and 25th percentiles. Individual points represent values over 1.5 times the interquartile range. 3–4 biological replicate measurements.
Heatmap depicting the ecdysone inducibility fold changes caused by consensus replacement of motifs in different core promoters. Constitutive and developmental promoters highlighted in red and green, respectively.
References
-
- Adams MD, Celniker SE, Holt RA, Evans CA, Gocayne JD, Amanatides PG, Scherer SE, Li PW, Hoskins RA, Galle RF et al (2000) The genome sequence of Drosophila melanogaster . Science 287: 2185–2195. - PubMed
-
- Arnold CD, Gerlach D, Stelzer C, Boryń ŁM, Rath M, Stark A (2013) Genome‐wide quantitative enhancer activity maps identified by STARR‐seq. Science 339: 1074–1077 - PubMed
-
- Brodu V, Mugat B, Fichelson P, Lepesant JA, Antoniewski C (2001) A UAS site substitution approach to the in vivo dissection of promoters: interplay between the GATAb activator and the AEF‐1 repressor at a Drosophila ecdysone response unit. Development 128: 2593–2602 - PubMed
Publication types
MeSH terms
LinkOut - more resources
Full Text Sources
Molecular Biology Databases

