. 2022 Feb 14:11:e73796.
doi: 10.7554/eLife.73796.

Multiomic characterization of pancreatic cancer-associated macrophage polarization reveals deregulated metabolic programs driven by the GM-CSF-PI3K pathway

Affiliations

Multiomic characterization of pancreatic cancer-associated macrophage polarization reveals deregulated metabolic programs driven by the GM-CSF-PI3K pathway

Seth Boyer et al. Elife. .

Abstract

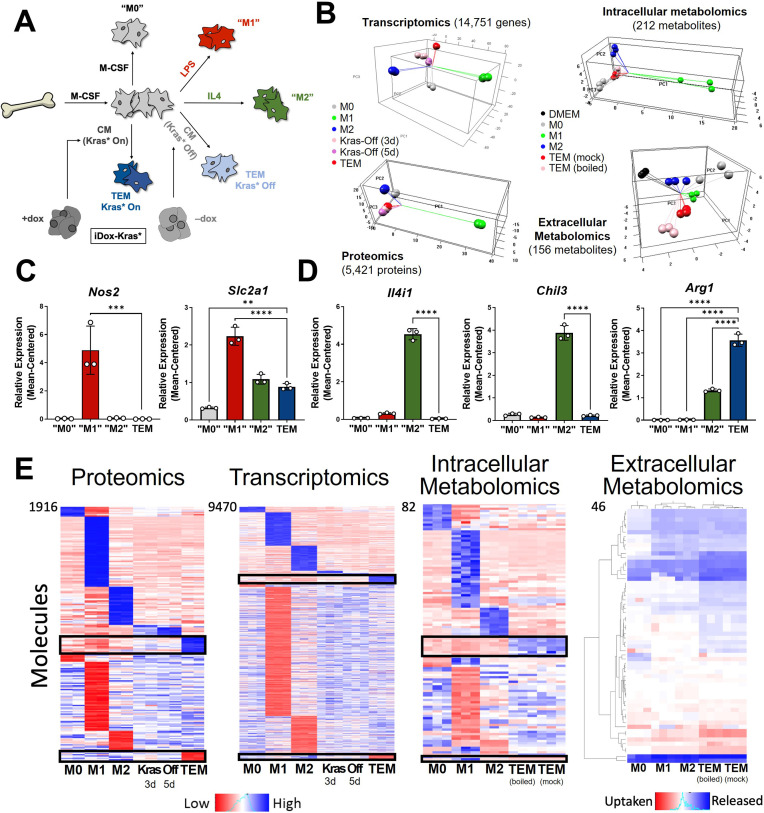
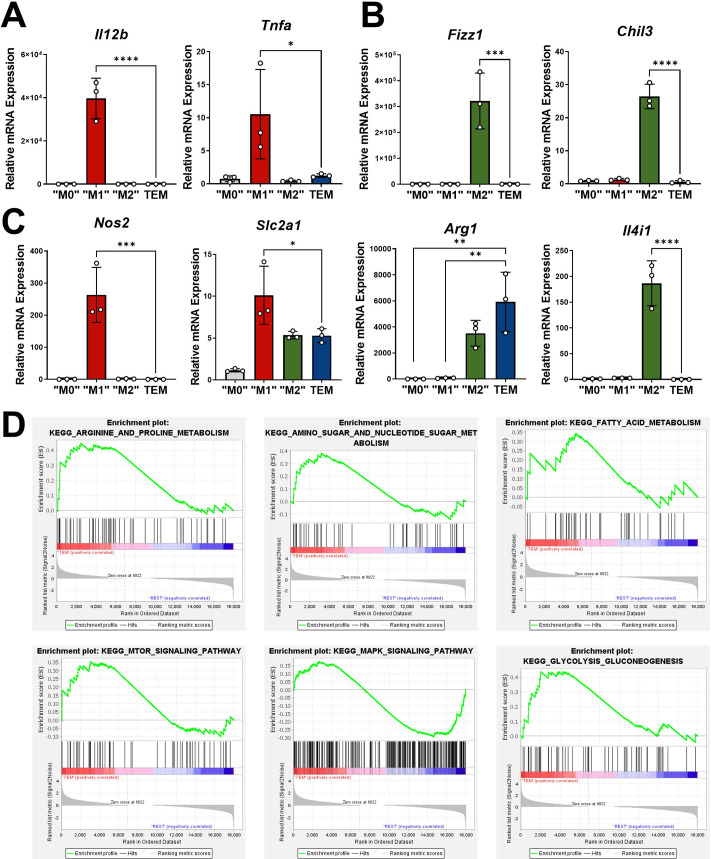
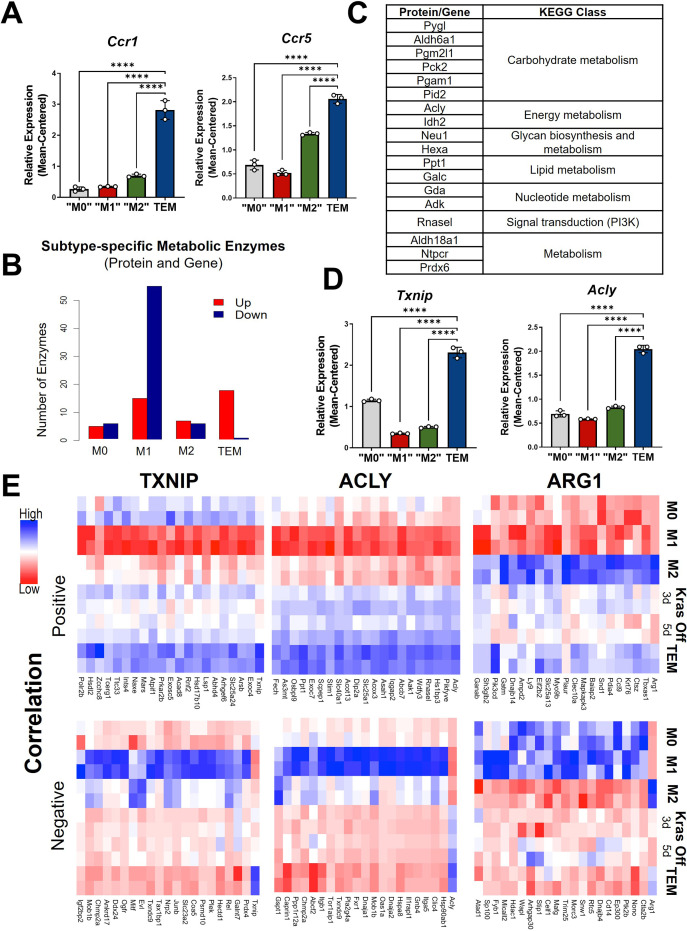
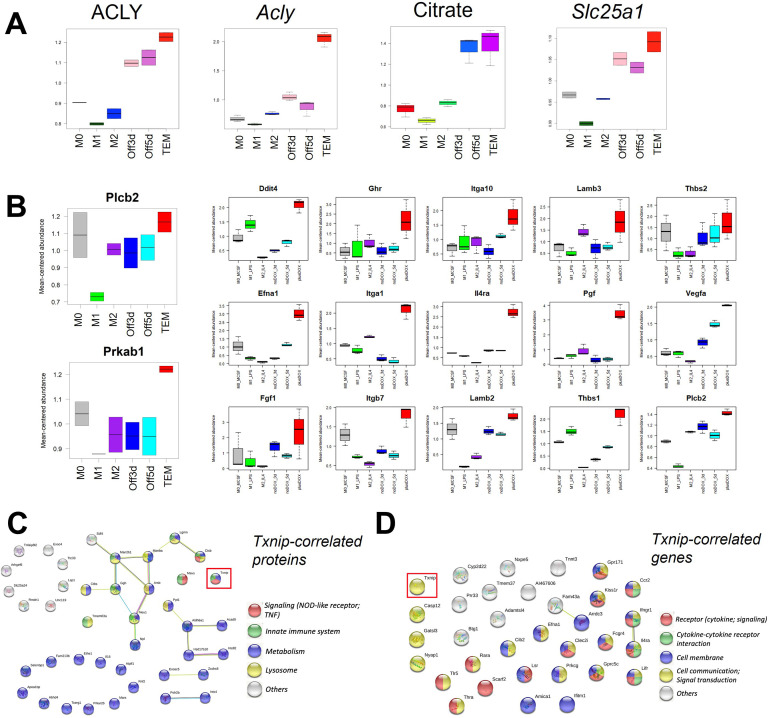
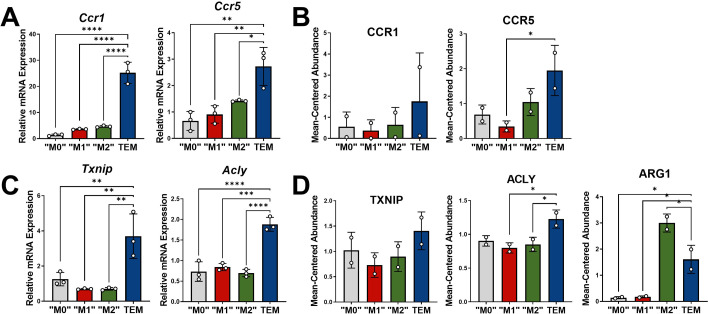
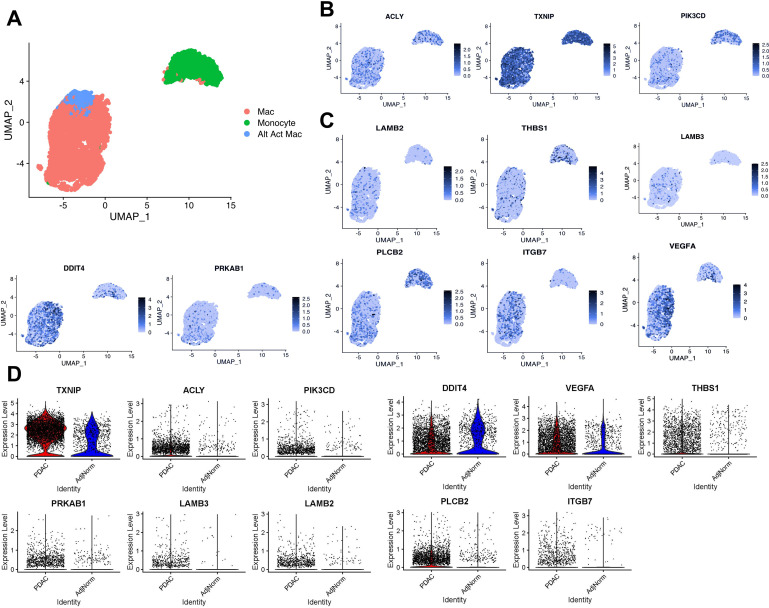
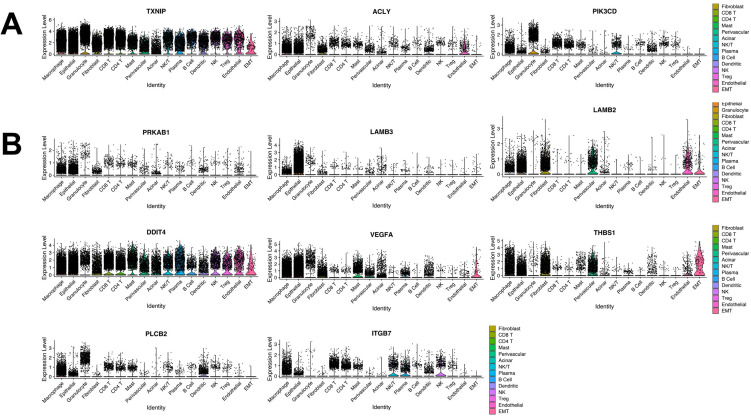
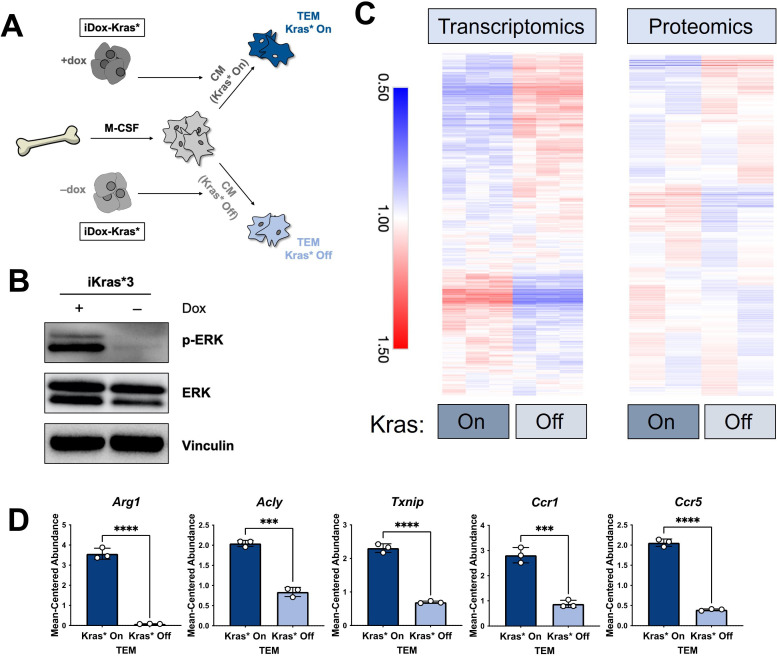
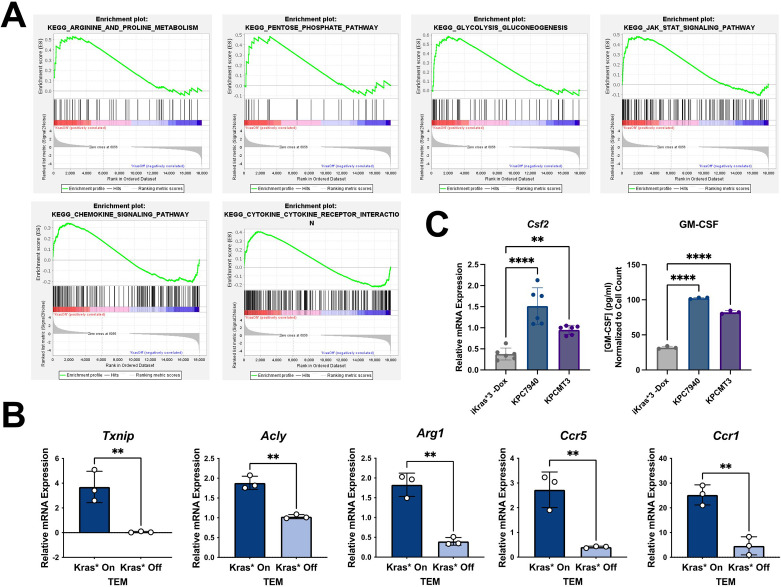
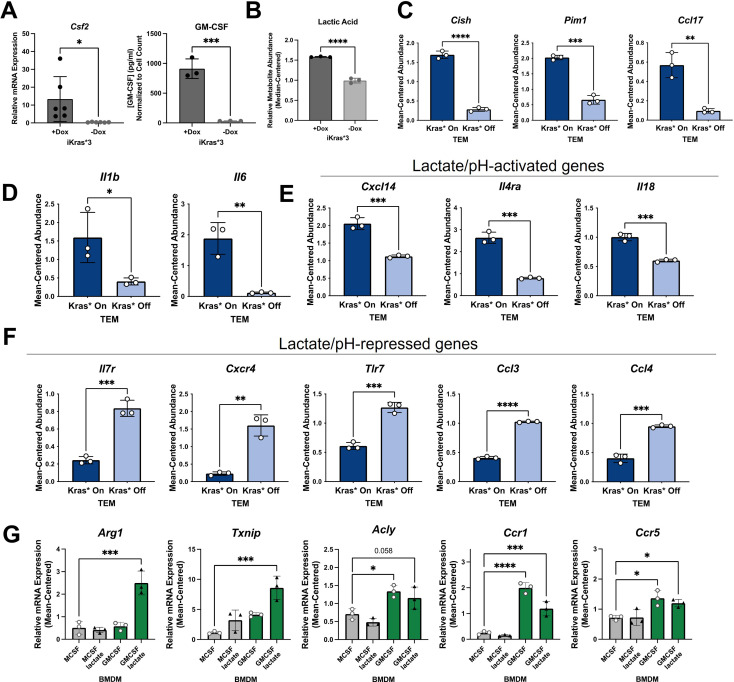
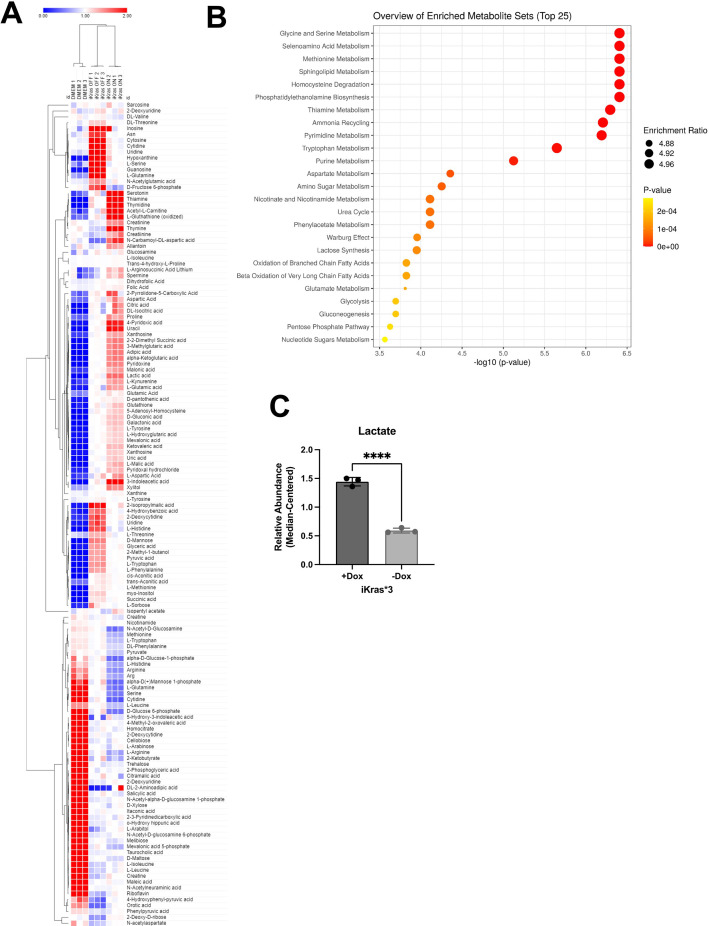
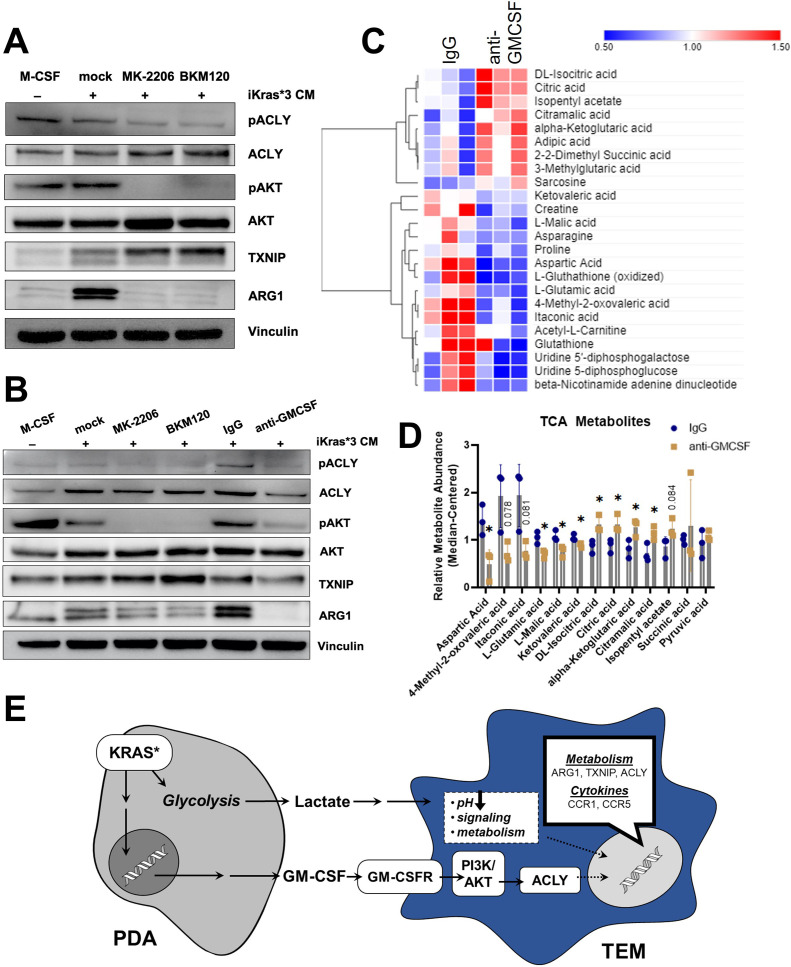
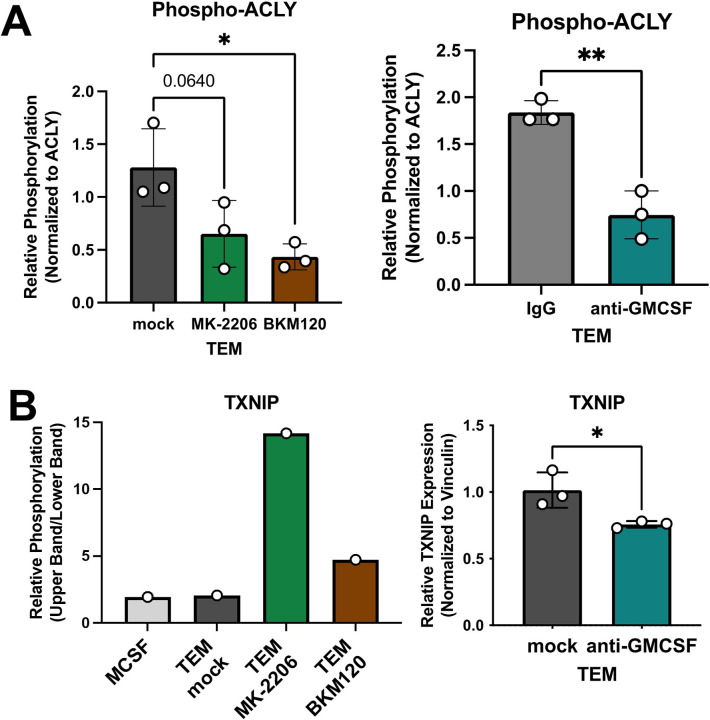
The pancreatic ductal adenocarcinoma microenvironment is composed of a variety of cell types and marked by extensive fibrosis and inflammation. Tumor-associated macrophages (TAMs) are abundant, and they are important mediators of disease progression and invasion. TAMs are polarized in situ to a tumor promoting and immunosuppressive phenotype via cytokine signaling and metabolic crosstalk from malignant epithelial cells and other components of the tumor microenvironment. However, the specific distinguishing features and functions of TAMs remain poorly defined. Here, we generated tumor-educated macrophages (TEMs) in vitro and performed detailed, multiomic characterization (i.e., transcriptomics, proteomics, metabolomics). Our results reveal unique genetic and metabolic signatures of TEMs, the veracity of which were queried against our in-house single-cell RNA sequencing dataset of human pancreatic tumors. This analysis identified expression of novel, metabolic TEM markers in human pancreatic TAMs, including ARG1, ACLY, and TXNIP. We then utilized our TEM model system to study the role of mutant Kras signaling in cancer cells on TEM polarization. This revealed an important role for granulocyte-macrophage colony-stimulating factor (GM-CSF) and lactate on TEM polarization, molecules released from cancer cells in a mutant Kras-dependent manner. Lastly, we demonstrate that GM-CSF dysregulates TEM gene expression and metabolism through PI3K-AKT pathway signaling. Collectively, our results define new markers and programs to classify pancreatic TAMs, how these are engaged by cancer cells, and the precise signaling pathways mediating polarization.

Keywords: cancer biology; human; immunology; inflammation; metabolomics; mouse; pancreatic cancer; proteomics; tumor-associated macrophages.


Conflict of interest statement

SB, HL, NS, LZ, PS, AA, MW, RS, VB, YZ, AN, MP, CH No competing interests declared, CL CAL has received consulting fees from Astellas Pharmaceuticals and Odyssey Therapeutics and is an inventor on patents pertaining to Kras regulated metabolic pathways, redox control pathways in pancreatic cancer, and targeting the GOT1-pathway as a therapeutic approach (US Patent No: 2015126580-A1, 05/07/2015; US Patent No: 20190136238, 05/09/2019; International Patent No: WO2013177426-A2, 04/23/2015)

Figures

Figure 1.
Figure 1.. In vitro modeling and characterization of pancreatic tumor-educated macrophages (TEMs).
(A) Schematic of bone marrow-derived macrophage (BMDM) differentiation and polarization. (B) Left: principal component analysis of transcriptomics and proteomics of BMDMs treated with macrophage colony-stimulating factor (M-CSF; M0), lipopolysaccharide (LPS; M1), interleukin-4 (IL4; M2), or conditioned media from Kras-Off (3 or 5 days) or Kras-On (TEM) pancreatic ductal adenocarcinoma (PDA) cells; right: intracellular and extracellular metabolomics from media (Dulbecco’s modified Eagle medium, DMEM + 10% FBS), M0, M1, M2, or TEM (Kras-On media was mock treated or boiled before TEM culture). Transcriptomics and metabolomics samples were collected in biological triplicate; proteomics in biological duplicate. (C) RNA sequencing (RNA-seq)-measured mean-centered expression of classical M1 genes Nos2 and Slc2a1 across M0, M1, M2, and TEM phenotypes; n = 3. (D) RNA-seq-measured mean-centered expression of classical M2 genes Il4i1, Chil3, and Arg1 across M0, M1, M2, and TEM phenotypes; n = 3. (E) Heat map array of differential markers of each subtype from proteomics (1916 proteins), transcriptomics (9470 transcript), and intracellular (82 metabolites) and extracellular (46 metabolites) metabolomics. We highlight TEM markers in the black boxes. Error bars in (C) and (D) are mean ± standard deviation (SD); significance comparisons are relative to TEM subtype and were calculated using one-way analysis of variance (ANOVA) with Dunnett’s post hoc test; **p < 0.01, ***p < 0.001, ****p < 0.0001.
Figure 1—figure supplement 1.
Figure 1—figure supplement 1.. Transcriptomic analyses of macrophages markers.
(A) Quantitative polymerase chain reaction (qPCR) of classic M1 markers Il12b and Tnfa in M0, M1, M2, and tumor-educated macrophage (TEM) subtypes; n = 3. (B) qPCR of classic M2 markers Fizz1, Chil3, Arg1, and Il4i1 in M0, M1, M2, and TEM subtypes; n = 3. (C) qPCR of Nos2 and Slc2a1 in M0, M1, M2, and TEM subtypes; n = 3. (D) Gene set enrichment analysis (GSEA) plots of metabolic pathways selectively upregulated in TEMs. Error bars are mean ± standard deviation (SD); significance comparisons are relative to TEM subtype and were calculated using one-way analysis of variance (ANOVA) with Dunnett’s post hoc test; *p < 0.05, **p < 0.01, ***p < 0.001, ****p < 0.0001.
Figure 2.
Figure 2.. Metabolism and cytokine signaling are distinctive features of pancreatic tumor-educated macrophages (TEMs).
(A) RNA sequencing (RNA-seq) mean-centered expression of TEM cytokine-related signatures, Ccr1 and Ccr5; n = 3. (B) A bar plot of the numbers of up- and downregulated markers that are metabolic enzymes, present in both protein and gene analyses, for each subtype. (C) Table of 18 upregulated TEM markers from B and their corresponding KEGG (Kyoto Encyclopedia of Genes and Genomes) class. Note Acly as an enzyme of interest. (D) RNA-seq-measured mean-centered expression of TEM enzyme signatures Txnip and Acly; n = 3. (E) Heat map of the top 20 positively and negatively correlated proteins from the proteomics data for TXNIP, ACLY, and ARG1. Error bars in (A) and (D) are mean ± standard deviation (SD); significance comparisons are relative to TEM subtype and were calculated using one-way analysis of variance (ANOVA) with Dunnett’s post hoc test; ****p < 0.0001.
Figure 2—figure supplement 1.
Figure 2—figure supplement 1.. Transcriptomic and proteomic analyses of macrophage markers.
(A) Quantitative polymerase chain reaction (qPCR) of tumor-educated macrophage (TEM) cytokine signatures Ccr1 and Ccr5 in M0, M1, M2, and TEM subtypes; n = 3. (B) Proteomics mean-centered abundance of CCR1 and CCR5 in M0, M1, M2, and TEM subtypes; n = 2. (C) qPCR of TEM markers Txnip and Acly in M0, M1, M2, and TEM subtypes; n = 3. (D) Proteomics mean-centered abundance of TXNIP, ACLY, and ARG1 in M0, M1, M2, and TEM subtypes; n = 2. Error bars are mean ± standard deviation (SD).
Figure 2—figure supplement 2.
Figure 2—figure supplement 2.. Multiomic pathway analyses.
(A) Proteomics and transcriptomics box plot of Acly, metabolomics box plot of citrate, and transcriptomics box plot of Slc25a1 for M0, M1, M2, Kras-Off 3 days, Kras-Off 5 days, and Kras-On tumor-educated macrophage (TEM) subtypes. (B) Proteomics box plots of PLCB2 and PRKAB1 and transcriptomics box plots of 15 PI3K-related genes. (C) STRING-based pathway analysis of Txnip-correlated proteins in TEM. (D) STRING-based pathway analysis of Txnip-correlated genes in TEM. *‘Off3/5d’ = ‘noDOX_3/5d’ = Kras-Off TEM subtype; ‘plusDOX’ = Kras-On TEM subtype. Error bars are mean ± standard deviation (SD), significance comparisons are relative to TEM subtype and were calculated using one-way analysis of variance (ANOVA) with Dunnett’s post hoc test; Significance comparisons are relative to TEM subtype and were calculated using one-way analysis of variance (ANOVA) with Dunnett’s post hoc test; *p < 0.05, **p < 0.01, ***p < 0.001, ****p < 0.0001.
Figure 3.
Figure 3.. Expression of tumor-educated macrophage (TEM) markers in human pancreatic tumor-associated macrophages.
(A) UMAP plot of myeloid populations in a human pancreatic tumor. (B) UMAP plots of TEM markers ACLY, TXNIP, and PI3KCD in human pancreatic tumor-associated macrophages (TAMs). (C) UMAP plots of PI3K-related genes expressed in human pancreatic TAMs (DDIT4, PRKAB1, LAMB3, LAMB2, THBS1, VEGFA, PLCB2, and ITGB7). (D) Expression of murine pancreatic TEM markers in macrophages from human tumors (pancreatic ductal adenocarcinoma [PDAC] TAMs) compared to macrophages from adjacent ‘normal’ tissue (AdjNorm), as analyzed by single-cell RNA sequencing.
Figure 3—figure supplement 1.
Figure 3—figure supplement 1.. Expression of pancreatic tumor-educated macrophage (TEM) markers in human tumors.
(A) Violin plots of TEM markers Txnip, Acly, and Pik3cd expressed in human pancreatic tumors. (B) Violin plots of PI3K-related genes expressed in human pancreatic tumors (Prkab1, Lamb3, Lamb2, Ddit4, Vegfa, Thbs1, Plcb2, and Itgb7).
Figure 4.
Figure 4.. The polarization of pancreatic tumor-educated macrophages (TEMs) is dependent on mutant Kras signaling in pancreatic cancer cells.
(A) Schematic of bone marrow-derived macrophage (BMDM) differentiation, iKras*3 cell Kras-On and Kras-Off conditioned media generation, and Kras-On and Kras-Off TEM polarization. (B) Western blot of MAPK pathway proteins ERK and pERK in Kras-expressing and 5-day Kras-extinguished iKras*3 cells. (C) Transcriptomics and proteomics heat maps of the differential markers in Figure 1E for Kras-On and 5-day Kras-Off TEMs. (D) RNA sequencing (RNA-seq)-measured mean-centered expression of TEM signatures Arg1, Acly, Txnip, Ccr1, and Ccr5; n = 3. Error bars are mean ± standard deviation (SD); significance was calculated using using a Student’s t-test; ***p < 0.001, ****p < 0.0001.
Figure 4—figure supplement 1.
Figure 4—figure supplement 1.. Regulation of tumor-educated macrophage (TEM) gene expression by mutant Kras in pancreatic ductal adenocarcinoma (PDA) cells.
(A) Gene set enrichment analysis (GSEA) of pancreatic TEMs plus or minus Kras expression (doxycycline, dox) for 5 days. (B) Quantitative polymerase chain reaction (qPCR) validation of TEM enzyme and cytokine markers Txnip, Acly, Arg1, Ccr5, and Ccr1 in Kras-On vs Kras-Off TEMs; n = 3. (C) qPCR of Csf2 expression (n = 6) and ELISA of granulocyte–macrophage colony-stimulating factor (GM-CSF) release (n = 3) in Kras-extinguished iKras*3 cells and two KPC PDA lines, KPC-MT3 and KPC7940. Error bars are mean ± standard deviation (SD); in (C), significance values were calculated using a Student’s t-test; in C, comparisons are relative to TEM subtype and significance was calculated using one-way analysis of variance (ANOVA) with Dunnett’s post hoc test; **p < 0.01, ****p < 0.0001.
Figure 5.
Figure 5.. Kras in pancreatic ductal adenocarcinoma (PDA) polarizes pancreatic tumor-educated macrophages (TEMs) by way of granulocyte–macrophage colony-stimulating factor (GM-CSF) and lactate.
(A) Quantitative polymerase chain reaction (qPCR) measurement of Csf2 expression and ELISA for GM-CSF release; n = 3 in murine PDA cell line iKras*3. (B) Liquid chromatography (LC)/mass spectrometry (MS)-measured extracellular lactate abundance from Kras-expressing and -extinguished iKras*3 cells plotted as median-centered values; n = 3. (C) RNA sequencing (RNA-seq)-measured expression of myeloid GM-CSF-responsive genes, Cish, Pim1, and Ccl17 in Kras-On and Kras-Off TEMs; n = 3. (D) RNA-seq-measured expression of lactate-responsive genes, Il1b and Il6 in Kras-On and Kras-Off TEMs; n = 3. (E, F) RNA-seq-measured expression of genes responsive to acidic extracellular pH in Kras-On and Kras-Off TEMs; n = 3. (G) qPCR-measured expression of TEM markers Arg1, Txnip, Acly, Ccr1, and Ccr5 in M0 macrophages treated with either lactate, GM-CSF, or the combination; n = 3. Error bars are mean ± standard deviation (SD); significance values in (A–F) were calculated using a Student’s t-test; in (G), comparisons are relative to TEM subtype, and significance was calculated using one-way analysis of variance (ANOVA) with Dunnett’s post hoc test; *p < 0.05; **p < 0.01, ***p < 0.001, ****p < 0.0001.
Figure 5—figure supplement 1.
Figure 5—figure supplement 1.. Effects of mutant Kras on extracellular metabolism in pancreatic ductal adenocarcinoma (PDA) cells.
(A) Heat map of significant (p < 0.01) extracellular metabolites released from Kras-expressing vs. Kras-extinguished iKras*3 cells. (B) Enrichment analysis of Kras-expressing vs. Kras-extinguished iKras*3 extracellular metabolomics. (C) Extracellular lactate abundance from iKras*3 cells ± doxycycline (dox) as measured by enzymatic fluorescence assay; n = 3. Error bars are mean ± standard deviation (SD), significance values were calculated using a Student’s t-test; ****p < 0.0001.
Figure 6.
Figure 6.. Pancreatic ductal adenocarcinoma (PDA)-derived granulocyte–macrophage colony-stimulating factor (GM-CSF) promotes tumor-educated macrophage (TEM) polarization and dictates their metabolism through the PI3K–AKT pathway.
(A) Western blot of pACLY/ACLY, pAKT/AKT, TXNIP, and ARG1 in bone marrow-derived macrophages (BMDMs) treated with either macrophage colony-stimulating factor (M-CSF), iKras*3 cell-conditioned media + vehicle, iKras*3 cell-conditioned media + pan AKT inhibitor MK-2206, or iKras*3 cell-conditioned media + pan-PI3K inhibitor BKM120. (B) Western blot of pACLY/ACLY, pAKT/AKT, TXNIP, and ARG1 in BMDMs treated with either M-CSF, iKras*3 cell-conditioned media + vehicle, iKras*3 cell-conditioned media + MK-2206, iKras*3 cell-conditioned media + BKM120, iKras*3 cell-conditioned media + IgG control, or iKras*3 cell-conditioned media + GM-CSF-neutralizing antibody. (C) Heat map of differentially abundant metabolites in TEMs treated with either anti-GM-CSF or IgG control; n = 3. (D) Bar graph of TCA and related metabolites in TEMs treated with either anti-GM-CSF or IgG control; n = 3. (E) Schematic of TEM polarization model. Replicates and quantitation of the westerns in (A, B) are presented in Figure 6—figure supplement 1A. Error bars are mean ± standard deviation (SD); significance was calculated using a Student’s t-test; *p < 0.05.
Figure 6—figure supplement 1.
Figure 6—figure supplement 1.. Granulocyte–macrophage colony-stimulating factor (GM-CSF) neutralization disrupts the tumor-educated macrophage (TEM) metabolic phenotype.
(A) Bar graphs of pACLY quantitation relative to ACLY expression in TEM mock, MK-2206, BKM120, IgG, and anti-GM-CSF groups; quantitated from three independently prepared westerns. Representative westerns in Figure 6. (B) Bar graphs of TXNIP phosphorylation quantitation from Figure 6A (left) and TXNIP expression quantitation in TEM mock, IgG, and anti-GM-CSF groups; latter are quantitated from three independently prepared westerns. Error bars are mean ± standard deviation (SD); significance for comparison between two groups was performed using the Student’s t-test; significance for comparisons with three groups is relative to TEM subtype and were calculated using one-way analysis of variance (ANOVA) with Tukey’s post hoc; *p < 0.05, **p < 0.01.

Similar articles

Cited by

References

    1. Aldinucci D, Borghese C, Casagrande N. The CCL5/CCR5 Axis in Cancer Progression. Cancers. 2020;12:E1765. doi: 10.3390/cancers12071765. - DOI - PMC - PubMed
    1. Arlauckas SP, Garren SB, Garris CS, Kohler RH, Oh J, Pittet MJ, Weissleder R. Arg1 expression defines immunosuppressive subsets of tumor-associated macrophages. Theranostics. 2018;8:5842–5854. doi: 10.7150/thno.26888. - DOI - PMC - PubMed
    1. Baardman J, Verberk SGS, van der Velden S, Gijbels MJJ, van Roomen C, Sluimer JC, Broos JY, Griffith GR, Prange KHM, van Weeghel M, Lakbir S, Molenaar D, Meinster E, Neele AE, Kooij G, de Vries HE, Lutgens E, Wellen KE, de Winther MPJ, Van den Bossche J. Macrophage ATP citrate lyase deficiency stabilizes atherosclerotic plaques. Nature Communications. 2020;11:6296. doi: 10.1038/s41467-020-20141-z. - DOI - PMC - PubMed
    1. Balkwill FR, Mantovani A. Cancer-related inflammation: common themes and therapeutic opportunities. Seminars in Cancer Biology. 2012;22:33–40. doi: 10.1016/j.semcancer.2011.12.005. - DOI - PubMed
    1. Bayne LJ, Beatty GL, Jhala N, Clark CE, Rhim AD, Stanger BZ, Vonderheide RH. Tumor-derived granulocyte-macrophage colony-stimulating factor regulates myeloid inflammation and T cell immunity in pancreatic cancer. Cancer Cell. 2012;21:822–835. doi: 10.1016/j.ccr.2012.04.025. - DOI - PMC - PubMed

Publication types

MeSH terms

Substances

Associated data