

Cox regression is robust to inaccurate EHR-extracted event time: an application to EHR-based GWAS
- PMID: 35157022
- PMCID: PMC10060718
- DOI: 10.1093/bioinformatics/btac086
Cox regression is robust to inaccurate EHR-extracted event time: an application to EHR-based GWAS
Abstract
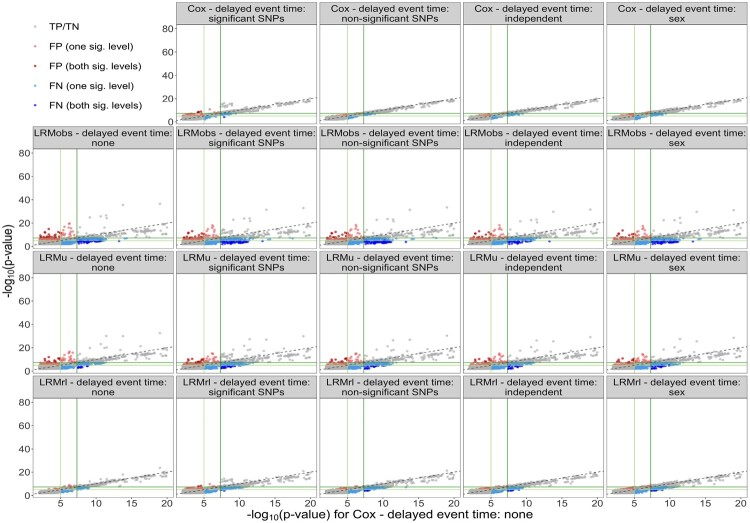
Motivation: Logistic regression models are used in genomic studies to analyze the genetic data linked to electronic health records (EHRs), and do not take full usage of the time-to-event information available in EHRs. Previous work has shown that Cox regression, which can account for left truncation and right censoring in EHRs, increased the power to detect genotype-phenotype associations compared to logistic regression. We extend this to evaluate the relative performance of Cox regression and various logistic regression models in the presence of positive errors in event time (delayed event time), relating to recorded event time accuracy.
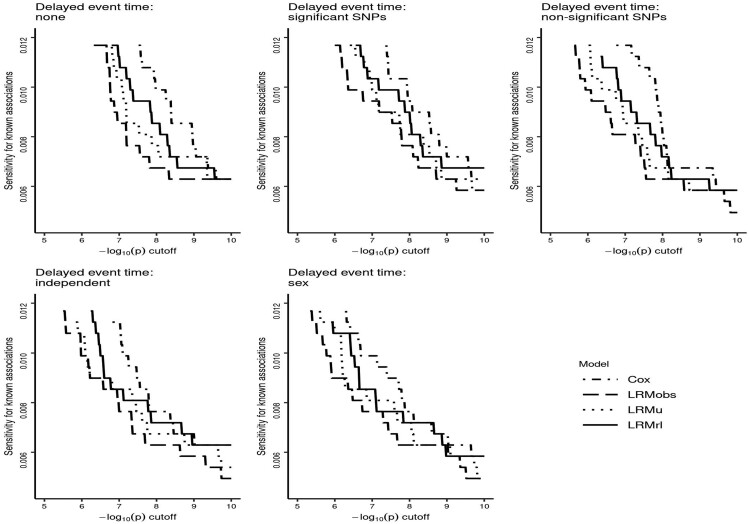
Results: One Cox model and three logistic regression models were considered under different scenarios of delayed event time. Extensive simulations and a genomic study application were used to evaluate the impact of delayed event time. While logistic regression does not model the time-to-event directly, various logistic regression models used in the literature were more sensitive to delayed event time than Cox regression. Results highlighted the importance to identify and exclude the patients diagnosed before entry time. Cox regression had similar or modest improvement in statistical power over various logistic regression models at controlled type I error. This was supported by the empirical data, where the Cox models steadily had the highest sensitivity to detect known genotype-phenotype associations under all scenarios of delayed event time.
Availability and implementation: Access to individual-level EHR and genotype data is restricted by the IRB. Simulation code and R script for data process are at: https://github.com/QingxiaCindyChen/CoxRobustEHR.git.
Supplementary information: Supplementary data are available at Bioinformatics online.
© The Author(s) 2022. Published by Oxford University Press. All rights reserved. For permissions, please e-mail: journals.permissions@oup.com.
Figures


Similar articles
-
Evaluating statistical approaches to leverage large clinical datasets for uncovering therapeutic and adverse medication effects.Bioinformatics. 2018 Sep 1;34(17):2988-2996. doi: 10.1093/bioinformatics/bty306. Bioinformatics. 2018. PMID: 29912272 Free PMC article.
-
Cox proportional hazards models have more statistical power than logistic regression models in cross-sectional genetic association studies.Eur J Hum Genet. 2008 Sep;16(9):1111-6. doi: 10.1038/ejhg.2008.59. Epub 2008 Apr 2. Eur J Hum Genet. 2008. PMID: 18382476
-
ADuLT: An efficient and robust time-to-event GWAS.Nat Commun. 2023 Sep 9;14(1):5553. doi: 10.1038/s41467-023-41210-z. Nat Commun. 2023. PMID: 37689771 Free PMC article.
-
G2P: a Genome-Wide-Association-Study simulation tool for genotype simulation, phenotype simulation and power evaluation.Bioinformatics. 2019 Oct 1;35(19):3852-3854. doi: 10.1093/bioinformatics/btz126. Bioinformatics. 2019. PMID: 30848784
-
Adult patient access to electronic health records.Cochrane Database Syst Rev. 2021 Feb 26;2(2):CD012707. doi: 10.1002/14651858.CD012707.pub2. Cochrane Database Syst Rev. 2021. PMID: 33634854 Free PMC article.
Cited by
-
Subgroup State Prediction under Different Noise Levels Using MODWT and XGBoost.J Healthc Eng. 2023 Jan 31;2023:6406275. doi: 10.1155/2023/6406275. eCollection 2023. J Healthc Eng. 2023. PMID: 36760834 Free PMC article.
References
-
- Barron B.A. (1977) The effects of misclassification on the estimation of relative risk. Biometrics, 33, 414–418. - PubMed
-
- Cook J.R., Stefanski L.A. (1994) Simulation-extrapolation estimation in parametric measurement error models. J. Am. Stat. Assoc., 89, 1314–1328.
