. 2022 Apr 1;71(2):124-131.
doi: 10.1093/jmicro/dfac005.

Serial ultrathin sections to identify ultrastructural localization of GLUT1 molecules in vesicles in brain endothelial cells-correlative light and electron microscopy in depth

Affiliations

Serial ultrathin sections to identify ultrastructural localization of GLUT1 molecules in vesicles in brain endothelial cells-correlative light and electron microscopy in depth

Akane Yamada et al. Microscopy (Oxf). .

Abstract

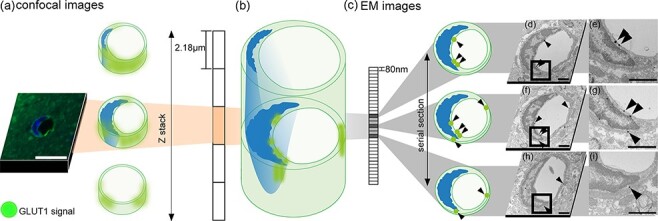
Precise immunolocalization of molecules in relation to ultrastructural features is challenging, especially when the target is small and not frequent enough to be included in tiny ultrathin sections randomly selected for electron microscopy (EM). Glucose transporter 1 (GLUT1) is in charge of transporting glucose across brain capillary endothelial cells (BCECs). Paraformaldehyde-fixed floating sections (50 μm thick) of mouse brain were immunolabeled with anti-GLUT1 antibody and visualized with fluoronanogold. Fluorescent images encompassing the entire hemisphere were tiled to enable selection of GLUT1-positive BCECs suitable for subsequent EM and landmark placement with laser microdissection to guide trimming. Sections were then fixed with glutaraldehyde, gold enhanced to intensify the labeling and fixed with osmium tetroxide to facilitate ultrastructural recognition. Even though a region that contained target BCECs was successfully trimmed in the resin block, it was only after observation of serial ultrathin sections that GLUT1 signals in coated vesicles on the same cross section corresponding to the cross section preidentified by confocal laser microscope. This is the first ultrastructural demonstration of GLUT1 molecules in coated vesicles, which may well explain its functional relevance to transport glucose across BCECs. Successful ultrastructural localization of molecules in relation to well-preserved target structure in native tissue samples, as achieved in this study, will pave the way to understand the functional relevance of molecules and their relation to ultrastructural details.

Keywords: CLEM; GLUT1; blood–brain barrier; coated vesicle; pre-embedding method; serial section.


Figures

Fig. 1.
Fig. 1.
Pre-absorption test of polyclonal anti-GLUT1 antibody by western blot analysis. The GLUT1 band was strongly detected in normal mouse brain lysate with anti-GLUT1 antibody (left lane). The band was not detected after pre-incubation of the anti-GLUT1 antibody with GLUT1 peptide (right lane).
Fig. 2.
Fig. 2.
Pre-absorption test of anti-GLUT1 antibody by immunohistochemistry. (a) Capillary vessel walls in a mouse brain were stained with the antibody. (b) Intensity of the GLUT1 immunostaining in the capillary was greatly decreased after pre-incubation with GLUT1 peptide. The inset images are a higher magnification of the rectangles in the main image. Scale bars = 50 µm in main image; 5 µm in inset image.
Fig. 3.
Fig. 3.
Successive steps for obtaining fluorescent immunostained microscopic images of the GLUT1 signal in a cross section of a capillary in a mouse cerebral cortex. (a) Snapshots captured with a 40× objective lens were tiled to cover the entire hemisphere. Scale bar = 1 mm. (b) A region of interest (ROI; white square) was set in the integrated light image (14 901 × 16 778 pixels, 0.4 µm/pixel). Scale bar = 1 mm. (c) CLSM images of the ROI with 21 XY planes at 1-µm intervals were simultaneously captured. (d) One CLSM image including a cross section of a BCEC was chosen, and this BCEC cross-section was set as a new square ROI (0.262 µm/pixel, 4622 × 4622 pixels). Scale bar = 200 µm. (e) After laser marking, CLSM images of the new ROI with 44 XY planes at 1-µm intervals were obtained. (f) A single optical section including the target BCEC cross section and laser marking is shown. Scale bar = 50 µm. (g) A representative CLSM image of a BCEC cross section is shown. Scale bar = 10 µm. The green fluorescence represents anti-GLUT1 antibody/Alexa Fluor 488 FluoroNanogold-Fab’ anti-Rabbit IgG, whereas the blue represents 4ʹ,6-diamidino-2-phenylindole (DAPI; a marker of nuclear DNA).
Fig. 4.
Fig. 4.
Effect of anti-GLUT1 antibody concentration on the amount of immunoEM signals. Without the primary antibody, GLUT1 signals were rarely observed (a, d). Electron micrograph showed that, at higher primary antibody concentration, labeling of GLUT1 appeared to be enhanced on the luminal side of BCECs (b, e). On the other hand, at a lower primary antibody concentration, labeling appeared to be confined to the cytoplasm and plasma membrane of BCECs. Scale bars = 1 µm in (a–c), 500 nm in (d–f).
Fig. 5.
Fig. 5.
Detection of GLUT1 molecules by light microscopy and transmission electron microscopy. (a) An optical section (2.18 µm thick) was acquired by CLSM, as shown in Fig. 3g. The section contained nucleus (blue) and GLUT1 (green) signals. Scale bar = 10 µm. (b) GLUT1 fluorescence signal spreading in the Z direction in a capillary vessel is illustrated. (c) Serial sections (80 nm thick) of the optical section were obtained. (d–i) Electron microscopic images of a capillary cross section showed GLUT1 molecules in the blood capillary endothelial cells (arrowheads). Each panel shows a different serial section; the sections displayed are not consecutive. Scale bars = 1 µm. (e, g, i) Higher magnification of the squares in (d, f, h). Scale bars = 1 µm.
Fig. 6.
Fig. 6.
Transmission electron microscopy images of a BCEC cross section. (a, c) Representative whole cross-sectional views of a BCEC are shown. Scale bar = 1 µm. (b, d) Higher magnification of the square in (a) and (c). Gold particle signals representing GLUT1 are localized in the intracellular vesicle (arrowhead) and on the abluminal cellular membrane (arrows). Scale bar = 100 nm. (e–g) GLUT1 signals in (e) an open vesicle on the luminal side, (f) a closed vesicle on the luminal side and (g) a medium-sized vesicle are shown. Scale bar = 100 nm.

Similar articles

Cited by

References

    1. Eyster C A, Higginson J D, Huebner R, Porat-Shiliom N, Weigert R, Wu W W, Shen R F, and Donaldson J G (2009) Discovery of new cargo proteins that enter cells through clathrin-independent endocytosis. Traffic 10: 590–599. - PMC - PubMed
    1. Anraku Y, Kuwahara H, Fukusato Y, Mizoguchi A, Ishii T, Nitta K, Matsumoto Y, Toh K, Miyata K, Uchida S, Nishina K, Osada K, Itaka K, Nishiyama N, Mizusawa H, Yamasoba T, Yokota T, and Kataoka K (2017) Glycaemic control boosts glucosylated nanocarrier crossing the BBB into the brain. Nat. Commun. 8: 1001. - PMC - PubMed
    1. Uchida Y, Ohtsuki S, Katsukura Y, Ikeda C, Suzuki T, Kamiie J, and Terasaki T (2011) Quantitative targeted absolute proteomics of human blood-brain barrier transporters and receptors. J. Neurochem. 117: 333–345. - PubMed
    1. Farrell C L and Pardridge W M (1991) Ultrastructural localization of blood-brain barrier-specific antibodies using immunogold-silver enhancement techniques. J. Neurosci. Methods 37: 103–110. - PubMed
    1. Cornford E M, Hyman S, and Pardridge W M (1993) An electron microscopic immunogold analysis of developmental up-regulation of the blood-brain barrier GLUT1 glucose transporter. J. Cereb. Blood Flow Metab. 13: 841–854. - PubMed

Substances