. 2022 Sep 1;24(9):1454-1468.
doi: 10.1093/neuonc/noac042.

Distinct metabolic hallmarks of WHO classified adult glioma subtypes

Affiliations

Distinct metabolic hallmarks of WHO classified adult glioma subtypes

Benny Björkblom et al. Neuro Oncol. .

Abstract

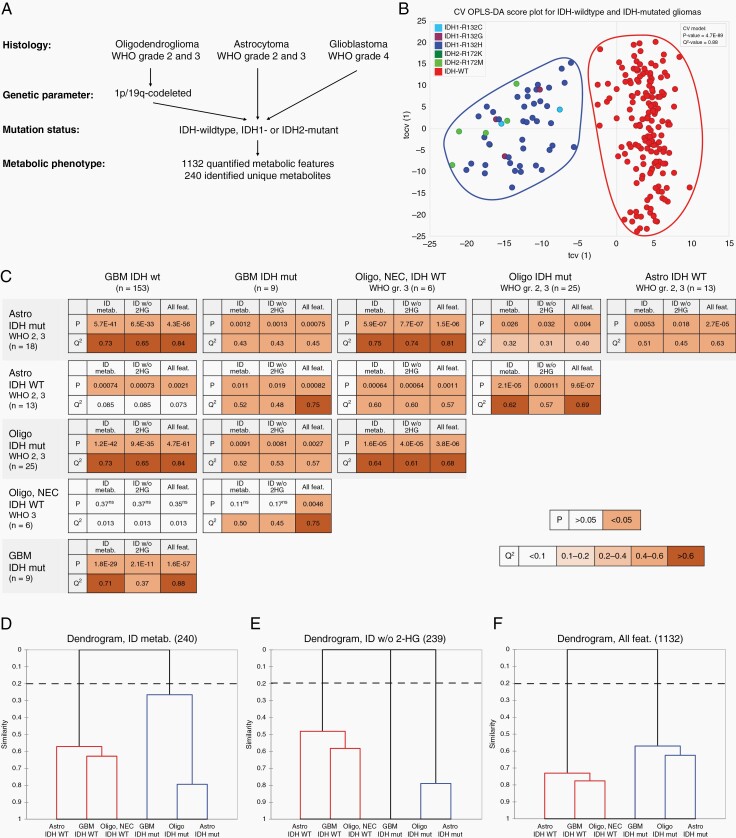
Background: Gliomas are complex tumors with several genetic aberrations and diverse metabolic programs contributing to their aggressive phenotypes and poor prognoses. This study defines key metabolic features that can be used to differentiate between glioma subtypes, with potential for improved diagnostics and subtype targeted therapy.

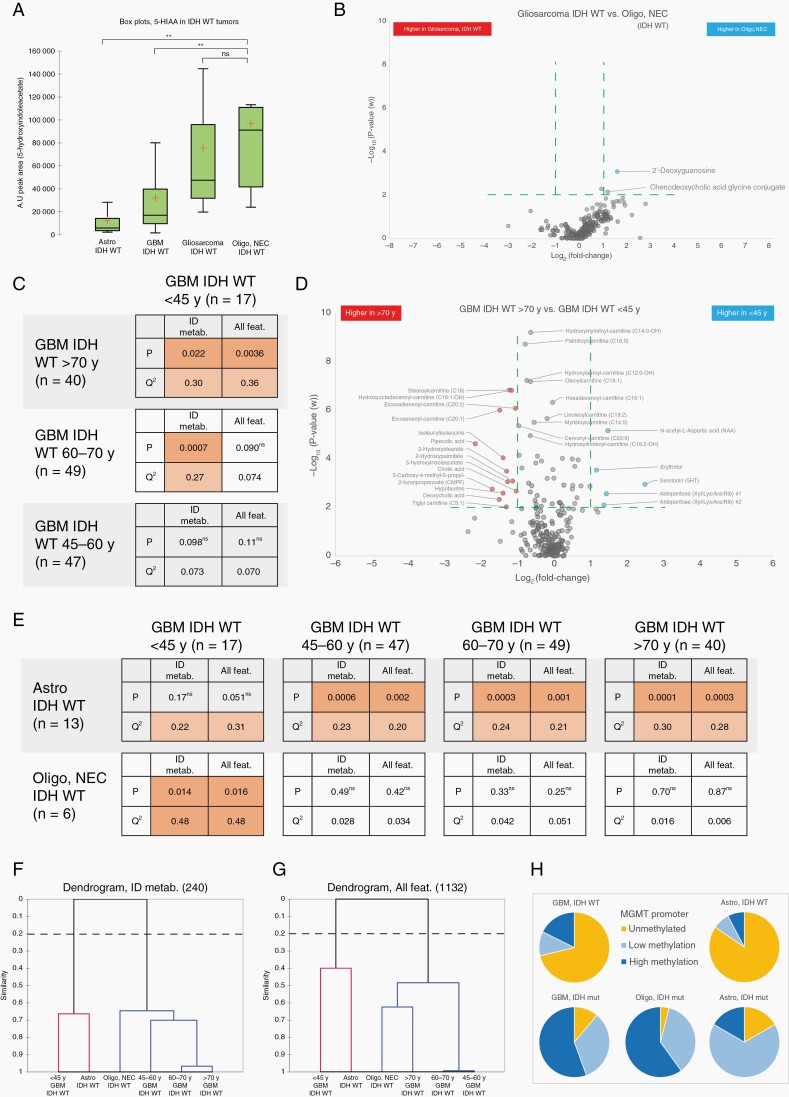
Methods: Cross-platform global metabolomic profiling coupled with clinical, genetic, and pathological analysis of glioma tissue from 224 tumors-oligodendroglioma (n = 31), astrocytoma (n = 31) and glioblastoma (n = 162)-were performed. Identified metabolic phenotypes were evaluated in accordance with the WHO classification, IDH-mutation, 1p/19q-codeletion, WHO-grading 2-4, and MGMT promoter methylation.

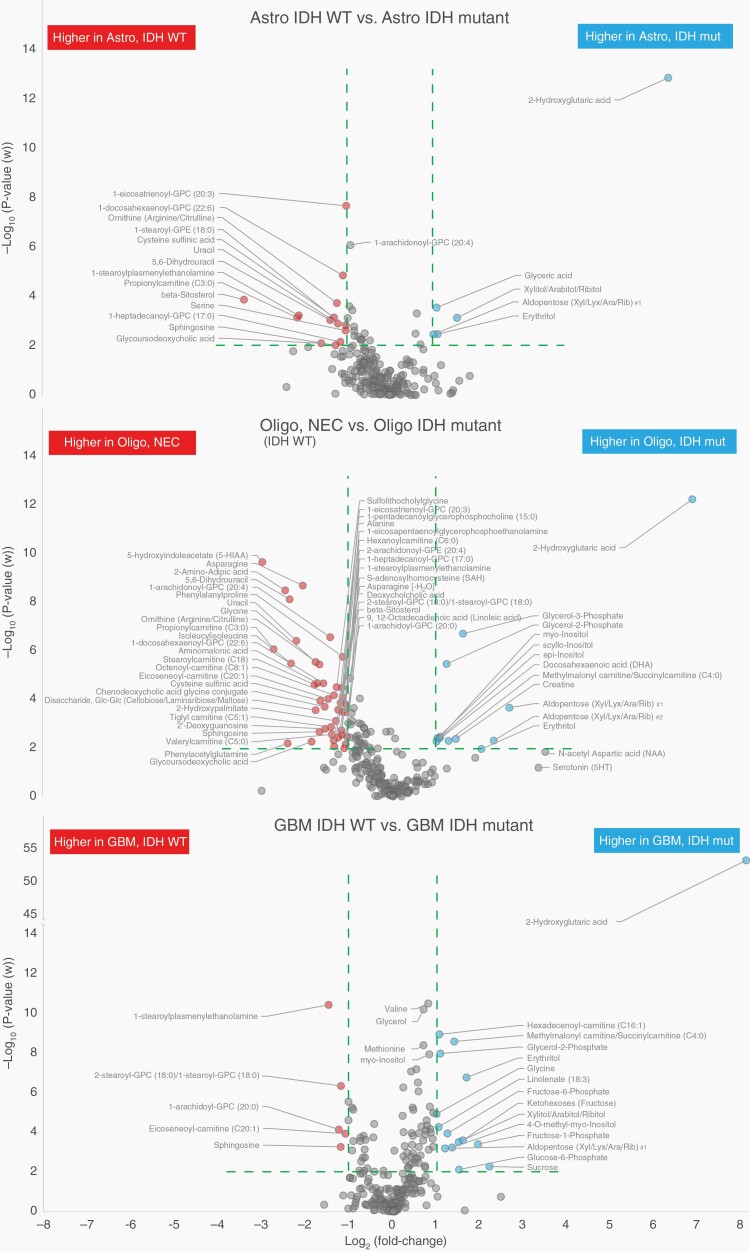
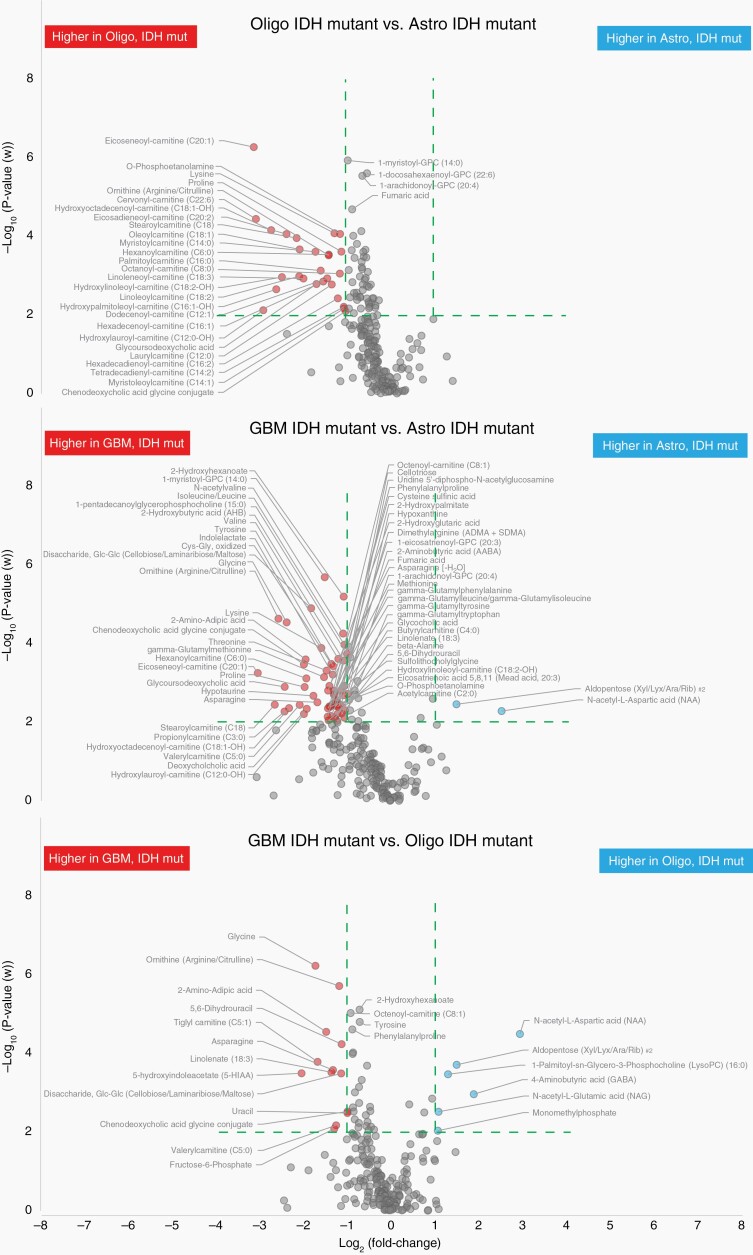
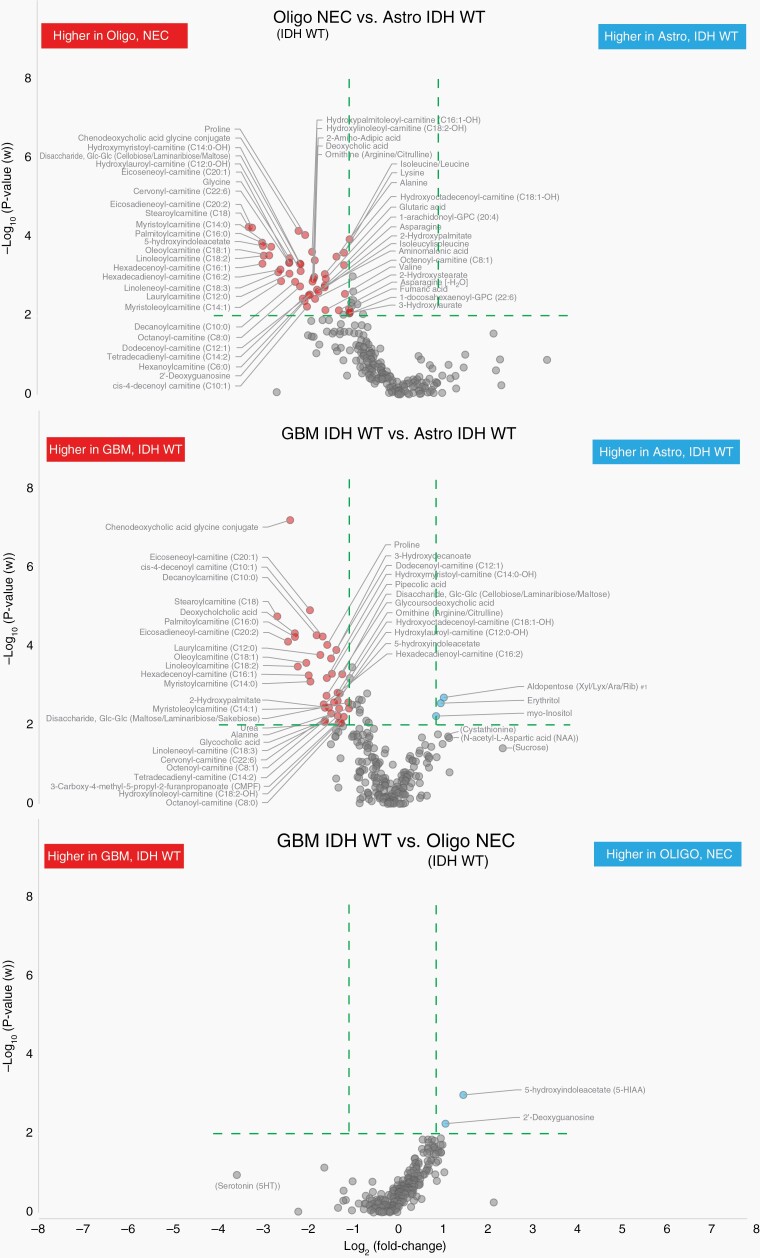
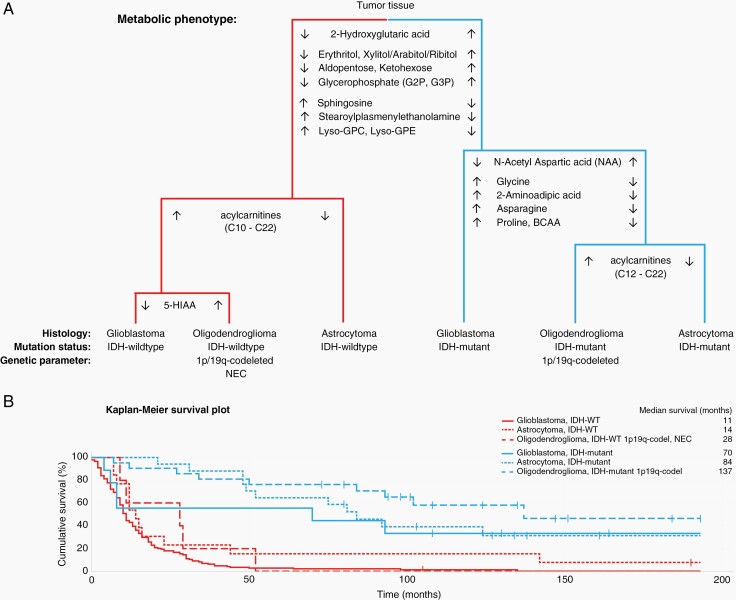
Results: Distinct metabolic phenotypes separate all six analyzed glioma subtypes. IDH-mutated subtypes, expressing 2-hydroxyglutaric acid, were clearly distinguished from IDH-wildtype subtypes. Considerable metabolic heterogeneity outside of the mutated IDH pathway were also evident, with key metabolites being high expression of glycerophosphates, inositols, monosaccharides, and sugar alcohols and low levels of sphingosine and lysoglycerophospholipids in IDH-mutants. Among the IDH-mutated subtypes, we observed high levels of amino acids, especially glycine and 2-aminoadipic acid, in grade 4 glioma, and N-acetyl aspartic acid in low-grade astrocytoma and oligodendroglioma. Both IDH-wildtype and mutated oligodendroglioma and glioblastoma were characterized by high levels of acylcarnitines, likely driven by rapid cell growth and hypoxic features. We found elevated levels of 5-HIAA in gliosarcoma and a subtype of oligodendroglioma not yet defined as a specific entity, indicating a previously not described role for the serotonin pathway linked to glioma with bimorphic tissue.

Conclusion: Key metabolic differences exist across adult glioma subtypes.

Keywords: WHO classification; astrocytoma; glioblastoma; metabolic reprogramming; oligodendroglioma.


Figures

Fig. 1
Fig. 1
Characterization of metabolic phenotypes for WHO classified glioma subtypes. A. Histology and molecular parameters for WHO diagnosed glioma subtypes, used for characterization of metabolic phenotype. B. Cross-validated OPLS-DA score plot for IDH-wildtype (WT) and IDH1- or IDH2-mutated tumors. The score plot illustrate the first predictive (tcv[1]) and orthogonal (tocv[1]) components for the OPLS-DA model using quantified metabolic features. C. Table summarizing two-class OPLS-DA comparisons of each of the six glioma subtypes defined in A. LOOCVANOVAP-values and LOOCV Q2-values for each comparison using; 240 identified unique metabolites (ID metab.); identified unique metabolites excluding 2-hydroxyglutaric acid (ID w/o 2-HG); and all of the 1,132 quantified metabolic features (all feat.). n; number of tumors for each subtype, P, LOOCVANOVAP-value; Q2, LOOCV goodness of prediction value Q2(cum), ns, nonsignificant class separation (P > .05), GBM; glioblastoma. Color grading indicate significant models (P < .05) and the models predictive ability (Q2-value). D–F. Dendrograms showing model similarities by use of hierarchical clustering of OPLS models based on; (D) 240 identified metabolites; (E) 239 identified metabolites excluding 2-hydroxyglutaric acid; and (F) all 1,132 quantified metabolic features.
Fig. 2
Fig. 2
Volcano plots highlighting the most discriminating identified metabolites separating IDH-mutated and IDH-wildtype tumors, dependent of glioma subtype. Green dashed line indicate cutoff values set at P < .01 and >2-fold difference between compared glioma subtypes.
Fig. 3
Fig. 3
Volcano plots highlighting the most discriminating identified metabolites separating IDH-mutated glioma subtypes only. Green dashed line indicate cutoff values set at P<.01 and >2-fold difference between compared IDH-mutated glioma subtypes.
Fig. 4
Fig. 4
Volcano plots highlighting the most discriminating identified metabolites separating IDH-wildtype glioma subtypes only. Green dashed line indicate cutoff values set at P < .01 and >2-fold difference between compared IDH-wildtype glioma subtypes.
Fig. 5
Fig. 5
Comparison of 5-HIAA expression in IDH-wildtype glioma and metabolic hallmarks of age stratified glioblastoma IDH-wildtype. A. Box plot illustrating quantifications of 5-HIAA in IDH-wildtype glioma tumors. ** >2-fold difference and P < .01. B. Volcano plots highlighting identified metabolites separating IDH-wildtype gliosarcoma from oligodendroglioma, NEC, note: nonsignificant model (P = .29). C. Table summarizing two-class OPLS-DA comparisons of age stratified glioblastoma, IDH-wildtype tumors based on; 240 identified metabolites (ID metab.); and all 1,132 quantified metabolic features (All feat.). D. Volcano plots highlighting the most discriminating identified metabolites separating <45-year-old glioblastoma, IDH-wildtype tumors from >70-year-old glioblastoma, IDH-wildtype tumors. Cutoff values at P < .01 and >2-fold difference are indicated with green dashed lines. E. Table summarizing two-class OPLS-DA comparisons of tumor metabolic phenotypes for; astrocytoma, IDH-wildtype; oligodendroglioma, NEC; and age stratified glioblastoma, IDH-wildtype tumors. Table summarize calculations based on; identified metabolites (ID metab.); and all quantified metabolic features (All feat.). F-G. Dendrograms showing model similarities for IDH-wildtype glioma subtypes with age stratified glioblastoma, by use of hierarchical clustering of OPLS models based on; (D) 240 identified metabolites; (E) all 1132 quantified metabolic features. H. Pie charts illustrating numerical proportions of MGMT promoter methylation levels in WHO classified glioma subtypes. n; number of tumors for each subtype, P, LOOCVANOVAP-value, Q2; LOOCV goodness of prediction value Q2(cum), ns; nonsignificant class separation (P > .05).
Fig. 6
Fig. 6
A. Schematic dendrogram illustrating key metabolic differences among classified glioma subtypes. Metabolite levels are shown as consistently higher (↑) or lower (↓) in comparison to each glioma subtype. B. Kaplan-Meier survival plot for overall survival based on glioma subtype and metabolic phenotype shown in A. Censored observations were alive at follow up in November 2021.

Comment in

  • What can metabolites tell us about gliomas?
    Sampetrean O, Saya H. Sampetrean O, et al. Neuro Oncol. 2022 Sep 1;24(9):1469-1470. doi: 10.1093/neuonc/noac128. Neuro Oncol. 2022. PMID: 35554565 Free PMC article. No abstract available.

References

    1. Louis DN, Perry A, Reifenberger G, et al. . The 2016 World Health Organization classification of tumors of the central nervous system: a summary. Acta Neuropathol. 2016;131(6):803–820. - PubMed
    1. Louis DN, Perry A, Wesseling P, et al. . The 2021 WHO classification of tumors of the central nervous system: a summary. Neuro-oncology. 2021;23(8):1231–1251. - PMC - PubMed
    1. Brennan CW, Verhaak RGW, McKenna A, et al. . The somatic genomic landscape of glioblastoma. Cell. 2013;155(2):462–477. - PMC - PubMed
    1. Cancer Genome ARN, Brat DJ, Verhaak RG, et al. . Comprehensive, integrative genomic analysis of diffuse lower-grade gliomas. N Engl J Med. 2015;372(26):2481–2498. - PMC - PubMed
    1. Eckel-Passow JE, Lachance DH, Molinaro AM, et al. . Glioma groups based on 1p/19q, IDH, and TERT promoter mutations in tumors. N Engl J Med. 2015;372(26):2499–2508. - PMC - PubMed

Publication types

Substances