Observational Study
. 2022 Jun;129(6):708-718.
doi: 10.1016/j.ophtha.2022.02.010. Epub 2022 Feb 11.

Genotypic and Phenotypic Spectrum of Foveal Hypoplasia: A Multicenter Study

Affiliations
Observational Study

Genotypic and Phenotypic Spectrum of Foveal Hypoplasia: A Multicenter Study

Helen J Kuht et al. Ophthalmology. 2022 Jun.

Abstract

Purpose: To characterize the genotypic and phenotypic spectrum of foveal hypoplasia (FH).

Design: Multicenter, observational study.

Participants: A total of 907 patients with a confirmed molecular diagnosis of albinism, PAX6, SLC38A8, FRMD7, AHR, or achromatopsia from 12 centers in 9 countries (n = 523) or extracted from publicly available datasets from previously reported literature (n = 384).

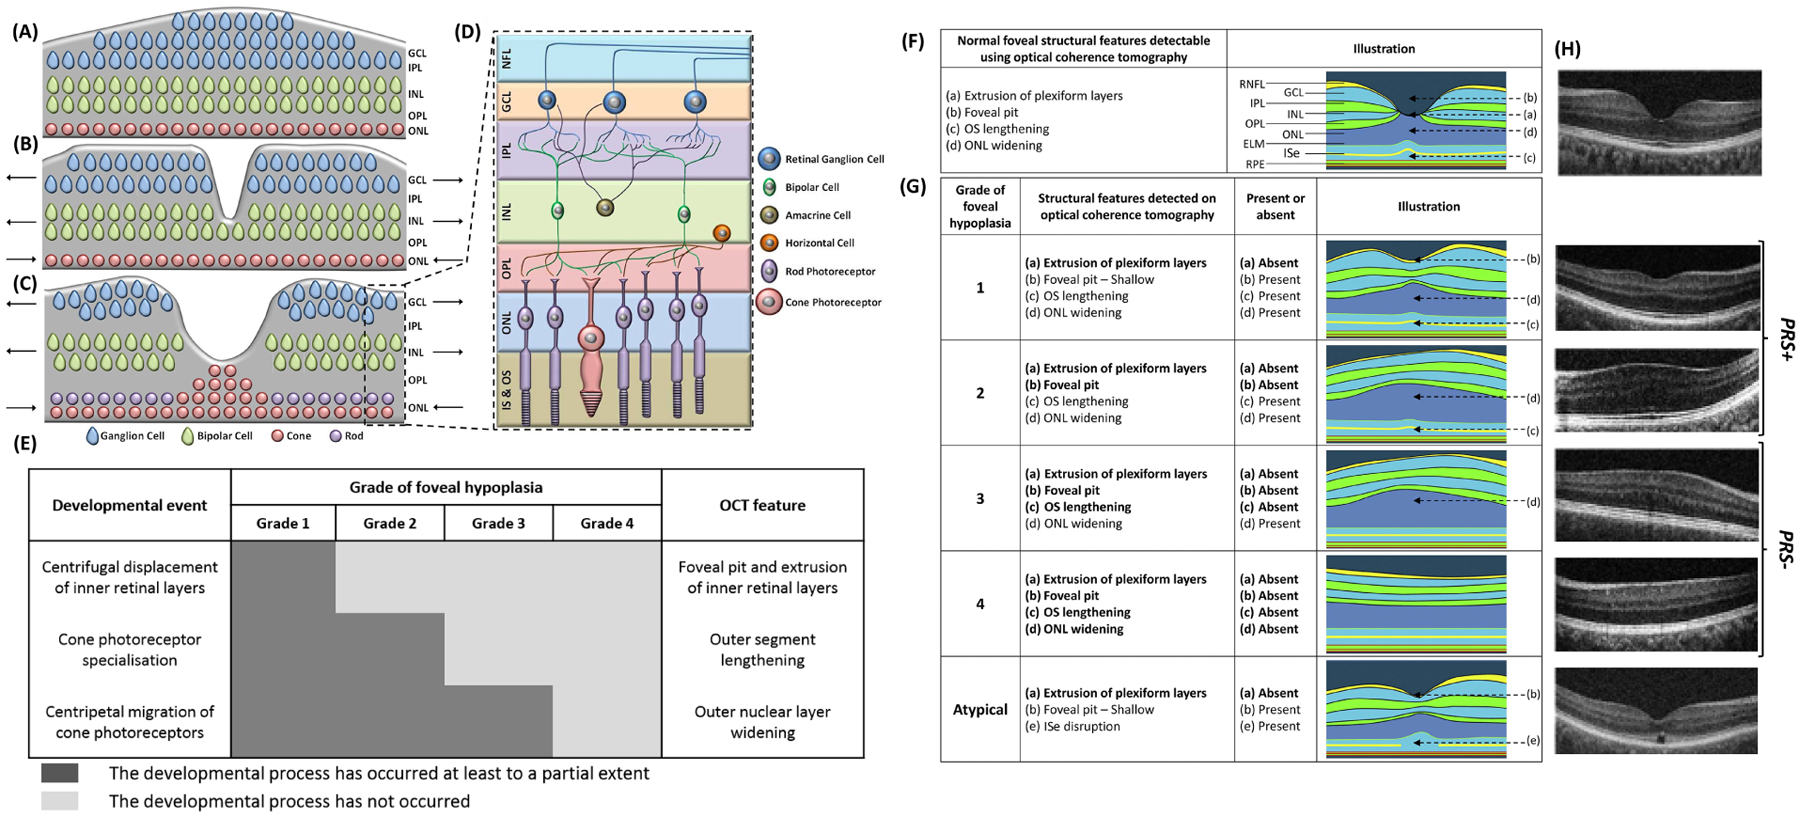
Methods: Individuals with a confirmed molecular diagnosis and availability of foveal OCT scans were identified from 12 centers or from the literature between January 2011 and March 2021. A genetic diagnosis was confirmed by sequence analysis. Grading of FH was derived from OCT scans.

Main outcome measures: Grade of FH, presence or absence of photoreceptor specialization (PRS+ vs. PRS-), molecular diagnosis, and visual acuity (VA).

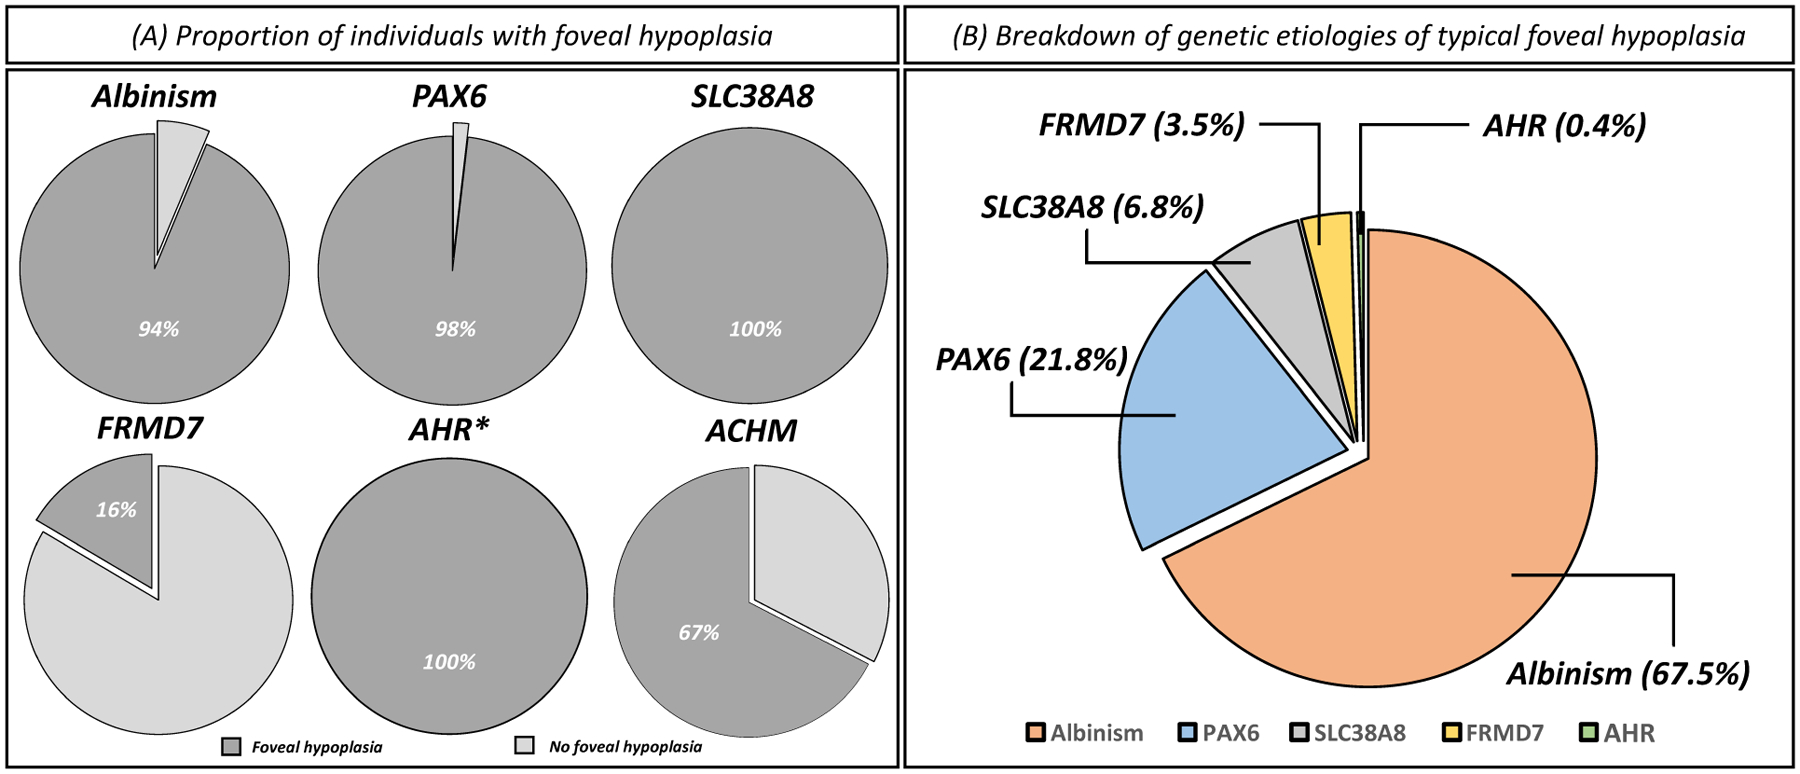
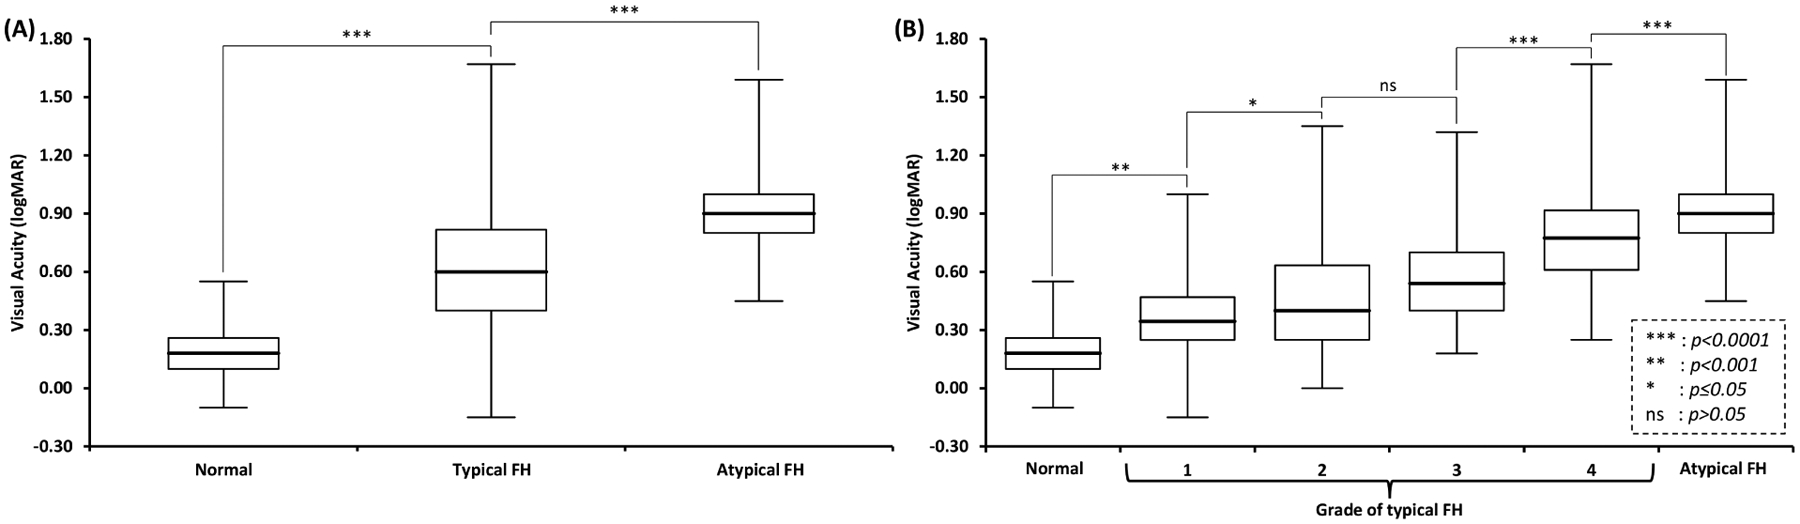
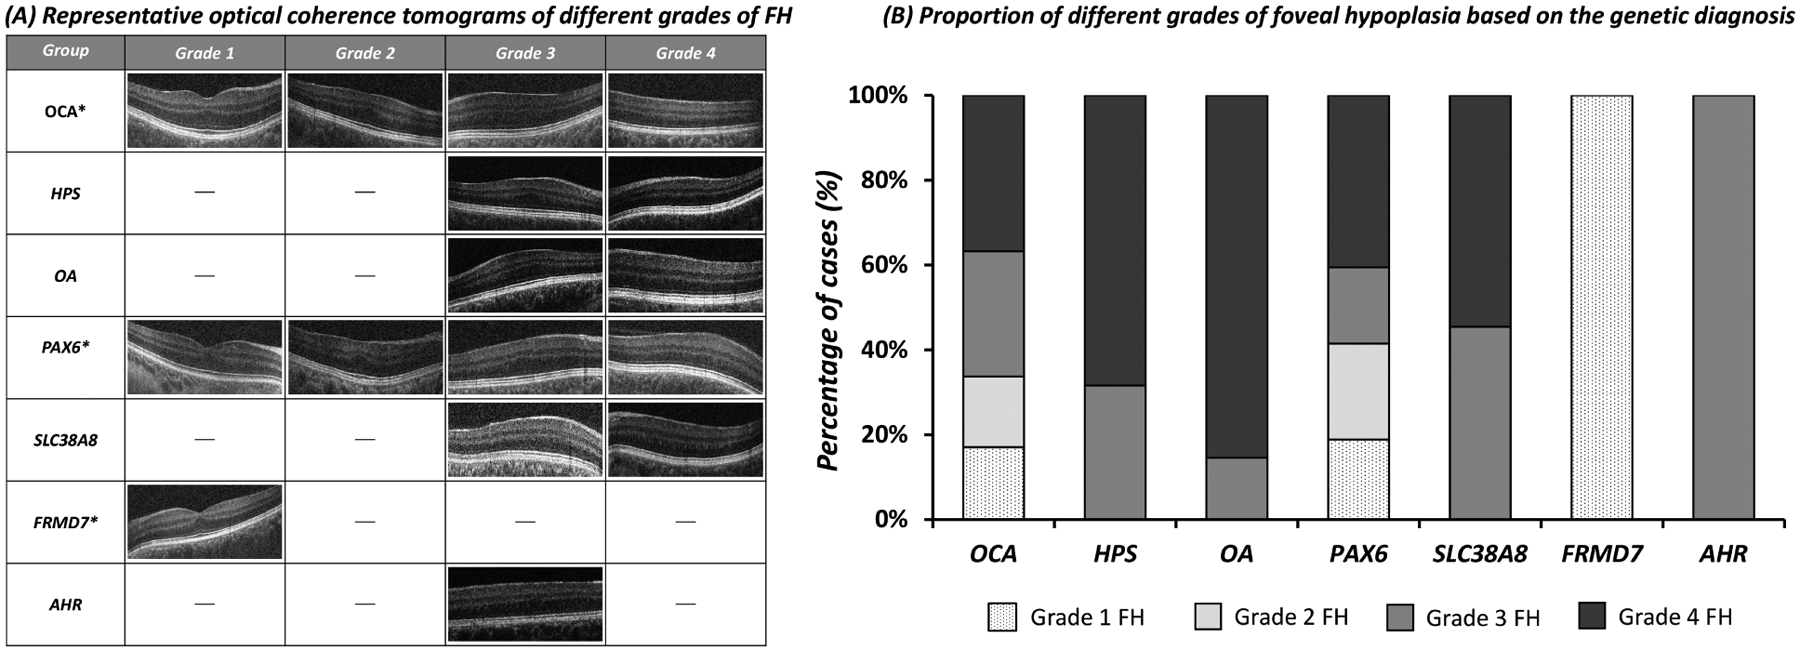
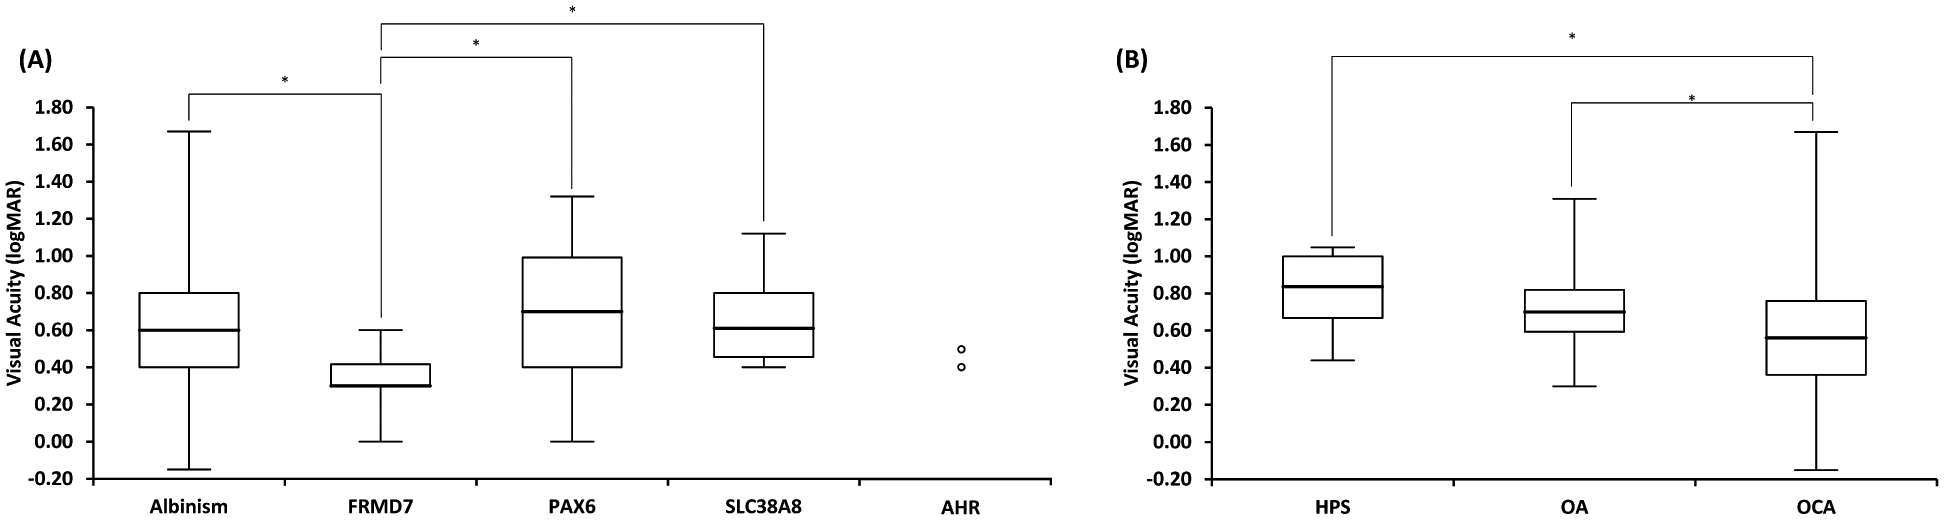
Results: The most common genetic etiology for typical FH in our cohort was albinism (67.5%), followed by PAX6 (21.8%), SLC38A8 (6.8%), and FRMD7 (3.5%) variants. AHR variants were rare (0.4%). Atypical FH was seen in 67.4% of achromatopsia cases. Atypical FH in achromatopsia had significantly worse VA than typical FH (P < 0.0001). There was a significant difference in the spectrum of FH grades based on the molecular diagnosis (chi-square = 60.4, P < 0.0001). All SLC38A8 cases were PRS- (P = 0.003), whereas all FRMD7 cases were PRS+ (P < 0.0001). Analysis of albinism subtypes revealed a significant difference in the grade of FH (chi-square = 31.4, P < 0.0001) and VA (P = 0.0003) between oculocutaneous albinism (OCA) compared with ocular albinism (OA) and Hermansky-Pudlak syndrome (HPS). Ocular albinism and HPS demonstrated higher grades of FH and worse VA than OCA. There was a significant difference (P < 0.0001) in VA between FRMD7 variants compared with other diagnoses associated with FH.

Conclusions: We characterized the phenotypic and genotypic spectrum of FH. Atypical FH is associated with a worse prognosis than all other forms of FH. In typical FH, our data suggest that arrested retinal development occurs earlier in SLC38A8, OA, HPS, and AHR variants and later in FRMD7 variants. The defined time period of foveal developmental arrest for OCA and PAX6 variants seems to demonstrate more variability. Our findings provide mechanistic insight into disorders associated with FH and have significant prognostic and diagnostic value.

Keywords: AHR; Albinism; Aniridia; FHONDA; FRMD7; Foveal hypoplasia; GPR143; Genetics; Genotype-phenotype correlation; Hermansky–Pudlak syndrome; OCT; PAX6; Retinal development; SLC38A8.


Conflict of interest statement

Conflict of interest statement: MGT, HJK, FAP, VS and ZT are all consultants for Leica Microsystems

Figures

Figure 1:
Figure 1:
Foveal pit formation and movement of retinal cells during formation of the area of high acuity. The laminar retinal structure prior to foveal pit formation is shown in (A). The inner retinal layers were displaced centrifugally (away from the future fovea) during foveal pit formation (B). The cone photoreceptors migrate centripetally (towards the fovea) and form the pure cone area (C). Arrows point in the direction of movement of the cellular layers. The magnified laminar structure (D) with the different retinal cell types and the inner segment & outer segment (IS & OS) of the photoreceptors are shown in (D). NFL = Nerve Fibre Layer; GCL = ganglion cell layer; IPL = inner plexiform layer; INL = inner nuclear layer; OPL = outer plexiform layer; ONL = outer nuclear layer. (A, B, C are based on developmental theory proposed by Springer and Hendrickson). Chart showing the 3 developmental processes involved in formation of a structural and functional fovea. In grade 1 foveal hypoplasia, all processes occur to a certain extent. However, in grade 4 foveal hypoplasia, none of these processes occur; thus, the retina resembles that of the parafovea. In grade 2 and 3 foveal hypoplasia, there is outer nuclear layer widening, but no foveal pit. The difference between grade 2 and 3 foveal hypoplasia is occurrence of cone photoreceptor specialization. Identifying these specific features on optical coherence tomography (OCT) enables us to understand whether the respective developmental process has occurred. F, Illustration showing the unique features of a normal fovea detectable on optical coherence tomography. G, Illustration of typical and atypical grades of foveal hypoplasia. All grades of foveal hypoplasia had incursion of inner retinal layers. Atypical foveal hypoplasia also had incursion of the inner retinal layers. Grade 1 foveal hypoplasia is associated with a shallow foveal pit, outer nuclear layer (ONL) widening, and outer segment (OS) lengthening relative to the parafoveal ONL and OS length, respectively. In Grade 2 foveal hypoplasia, all features of grade 1 are present except the presence of a foveal pit. Grade 3 foveal hypoplasia consists of all features of grade 2 foveal hypoplasia except the widening of the cone outer segment. Grade 4 foveal hypoplasia represents all the features seen in grade 3 except there is no widening of the ONL at the fovea. Finally, an atypical form of foveal hypoplasia also is described in which there is a shallower pit with disruption of the inner segment ellipsoid (ISe). (Adapted with permission from Thomas et al. 2011). H, original OCTs demonstrating the different grades of foveal hypoplasia. Grades 1 and 2 can be considered to show signs of photoreceptor specialisation (PRS+), however grades 3 and 4 do not show signs of photoreceptor specialisation (PRS−). ELM = external limiting membrane; GCL = ganglion cell layer; INL = inner nuclear layer; IPL = inner plexiform layer; OPL = outer plexiform layer; RNFL = retinal nerve fibre layer; RPE = retinal pigment epithelium.
Figure 2:
Figure 2:
(A) Proportion of individuals with foveal hypoplasia within each genetic diagnosis. (B) Breakdown of genetic etiologies causative of typical foveal hypoplasia. *Only two cases of AHR variants with foveal hypoplasia were identified.
Figure 3:
Figure 3:
(A) Box and whisker plots of visual acuity in individuals with normal foveal morphology compared to typical foveal hypoplasia (FH) and atypical FH. Pairwise comparisons show significant differences between the three groups. (B) Pairwise comparisons with typical FH split into individual grades (1–4) shows significant differences across all groups except between grade 2 and 3 FH.
Figure 4:
Figure 4:
(A) Representative tomograms of typical foveal hypoplasia in different genetic etiologies. (B) The relative proportions of each grade of foveal hypoplasia within each genetic diagnosis is shown in this bar chart. Non-syndromic oculocutaneous albinism (OCA) and PAX6 variants had the full spectrum of foveal hypoplasia. However, SLC38A8 variants, GPR143 variants associated with ocular albinism (OA) and variants associated with Hermansky Pudlak Syndrome (HPS) only had grade 3 and grade 4 foveal hypoplasia. FRMD7 only had grade 1 foveal hypoplasia. AHR only had grade 3 foveal hypoplasia. *Albinism, PAX6 and FRMD7 can also have normal foveal morphology.
Figure 5:
Figure 5:
(A) Box and whisker plots of visual acuity in each genetic etiology associated with foveal hypoplasia. Only individuals with foveal hypoplasia from each diagnostic group were included. (B) Box and whisker plots of visual acuity for albinism subtypes: Non-syndromic Oculocutaneous Albinism (OCA), Hermansky Pudlak Syndrome (HPS) and Ocular Albinism (OA) due to GPR143 variants. Box represents the interquartile range, line through the box represents the median and extent of whiskers represents the range. Significant comparisons (p≤0.05) are shown with *.

References

    1. Thomas MG et al. Structural grading of foveal hypoplasia using spectral-domain optical coherence tomography a predictor of visual acuity? Ophthalmology 118, 1653–1660, doi:10.1016/j.ophtha.2011.01.028 (2011). - DOI - PMC - PubMed
    1. Hendrickson A, Possin D, Vajzovic L & Toth CA Histologic development of the human fovea from midgestation to maturity. Am J Ophthalmol 154, 767–778 e762, doi:10.1016/j.ajo.2012.05.007 (2012). - DOI - PMC - PubMed
    1. Hendrickson AE & Yuodelis C The morphological development of the human fovea. Ophthalmology 91, 603–612, doi:10.1016/s0161-6420(84)34247-6 (1984). - DOI - PubMed
    1. Thomas MG, Papageorgiou E, Kuht HJ & Gottlob I Normal and abnormal foveal development. The British journal of ophthalmology, doi:10.1136/bjophthalmol-2020-316348 (2020). - DOI - PubMed
    1. Wilk MA, Wilk BM, Langlo CS, Cooper RF & Carroll J Evaluating outer segment length as a surrogate measure of peak foveal cone density. Vision Res 130, 57–66, doi:10.1016/j.visres.2016.10.012 (2017). - DOI - PMC - PubMed

Publication types

Supplementary concepts