

A real-time integrated framework to support clinical decision making for covid-19 patients
- PMID: 35158181
- PMCID: PMC8800500
- DOI: 10.1016/j.cmpb.2022.106655
A real-time integrated framework to support clinical decision making for covid-19 patients
Abstract
Background: The COVID-19 pandemic affected healthcare systems worldwide. Predictive models developed by Artificial Intelligence (AI) and based on timely, centralized and standardized real world patient data could improve management of COVID-19 to achieve better clinical outcomes. The objectives of this manuscript are to describe the structure and technologies used to construct a COVID-19 Data Mart architecture and to present how a large hospital has tackled the challenge of supporting daily management of COVID-19 pandemic emergency, by creating a strong retrospective knowledge base, a real time environment and integrated information dashboard for daily practice and early identification of critical condition at patient level. This framework is also used as an informative, continuously enriched data lake, which is a base for several on-going predictive studies.
Methods: The information technology framework for clinical practice and research was described. It was developed using SAS Institute software analytics tool and SAS® Vyia® environment and Open-Source environment R ® and Python ® for fast prototyping and modeling. The included variables and the source extraction procedures were presented.
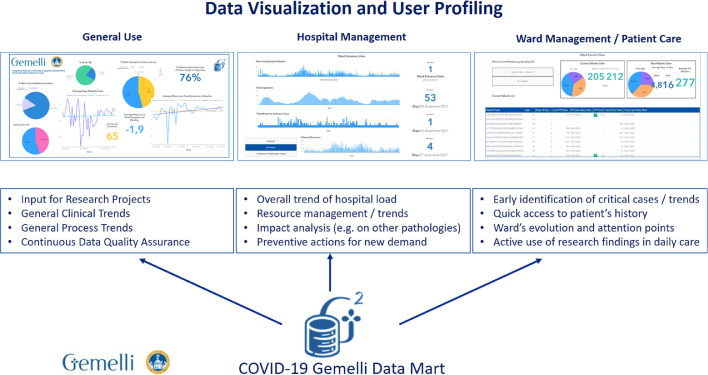
Results: The Data Mart covers a retrospective cohort of 5528 patients with SARS-CoV-2 infection. People who died were older, had more comorbidities, reported more frequently dyspnea at onset, had higher d-dimer, C-reactive protein and urea nitrogen. The dashboard was developed to support the management of COVID-19 patients at three levels: hospital, single ward and individual care level.
Interpretation: The COVID-19 Data Mart based on integration of a large collection of clinical data and an AI-based integrated framework has been developed, based on a set of automated procedures for data mining and retrieval, transformation and integration, and has been embedded in the clinical practice to help managing daily care. Benefits from the availability of a Data Mart include the opportunity to build predictive models with a machine learning approach to identify undescribed clinical phenotypes and to foster hospital networks. A real-time updated dashboard built from the Data Mart may represent a valid tool for a better knowledge of epidemiological and clinical features of COVID-19, especially when multiple waves are observed, as well as for epidemic and pandemic events of the same nature (e. g. with critical clinical conditions leading to severe pulmonary inflammation). Therefore, we believe the approach presented in this paper may find several applications in comparable situations even at region or state levels. Finally, models predicting the course of future waves or new pandemics could largely benefit from network of DataMarts.
Copyright © 2022. Published by Elsevier B.V.
Conflict of interest statement
Declarations of Competing Interest None.
Figures


References
-
- WHO Director-General's opening remarks at the media briefing on COVID19, March 11th 2020.
MeSH terms
LinkOut - more resources
Full Text Sources
Medical
Research Materials
Miscellaneous
