. 2022 Mar;603(7903):893-899.
doi: 10.1038/s41586-022-04521-7. Epub 2022 Feb 14.

Single-cell dissection of the human brain vasculature

Affiliations

Single-cell dissection of the human brain vasculature

Francisco J Garcia et al. Nature. 2022 Mar.

Abstract

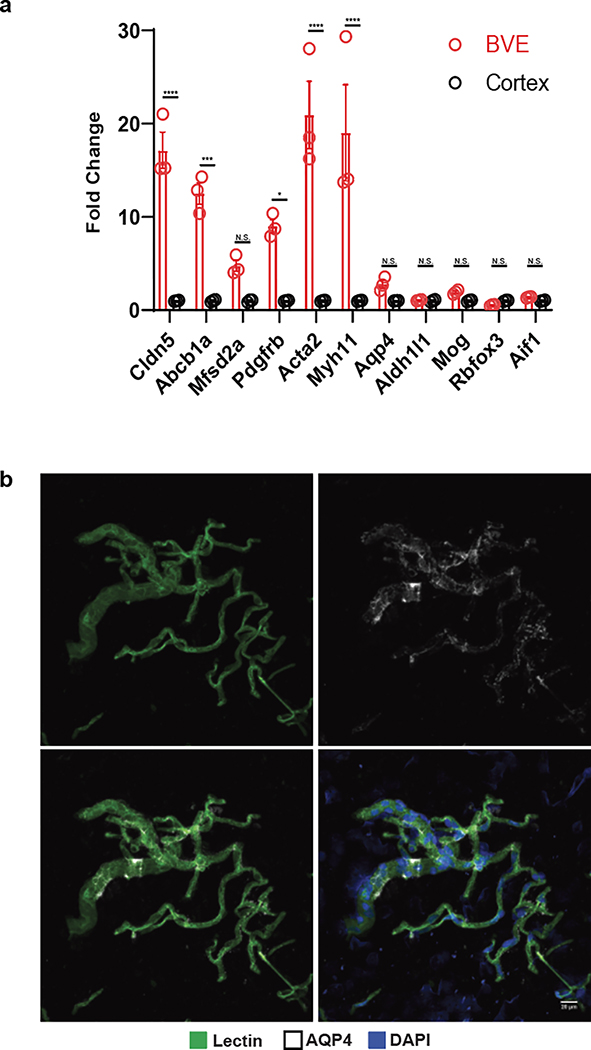
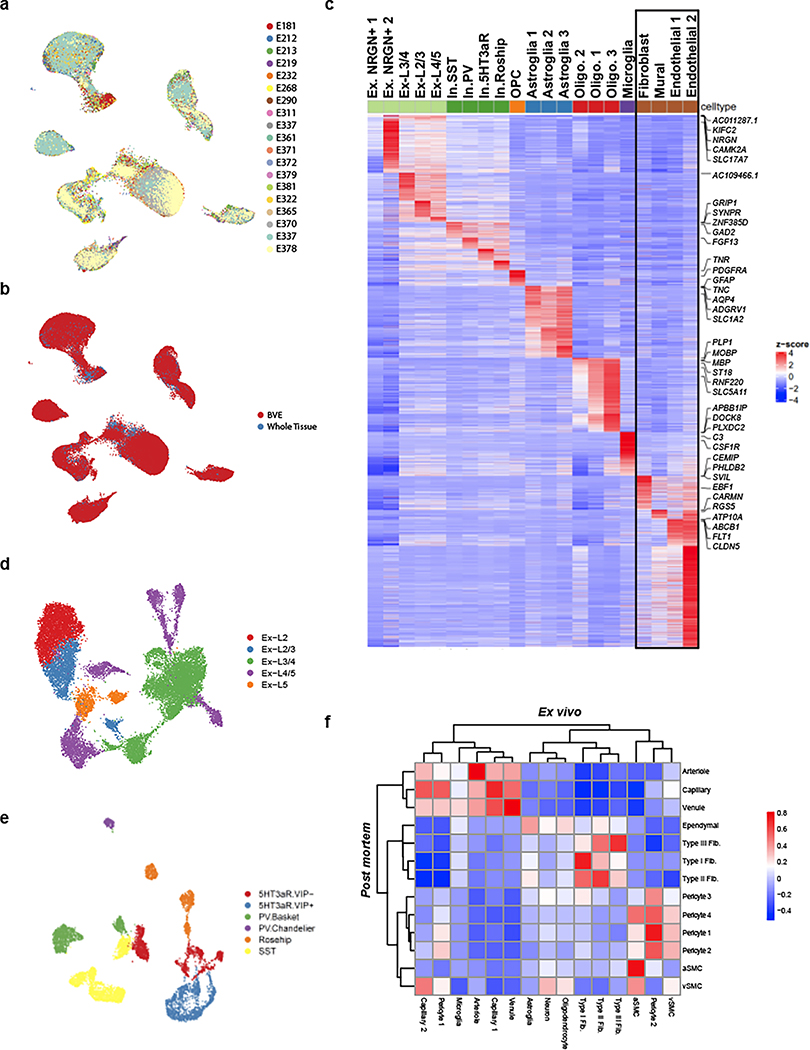
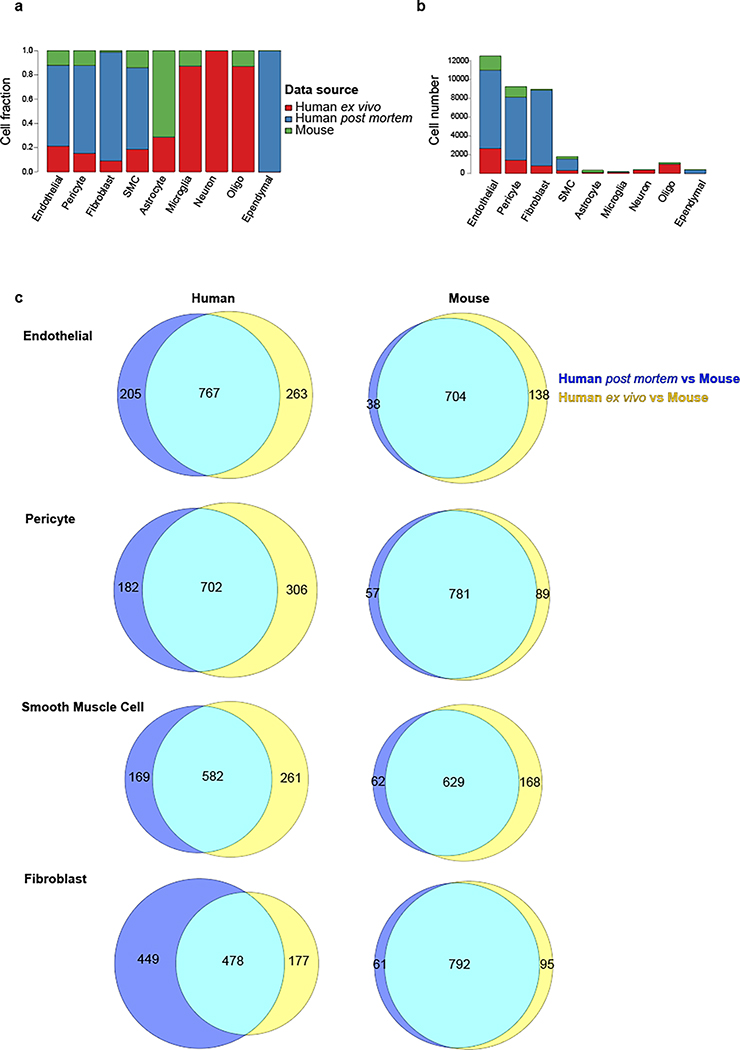
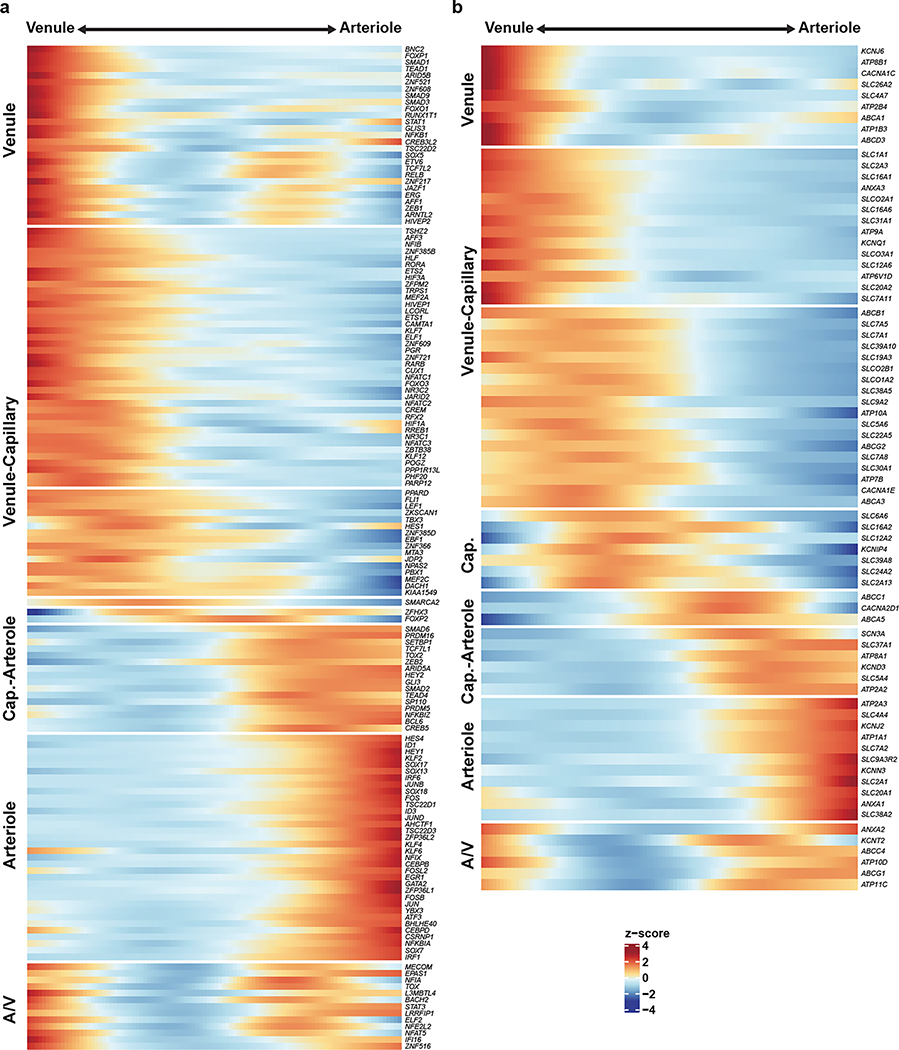
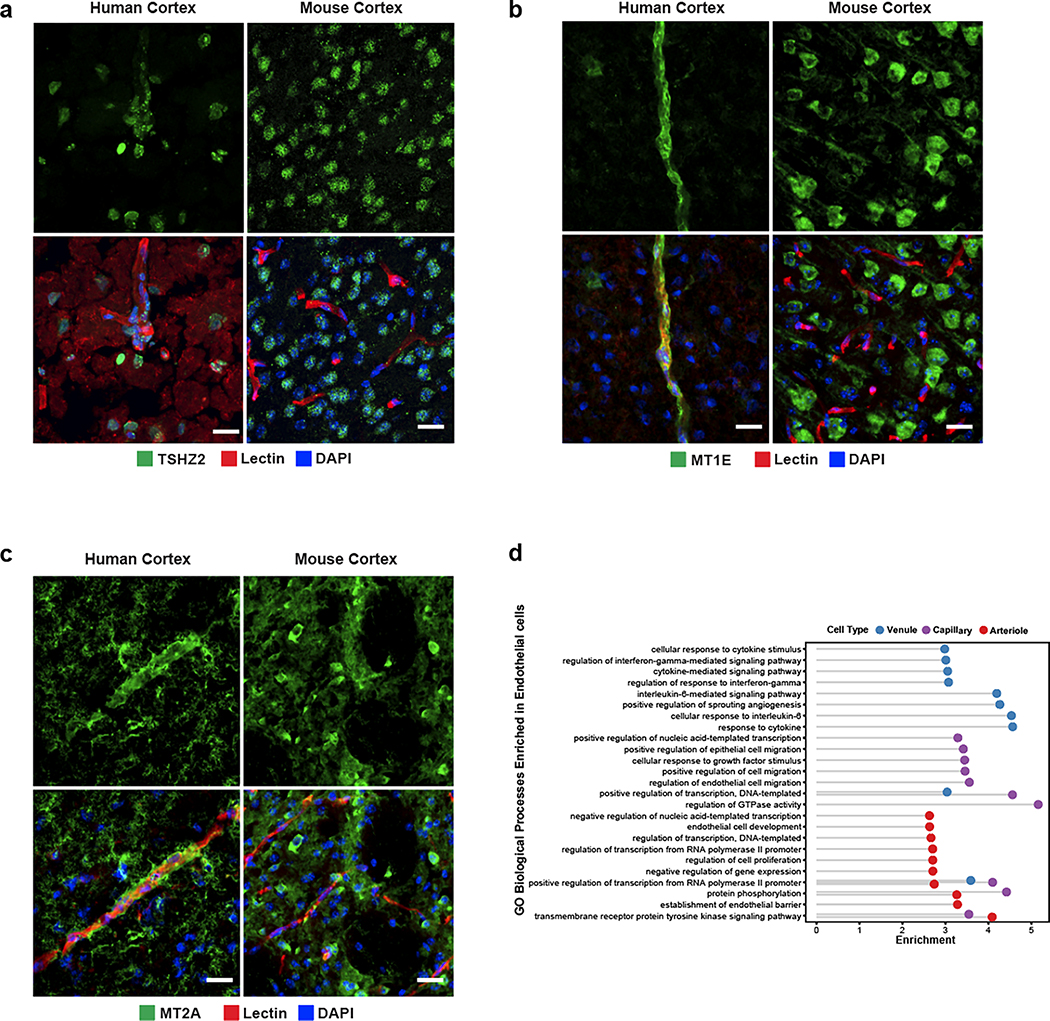
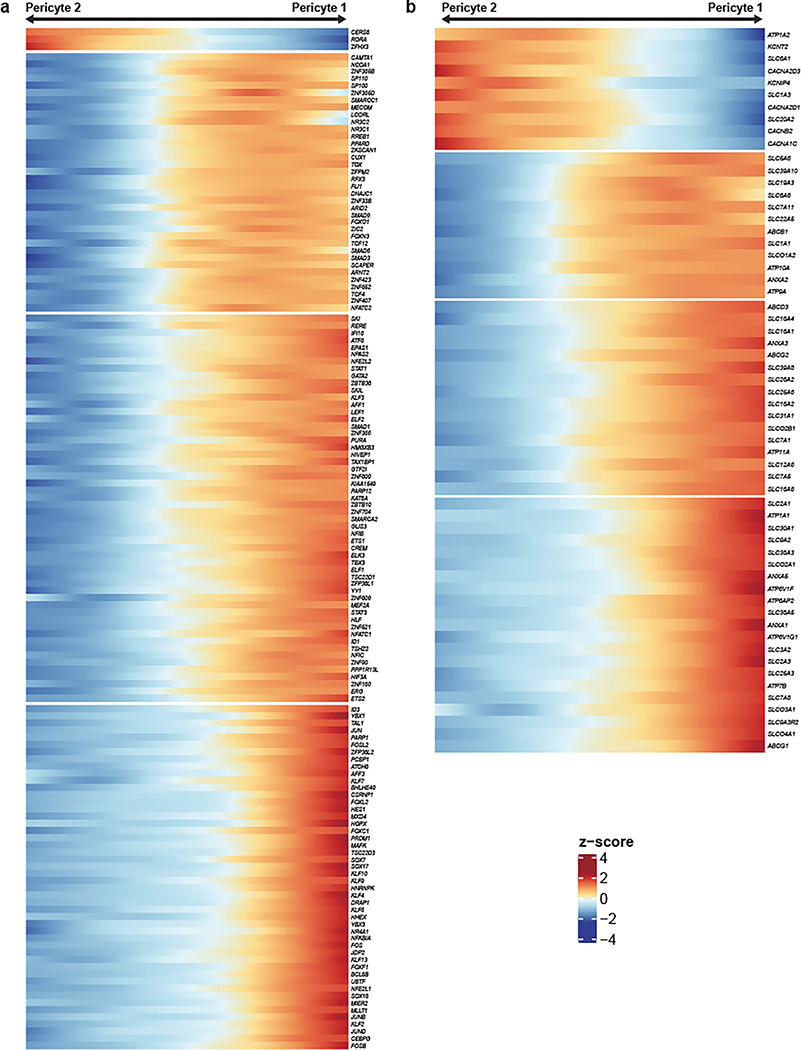
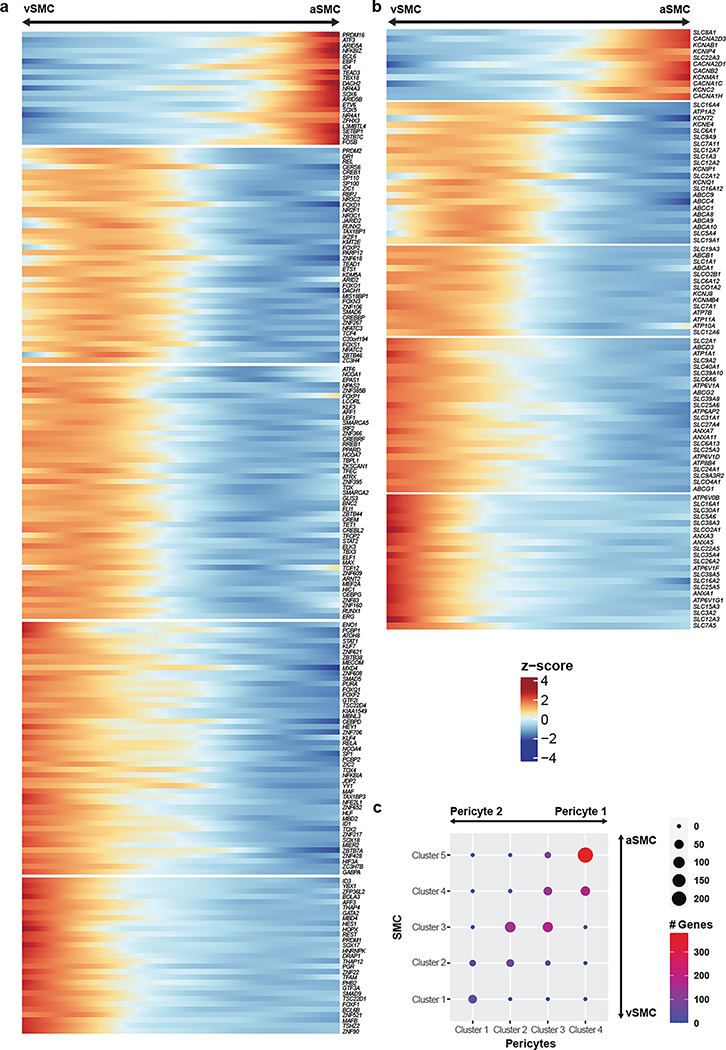
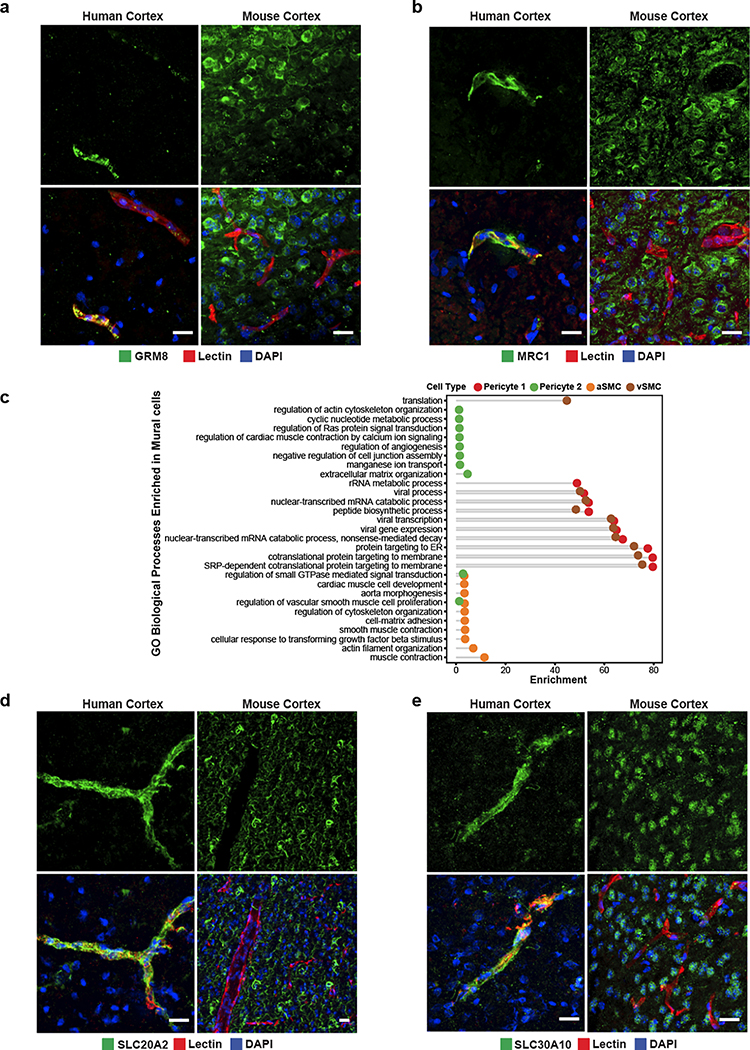
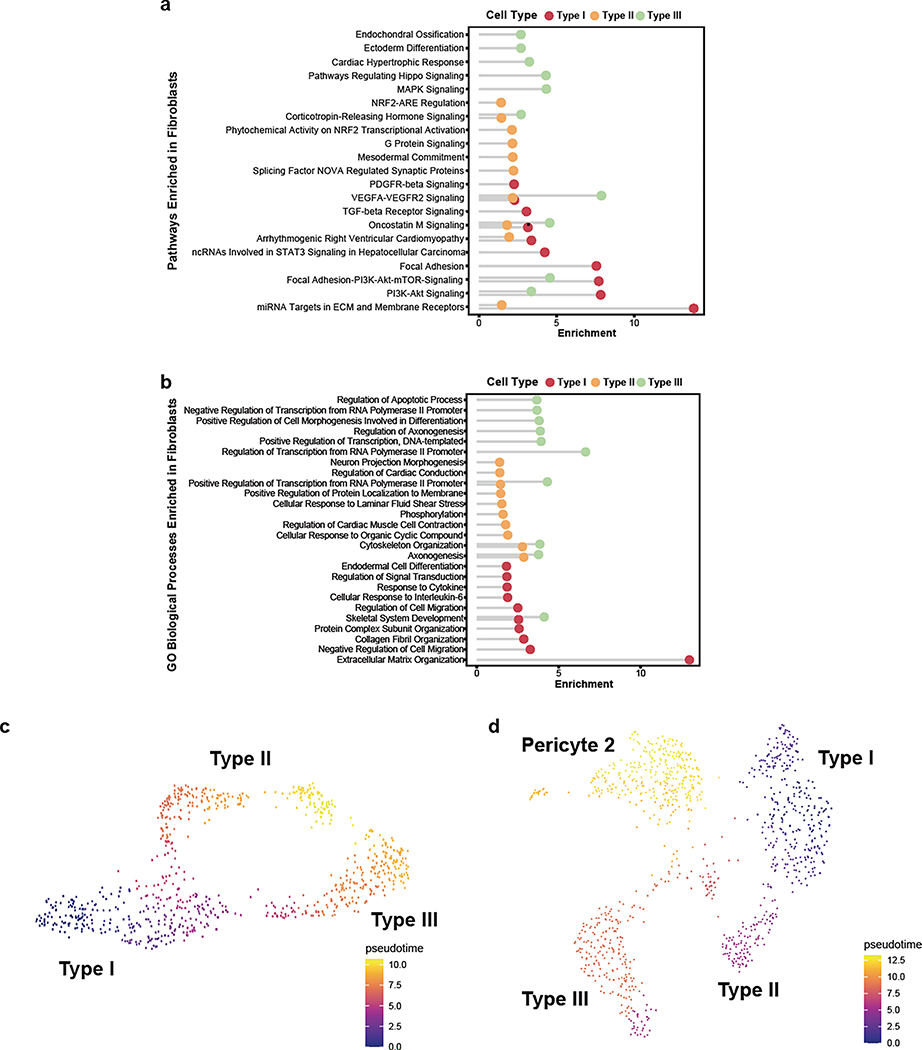
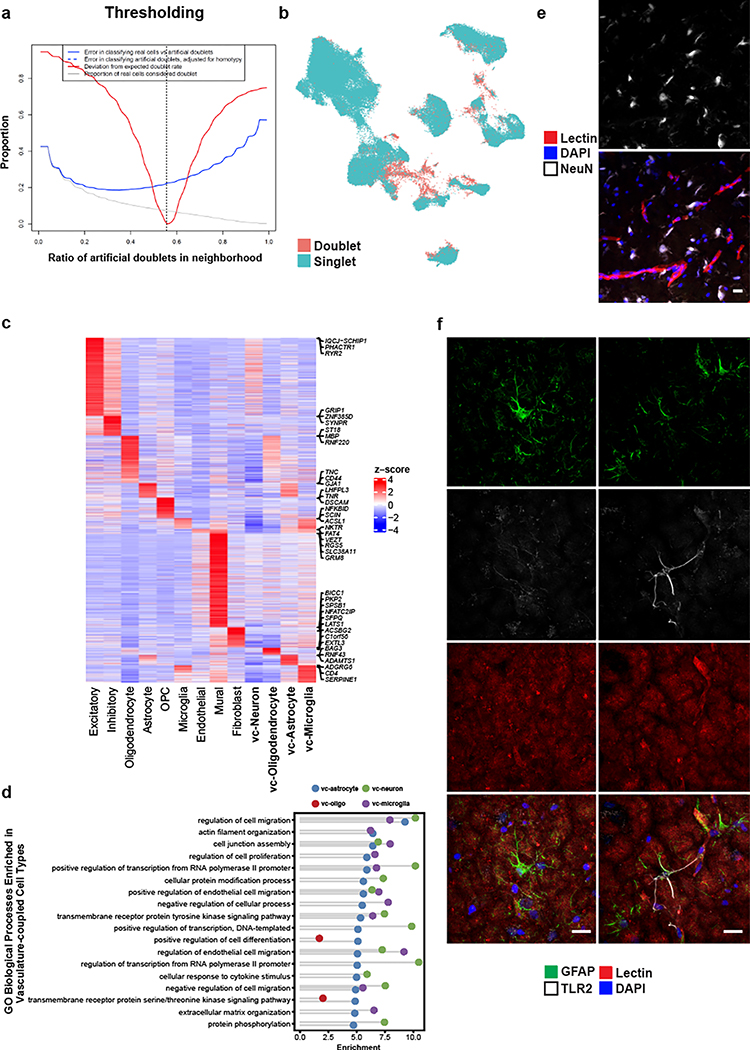
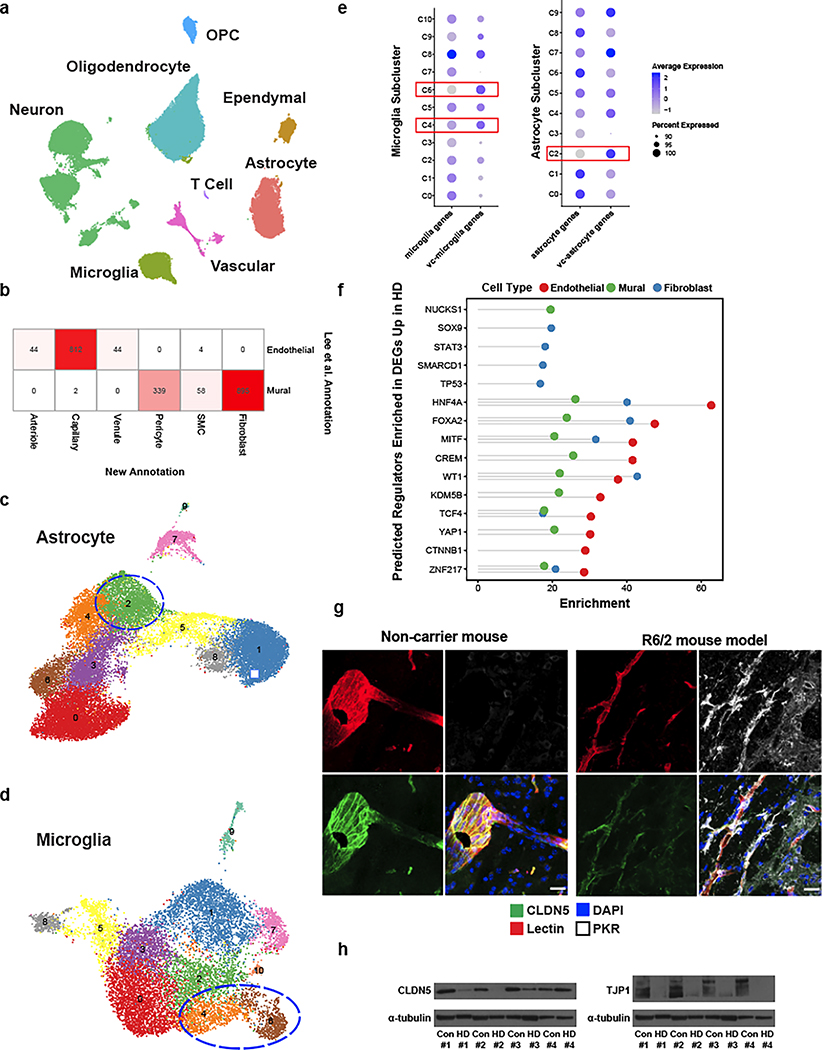
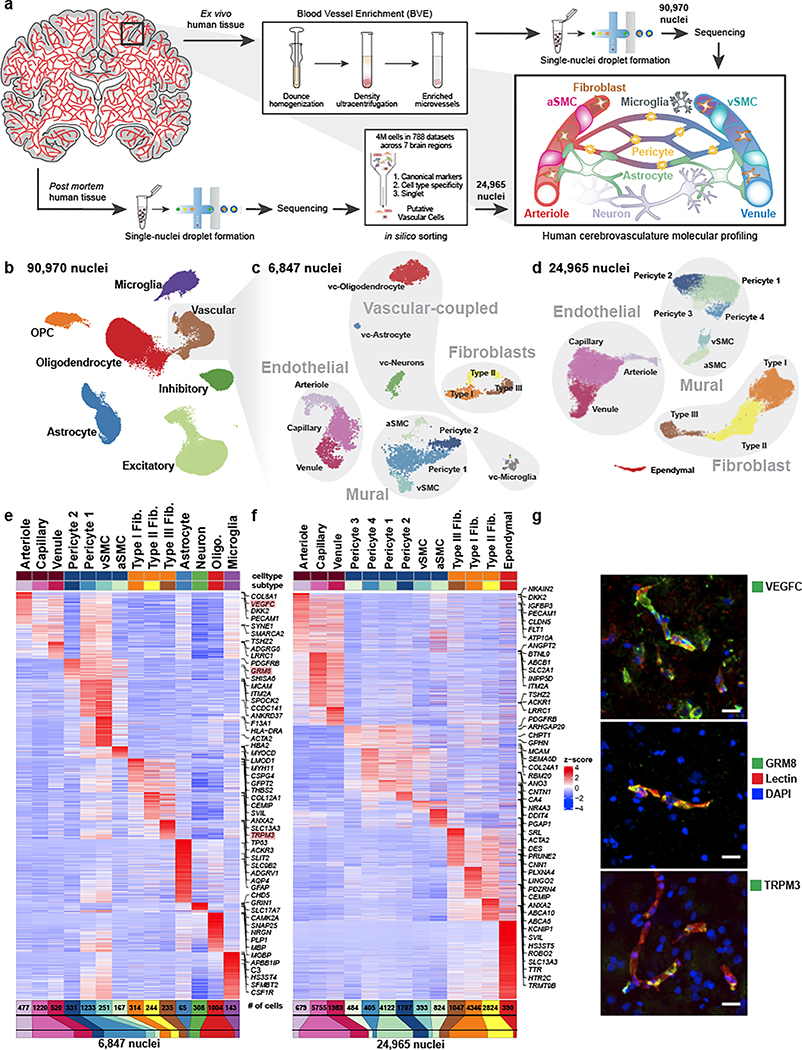
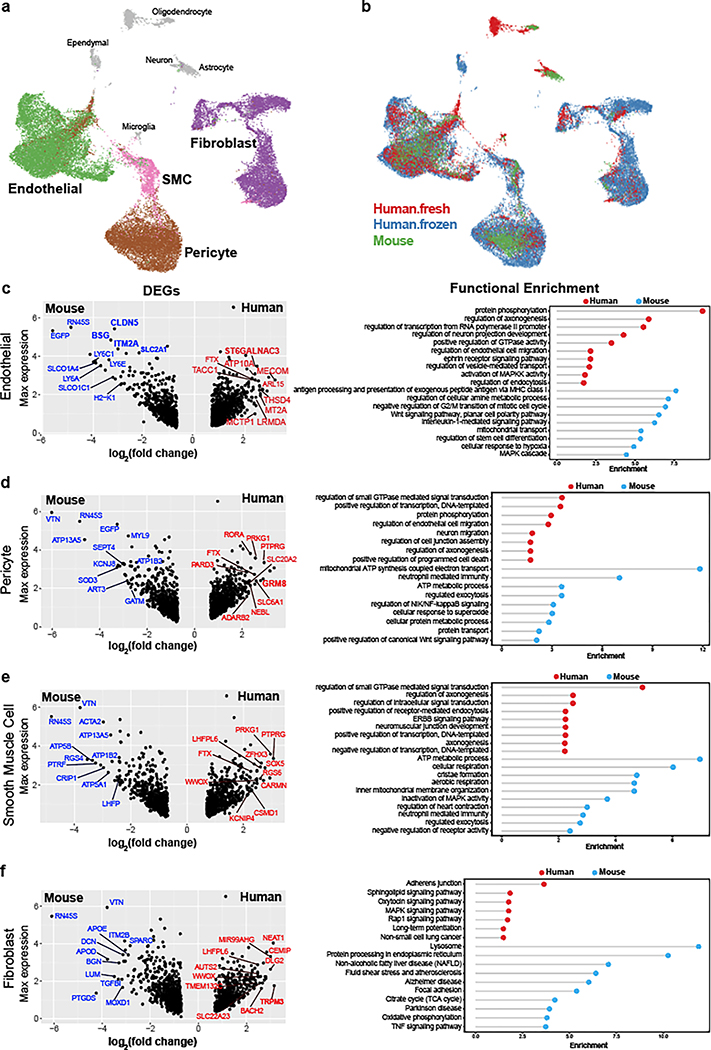
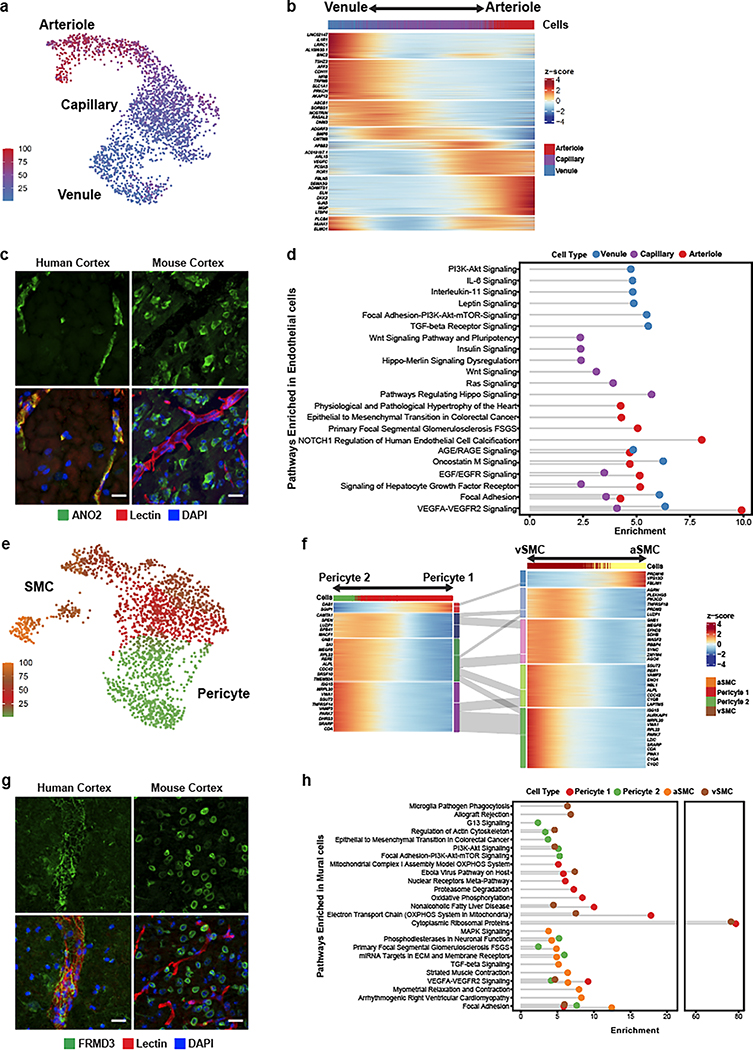
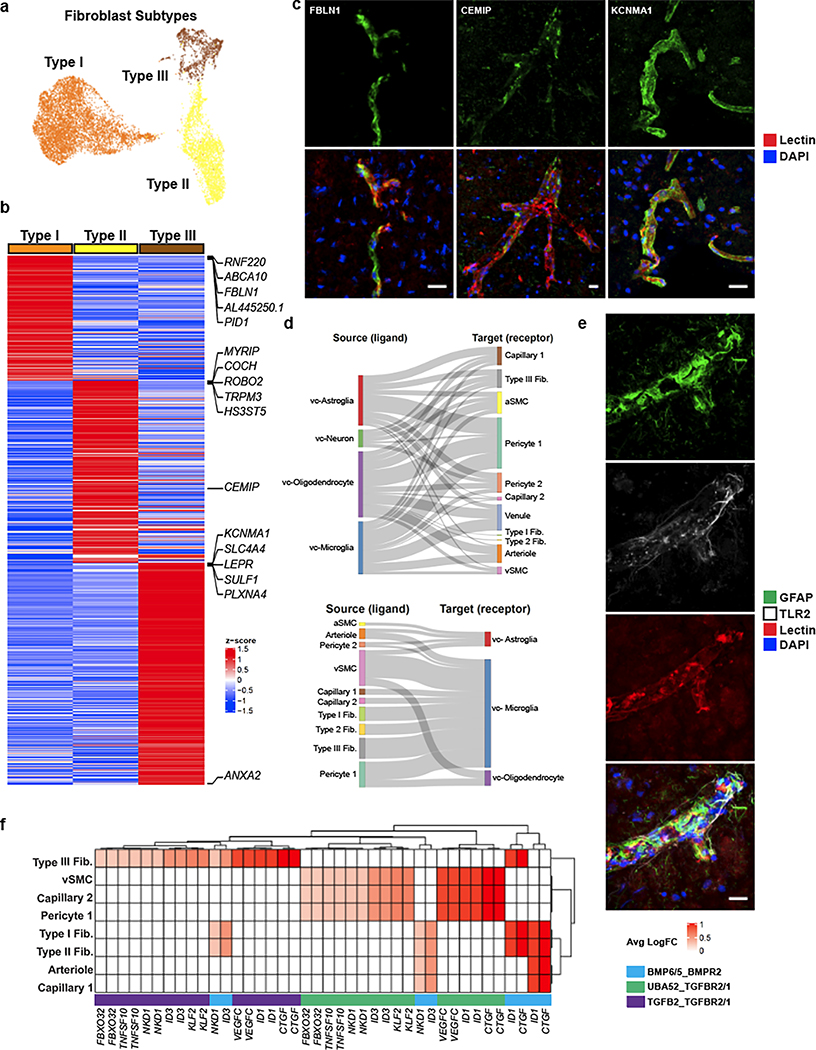
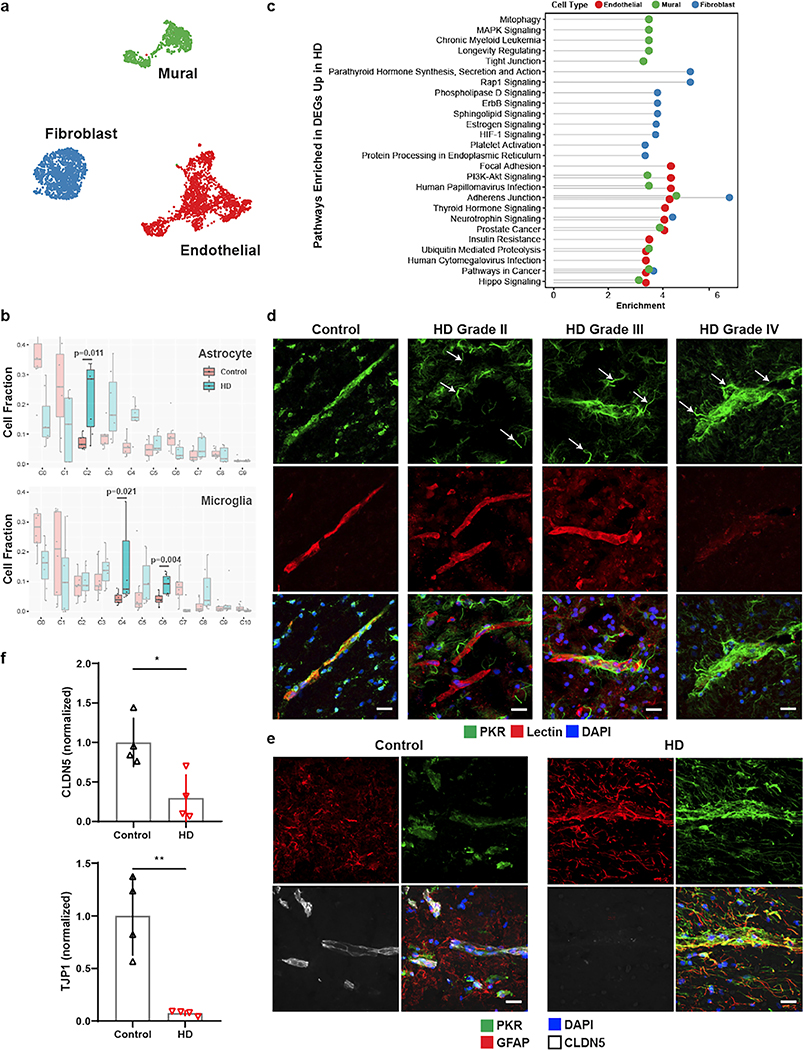
Despite the importance of the cerebrovasculature in maintaining normal brain physiology and in understanding neurodegeneration and drug delivery to the central nervous system1, human cerebrovascular cells remain poorly characterized owing to their sparsity and dispersion. Here we perform single-cell characterization of the human cerebrovasculature using both ex vivo fresh tissue experimental enrichment and post mortem in silico sorting of human cortical tissue samples. We capture 16,681 cerebrovascular nuclei across 11 subtypes, including endothelial cells, mural cells and three distinct subtypes of perivascular fibroblast along the vasculature. We uncover human-specific expression patterns along the arteriovenous axis and determine previously uncharacterized cell-type-specific markers. We use these human-specific signatures to study changes in 3,945 cerebrovascular cells from patients with Huntington's disease, which reveal activation of innate immune signalling in vascular and glial cell types and a concomitant reduction in the levels of proteins critical for maintenance of blood-brain barrier integrity. Finally, our study provides a comprehensive molecular atlas of the human cerebrovasculature to guide future biological and therapeutic studies.


Figures

Extended Data Figure 1.
Extended Data Figure 1.. Validation of Blood Vessel Enrichment (BVE) protocol.
a. qPCR of canonical cell type markers for endothelial (Cldn5, Abcb1a, Mfsd2a), mural (Pdgfrb, Acta2, Myh11), astrocytes (Aqp4, Aldh1l1), oligodendrocytes (Mog), neurons (Rbfox3), and microglia (Aif1) from mouse cortex, n=3, two-tailed t test, *p < 0.01, **p < 0.001, ***p < 0.0001,****p < 0.00001, n.s. = not significant. b. Immunofluorescence of blood vessels enriched from mouse cortex using the BVE protocol. Scale bar, 20μm
Extended Data Figure 2.
Extended Data Figure 2.. Characterization of human snRNA-seq data from human temporal cortex.
a. UMAP of ex vivo dataset by patient ID. b. UMAP of ex vivo dataset by experimental protocol. c. Heatmap of top differentially expressed genes in major cell types from ex vivo human tissue. d. UMAP sub-clustering of excitatory neurons. e. UMAP sub-clustering of inhibitory neurons. f. Correlation heatmap between ex vivo and post mortem vascular cell types
Extended Data Figure 3.
Extended Data Figure 3.. Integrative analysis of ex vivo, post mortem, and mouse datasets.
a. Cell fraction distribution of single nuclei across all datasets by cerebrovasculature cell type. b. Cell number distribution of single nuclei across all datasets by cerebrovasculature cell type. c. Venn diagram overlaps of genes between human post mortem vs. mouse and human ex vivo vs. mouse.
Extended Data Figure 4.
Extended Data Figure 4.. Zonation gene expression analysis of human endothelial cells.
a. Heatmap of 147 zonated transcription factors along the endothelial gradient. b. Heatmap of 76 zonated transporters along the endothelial gradient.
Extended Data Figure 5.
Extended Data Figure 5.. Zonation in human brain endothelial cells.
a. Indirect immunofluorescence of TSHZ2 expression in human and mouse brain cortex. b. Indirect immunofluorescence of MT1E/MT1 expression in human and mouse brain cortex. c. Indirect immunofluorescence of MT2A/MT2 expression in human and mouse brain cortex. d. Enriched Gene Ontology terms in endothelial zones.
Extended Data Figure 6.
Extended Data Figure 6.. Zonation gene expression analysis of human pericytes.
a. Heatmap of zonated transcription factors along the pericyte gradient. b. Heatmap of zonated transporters along the pericyte gradient.
Extended Data Figure 7.
Extended Data Figure 7.. Zonation gene expression analysis of human SMCs.
a. Heatmap of zonated transcription factors along the SMC gradient. b. Heatmap of zonated transporters along the SMC gradient. c. Overlap matrix across the zonated pericyte and SMC clusters.
Extended Data Figure 8.
Extended Data Figure 8.. Zonation in human brain mural cells.
a. Indirect immunofluorescence of GRM8 expression in human and mouse brain cortex. b. Indirect immunofluorescence of MRC1 expression in human and mouse brain cortex. c. Enriched Gene Ontology terms in mural zones. d. Indirect immunofluorescence of SLC20A2 expression in human and mouse brain cortex. e. Indirect immunofluorescence of SLC30A10 expression in human and mouse brain cortex. Scale bar, 20μm
Extended Data Figure 9.
Extended Data Figure 9.. Pathway and Gene Ontology analyses of perivascular fibroblast subtypes.
a. Enriched pathway analysis in perivascular fibroblast subtypes. b. Enriched Gene Ontology analysis in perivascular fibroblast subtypes. c. Pseudotime analysis of ex vivo fibroblast subtypes. d. Pseudotime analysis of ex vivo fibroblast subtypes and Pericyte 2 (note: Pericyte 1 not shown as it did not fall within any pseudotime trajectory).
Extended Data Figure 10.
Extended Data Figure 10.. Vascular-coupled (vc) cell types in the ex vivo snRNA-seq data.
a. Thresholding parameters for doublet detection. b. UMAP of determined singlet/doublets in human ex vivo samples. c. Heatmap of DEGs in canonical, vascular, and vascular-coupled cell types. d. Gene ontology enrichment in vc-cell types. e. Immunofluorescence of NeuN (RBFOX3)-expressing neurons, with a subset adjacent to blood vessels. f. Indirect immunofluorescence staining of GFAP-expressing astrocytes (left panels) and GFAP-vc-astrocytes (right panels). TLR2 expressing vc-astrocytes are perivascular compared to canonical astrocytes.
Extended Data Figure 11.
Extended Data Figure 11.. Cerebrovascular profiling in Huntington’s disease.
a. UMAP of integrated single nuclei from post mortem control and HD human patient samples. b. Comparison of cerebrovasculature cell annotations (in cell numbers) in this study vs. Lee et al. c. UMAP analysis of astrocyte subclusters in HD. Vasculature-coupled astrocytes outlined in blue. d. UMAP analysis of microglia subclusters in HD. Vasculature-coupled microglia outlined in blue. e. Dot plot signature score comparison of glial subclusters with respective vc-cell type annotations. Red boxes indicate vc-cell types. f. ChEA prediction of top 10 regulators of upregulated genes in HD endothelial, mural, and fibroblasts cells. g. PKR immunoreactivity in the R6/2 HD mouse model engulfs blood vessels with low CLDN5 expression. h. Western blots for tight junction proteins CLDN5 and TJP1 from human HD and control samples. Scale bar, 20μm.
Figure 1.
Figure 1.. snRNA-seq profiling of the human cerebrovasculature.
a. Experimental schematic. b. Global Uniform Manifold Approximation and Projection (UMAP) of 90,970 profiled nuclei from ex vivo human temporal cortex. c. UMAP of 6,847 profiled vascular nuclei from the highlighted cluster in b. d. UMAP of 24,965 in silico sorted vascular nuclei from post mortem human brains. e,f. Highly expressed genes of sub-clusters in c and d, respectively. g. Validation of markers VEGFC, GRM8, and TRPM3 by indirect immunofluorescence staining (each in green pseudocolor). Scale bar, 20μm.
Figure 2.
Figure 2.. Integrative analysis of human ex vivo, post mortem, and mouse cerebrovascular cell types.
a-b. UMAP visualization of integrated cells from human ex vivo, human post mortem and mouse, coloring by cell types (a) and data source (b). All vessel-coupled cells were colored in grey. c-f. Differentially expressed genes between human and mouse in endothelial (c, left), pericyte (d, left), smooth muscle cells (e, left), and fibroblast (f, left). X-axis represents the log-transformed fold change and y-axis represents the maximal expression level. The top 20 genes are highlighted in blue for mouse and red for human. Genes that were also cell type markers are bolded. c-f. (right panels), the representative functional enriched terms of human- and mouse-specific/highly expressed genes.
Figure 3.
Figure 3.. Molecular zonation of human brain endothelial and mural cells.
a. Zonal gradient of endothelial cell transcriptomes. b. Highly expressed genes along the endothelial gradient. c. Indirect immunofluorescence of human endothelial marker ANO2, and mouse homolog Ano2, expression in brain cortex. d. Pathway analysis along endothelial zones. e. Zonal gradient of mural cell transcriptomes. f. Highly expressed genes along the mural gradients. g. Indirect immunofluorescence of the human mural marker FRMD3, and mouse homolog Frmd3, expression in brain cortex. h. Pathway analysis along mural zones. Scale bar, 20μm.
Figure 4.
Figure 4.. Cell types coupled to the human cerebrovasculature.
a. UMAP of integrated perivascular fibroblast subtypes from human ex vivo and in silico sorted brains. b. Highly expressed genes in fibroblast subtypes. c. Indirect immunofluorescence of fibroblast markers CEMIP, TRPM3, and KCNMA1 expression. d. Cell-cell interaction Sankey plots between vascular cell types (endothelial, mural, fibroblast) and canonical cell types (astrocyte, neurons, microglia, oligodendrocytes). e. Indirect immunofluorescence of GFAP/TLR2 expressing astrocytes coupled with the cerebrovasculature. f. Heatmap of ligand-receptor pairings in vascular cells (ligand) and microglia (receptor) and downstream target. Scale bar, 20μm.
Figure 5.
Figure 5.. Innate immune activation related to cerebrovascular dysfunction in Huntington’s disease (HD).
a. UMAP of integrated cerebrovasculature cells in post mortem control and HD human patients. b. Cell fraction analysis of astrocyte and microglia subclusters; statistics shown for highlighted clusters using the Wilcoxon rank-sum test. Center-line denotes the median; box limits denote the upper and lower quartiles; and whiskers denote the 1.5x interquartile range. c. Pathway analysis of the top 10 enriched upregulated pathways in HD endothelial, mural, and fibroblasts cells. d. PKR immunostaining in perivascular glial processes across various HD grades. PKR is normally detected in the vasculature in control samples; arrows indicate PKR-immunopositive vasculature-coupled glial processes that become apparent in HD samples only. e. PKR immunostaining co-localizes with GFAP and engulfs blood vessels with low CLDN5 expression. f. Western blot quantification for tight junction proteins CLDN5 and TJP1. Scale bar, 20μm. WB: two-tailed t test, *p < 0.01, **p < 0.001. Error bars denote standard deviation.

References

    1. Sweeney MD, Kisler K, Montagne A, Toga AW & Zlokovic BV The role of brain vasculature in neurodegenerative disorders. Nat. Neurosci. 21, 1318–1331 (2018). - PMC - PubMed
    1. O’Brown NM, Pfau SJ & Gu C Bridging barriers: a comparative look at the blood–brain barrier across organisms. Genes & Development vol. 32 466–478 (2018). - PMC - PubMed
    1. Vanlandewijck M et al. A molecular atlas of cell types and zonation in the brain vasculature. Nature 554, 475–480 (2018). - PubMed
    1. Kirst C et al. Mapping the Fine-Scale Organization and Plasticity of the Brain Vasculature. Cell 180, 780–795.e25 (2020). - PubMed
    1. Montagne A et al. Blood-brain barrier breakdown in the aging human hippocampus. Neuron 85, 296–302 (2015). - PMC - PubMed