. 2022 Feb 4;12(3):376.
doi: 10.3390/ani12030376.

Time Series Ovarian Transcriptome Analyses of the Porcine Estrous Cycle Reveals Gene Expression Changes during Steroid Metabolism and Corpus Luteum Development

Affiliations

Time Series Ovarian Transcriptome Analyses of the Porcine Estrous Cycle Reveals Gene Expression Changes during Steroid Metabolism and Corpus Luteum Development

Yejee Park et al. Animals (Basel). .

Abstract

The porcine estrous cycle is influenced by reproductive hormones, which affect porcine reproduction and result in physiological changes in the reproductive organs. The ovary is involved in ovulation, luteinization, corpus luteum development, and luteolysis. Here, we aimed to provide a comprehensive understanding of the gene expression patterns in porcine ovarian transcriptomes during the estrous cycle through differentially expressed genes profiling and description of molecular mechanisms. The transcriptomes of porcine ovary were obtained during the estrous cycle at three-day intervals from day 0 to day 18 using RNA-seq. At seven time points of the estrous cycle, 4414 DEG were identified; these were classified into three clusters according to their expression patterns. During the late metestrus and diestrus periods, the expression in cluster 1 increased rapidly, and steroid biosynthesis was significant in the pathway. Cluster 2 gene expression patterns represented the cytokine-cytokine receptor interaction in significant pathways. In cluster 3, the hedgehog signaling pathway was selected as the significant pathway. Our study exhibited dynamic gene expression changes with these three different patterns of cluster 1, 2, and 3. The results helped identify the functions and related significant genes especially during the late metestrus and diestrus periods in the estrous cycle.

Keywords: corpus luteum; differentially expressed gene analysis; estrous cycle; gene expression; ovarian transcriptome; pigs.


Conflict of interest statement

The authors declare that there are no conflicts of interests.

Figures

Figure 1
Figure 1
Overview of ovary sampling throughout the porcine estrous cycle. Stages of the estrous cycle in porcine ovary at seven time points (D00, D03, D06, D09, D12, D15, and D18).
Figure 2
Figure 2
Dynamic changes of differentially expressed genes (DEG) during the porcine estrous cycle. Dynamic views and expression patterns of DEG using a volcano plot and k-medians clustering algorithm in Multi Experiment Viewer (MeV). (a) Comparing the start of estrous cycle (D00) with each time point (D03, D06, D09, D12, D15, and D18). The x and y axes of the volcano plots were scaled using log2 fold changes and −log10 p-value. Significant DEG (false discovery rate < 0.05; log2FC ≤ |1|: total, log2FC ≥ 1: up, log2FC ≤ −1: down; the total number of DEG: n) in the volcano plots are represented by six different colors corresponding to each time point. The line graph reveals the changes in the number of DEG (up, down) for each time point. (bd) Gene clustering analysis disclosed three clear expression patterns for each time point (N: the number of DEG against each cluster).
Figure 3
Figure 3
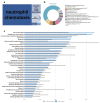
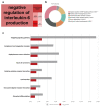
Visualization of functional analyses of cluster 1. (a) A biological process (BP) treemap was constructed using REVIGO. (b) BP pie graph using Cytoscape (** p < 0.05). (c) Bar graph of Kyoto Encyclopedia of Genes and Genomes (KEGG) pathways.
Figure 4
Figure 4
Pathway-based expression information including DEG of cluster 1. (a) Log2FC change in the genes of the steroid biosynthesis (KEGG) using clusterProfiler at D06 and DEG in the pathway were marked. (b) Heatmap of selected DEG on comparing D06 with D00.
Figure 5
Figure 5
Visualization of functional analyses of cluster 2. (a) A BP treemap was constructed using REVIGO. (b) BP pie graph using Cytoscape (** p < 0.05). (c) Bar graph of KEGG pathways.
Figure 6
Figure 6
Pathway based expression information including DEG of cluster 2. (a) Log2FC change in the genes of the cytokine–cytokine receptor interaction (KEGG) using clusterProfiler at D06 and DEG in the pathway were marked. (b) Heatmap of selected DEG on comparing D06 with D00.
Figure 7
Figure 7
Visualization of functional analyses of cluster 3. (a) A BP treemap was constructed using REVIGO. (b) BP pie graph using Cytoscape (** p < 0.05). (c) Bar graph of KEGG pathways.
Figure 8
Figure 8
Pathway-based expression information including DEG of cluster 3. (a) Log2FC change in the genes of the hedgehog signaling pathway (KEGG) using clusterProfiler at D06 and DEG in the pathway were marked. (b) Heatmap of selected DEG on comparing D06 with D00.

References

    1. Soede N., Langendijk P., Kemp B. Reproductive cycles in pigs. Anim. Reprod. Sci. 2011;124:251–258. doi: 10.1016/j.anireprosci.2011.02.025. - DOI - PubMed
    1. Zhang X., Huang L., Wu T., Feng Y., Ding Y., Ye P., Yin Z. Transcriptomic analysis of ovaries from pigs with high and low litter size. PLoS ONE. 2015;10:e0139514. - PMC - PubMed
    1. Zhang F.P., Ran X.Q. Changes in Ovary Transcriptome and Alternative splicing at estrus from Xiang pigs with Large and Small Litter Size. bioRxiv. 2019:547810. doi: 10.1101/547810. - DOI
    1. Meurens F., Summerfield A., Nauwynck H., Saif L., Gerdts V. The pig: A model for human infectious diseases. Trends Microbiol. 2012;20:50–57. doi: 10.1016/j.tim.2011.11.002. - DOI - PMC - PubMed
    1. Edson M.A., Nagaraja A.K., Matzuk M.M. The mammalian ovary from genesis to revelation. Endocr. Rev. 2009;30:624–712. doi: 10.1210/er.2009-0012. - DOI - PMC - PubMed

LinkOut - more resources