. 2022 Jan 22;14(3):561.
doi: 10.3390/cancers14030561.

Development of Preclinical Ultrasound Imaging Techniques to Identify and Image Sentinel Lymph Nodes in a Cancerous Animal Model

Affiliations

Development of Preclinical Ultrasound Imaging Techniques to Identify and Image Sentinel Lymph Nodes in a Cancerous Animal Model

Marion Bacou et al. Cancers (Basel). .

Abstract

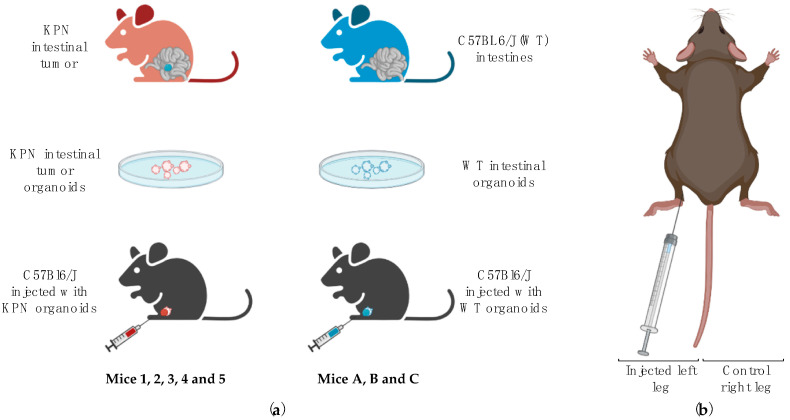
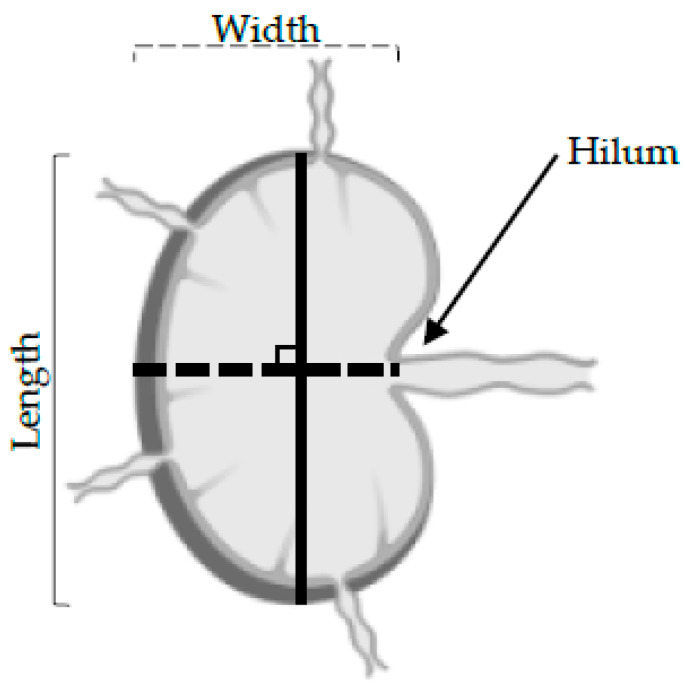
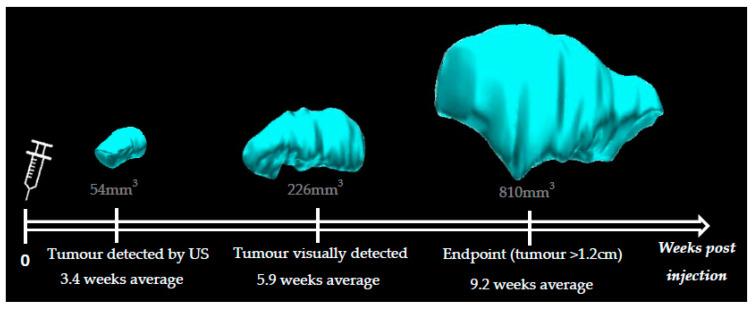
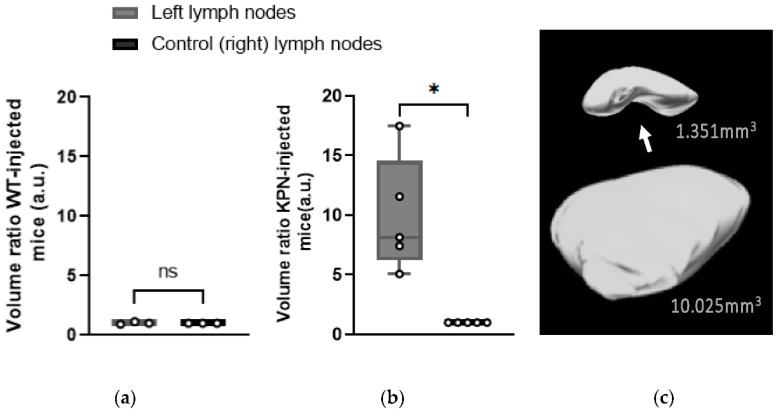
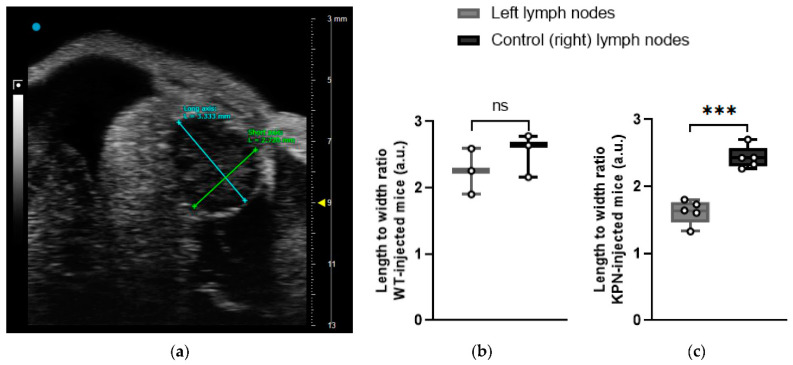
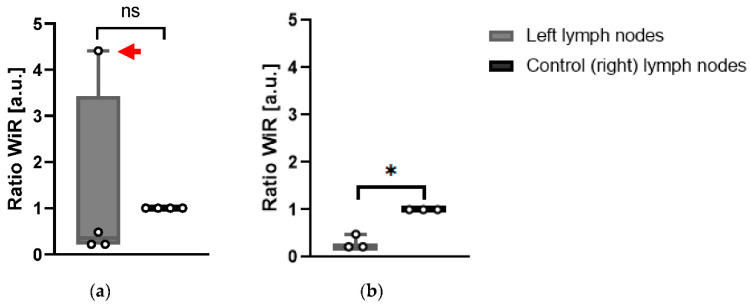
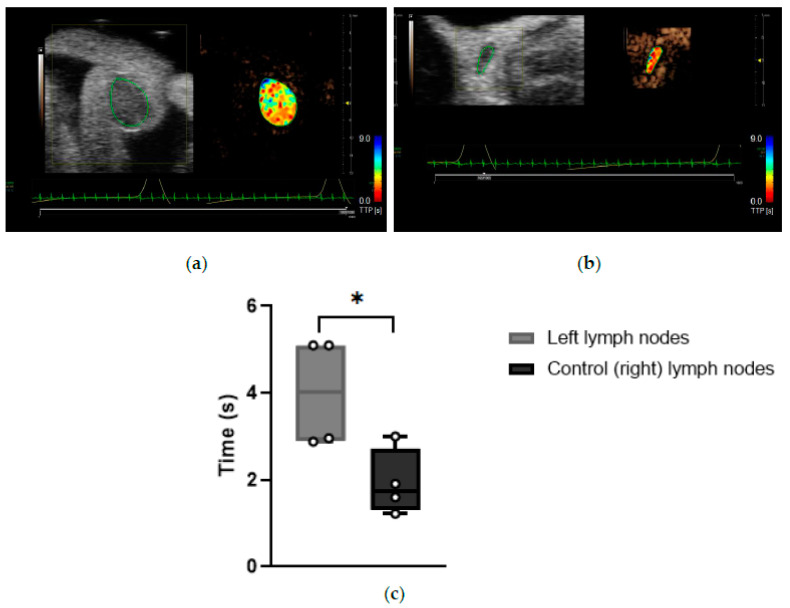
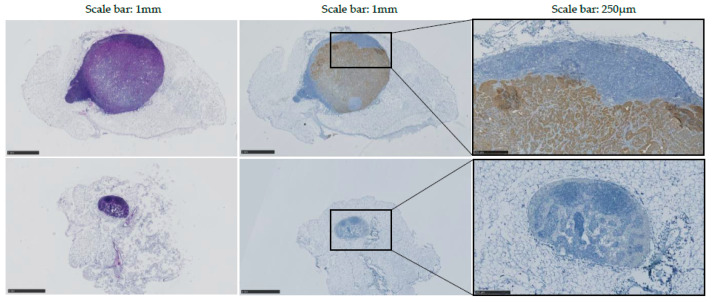
Lymph nodes (LNs) are believed to be the first organs targeted by colorectal cancer cells detached from a primary solid tumor because of their role in draining interstitial fluids. Better detection and assessment of these organs have the potential to help clinicians in stratification and designing optimal design of oncological treatments for each patient. Whilst highly valuable for the detection of primary tumors, CT and MRI remain limited for the characterization of LNs. B-mode ultrasound (US) and contrast-enhanced ultrasound (CEUS) can improve the detection of LNs and could provide critical complementary information to MRI and CT scans; however, the European Federation of Societies for Ultrasound in Medicine and Biology (EFSUMB) guidelines advise that further evidence is required before US or CEUS can be recommended for clinical use. Moreover, knowledge of the lymphatic system and LNs is relatively limited, especially in preclinical models. In this pilot study, we have created a mouse model of metastatic cancer and utilized 3D high-frequency ultrasound to assess the volume, shape, and absence of hilum, along with CEUS to assess the flow dynamics of tumor-free and tumor-bearing LNs in vivo. The aforementioned parameters were used to create a scoring system to predict the likelihood of a disease-involved LN before establishing post-mortem diagnosis with histopathology. Preliminary results suggest that a sum score of parameters may provide a more accurate diagnosis than the LN size, the single parameter currently used to predict the involvement of an LN in disease.

Keywords: 3D ultrasound; colorectal cancer; contrast-enhanced ultrasound; lymph node; metastatic mouse model; preclinical.


Conflict of interest statement

The authors declare no conflict of interest.

Figures

Figure 1
Figure 1
(a) KPN [13,14] or WT organoids were generated from KPN or C57BL6/J mice, respectively, and were injected into the hind leg of C57BL6/J mice. Animals injected with KPN intestinal tumor organoids are referred to as KPN-injected animals (Mice 1, 2, 3, 4, and 5), and mice injected with WT intestinal organoids are labeled WT-injected animals (Mice A, B, and C); (b) Each mouse was injected with ~150 disrupted KPN or WT organoids resuspended in 50 μL complete medium. Injections were performed in the hock of the left hind leg. The right leg of each mouse was not injected and was used as an internal control. Images generated using BioRender.com (accessed on 4 January 2021).
Figure 2
Figure 2
Schematic of a LN. Shape was determined by measuring the longest longitudinal diameter found on the 3D US data and 2D B-mode image acquired during the 3D reconstruction was inspected for the presence of a hilum.
Figure 3
Figure 3
3D reconstitutions of the hind leg tumor of KPN-injected mouse 2 over time. The leg tumors from KPN-injected animals were detected by ultrasound from 2.5 weeks post organoids injection (3.4 weeks average) and visually detected from 4 weeks post injection (5.9 weeks average). Average endpoint was reached 9.2 weeks post organoid injection. Average size of the tumor at 3.4, 5.9, and 9.2 weeks was 54 mm3, 226 mm3, and 810 mm3, respectively.
Figure 4
Figure 4
Volume ratio of the left inguinal LNs compared to the control (right) LNs at endpoint. (a) Mice injected with WT intestinal organoids (n = 3 mice); (b) mice injected with KPN intestinal tumor organoids (n = 5 mice). Paired t-test analysis. ns: p > 0.05; *: p < 0.05; (c) Representative 3D reconstitutions of right control (top image) and left tumor-draining (bottom image) inguinal LNs from KPN-injected animals at endpoint and their respective volumes. Arrow: hilum of the LN containing the efferent lymphatic vessels and blood vessels. No hilum was detected on the tumor-draining LN (bottom image).
Figure 5
Figure 5
(a) 3D-US frame showing hypoechogenic tumor-draining inguinal LN. The long axis was defined as the longest diameter across all frames of the US data, and the short axis was determined as the longest perpendicular diameter from the same frame used for the long axis. (b) Length–width ratio of left and control (right) LNs of WT-injected animals is not significantly different (n = 3 mice); (c) length–width ratio of left and control (right) LNs of KPN-injected animals is significantly different (n = 5 mice). Paired t-test analysis. ns: p > 0.05; ***: p < 0.001.
Figure 6
Figure 6
(a) Wash-in rate ratios of left LNs compared to control (right) inguinal LNs of KPN-injected mice. Red arrow: Mouse 4 tumor-draining LN WiR different from other left LNs (n = 4); (b) Wash-in rate ratios without Mouse 4 (n = 3) (extreme outlier-reason for exclusion indicated in Section 3, Section 4 and Section 5). Paired t-test analysis. ns: p > 0.05; * p < 0.05.
Figure 7
Figure 7
(a) Representative software analysis image showing time to peak of a tumor-draining inguinal LN. Heat maps represent the time the contrast agent took to reach peak enhancement. Blue: long TTP; red: short TTP. (b) Representative software analysis image showing time-to-peak of a control (right) inguinal LN. Heat maps represent the time the contrast agents took to reach peak enhancement. Blue: long TTP; red: short TTP. (c) Time-to-peak of tumor-draining and control (right) inguinal LNs (n = 4 mice). *: p < 0.05.
Figure 8
Figure 8
H&E and immunostaining of Mouse 1 KPN-injected LN; 80% (4/5) of KPN-injected mice presented detectable metastasis at endpoint. Top: left inguinal LN; bottom: control (right) inguinal LN. Left panels: H&E staining; middle and right panels: Cytokeratin 7 staining intestinal tumor in brown.

References

    1. Sung H., Ferlay J., Siegel R.L., Laversanne M., Soerjomataram I., Jemal A., Bray F. Global Cancer Statistics 2020: Globocan Estimates of Incidence and Mortality Worldwide for 36 Cancers in 185 Countries. CA Cancer J. Clin. 2021;71:209–249. doi: 10.3322/caac.21660. - DOI - PubMed
    1. Seyfried T.N., Huysentruyt L.C. On the Origin of Cancer Metastasis. Crit. Rev. Oncog. 2013;18:43–73. doi: 10.1615/CritRevOncog.v18.i1-2.40. - DOI - PMC - PubMed
    1. ARecio-Boiles A., Waheed A., Cancer B.C. StatPearls. StatPearls Publishing; Treasure Island, FL, USA: 2020. Colon.
    1. Lahaye M.J., Engelen S.M.E., Nelemans P.J., Beets G.L., van de Velde C.J.H., van Engelshoven J.M.A., Beets-Tan R.G.H. Imaging for Predicting the Risk Factors—The Circumferential Resection Margin and Nodal Disease—of Local Recurrence in Rectal Cancer: A Meta-Analysis. Semin. Ultrasound CT MRI. 2005;26:259–268. doi: 10.1053/j.sult.2005.04.005. - DOI - PubMed
    1. Van Cutsem E., Verheul H.M.W.H., Flamen P., Rougier P., Beets-Tan R., Glynne-Jones R., Seufferlein T. Imaging in Colorectal Cancer: Progress and Challenges for the Clinicians. Cancers. 2016;8:81. doi: 10.3390/cancers8090081. - DOI - PMC - PubMed

LinkOut - more resources