. 2022 Feb 6;14(3):818.
doi: 10.3390/cancers14030818.

Early Predictor Tool of Disease Using Label-Free Liquid Biopsy-Based Platforms for Patient-Centric Healthcare

Affiliations

Early Predictor Tool of Disease Using Label-Free Liquid Biopsy-Based Platforms for Patient-Centric Healthcare

Wei Li et al. Cancers (Basel). .

Abstract

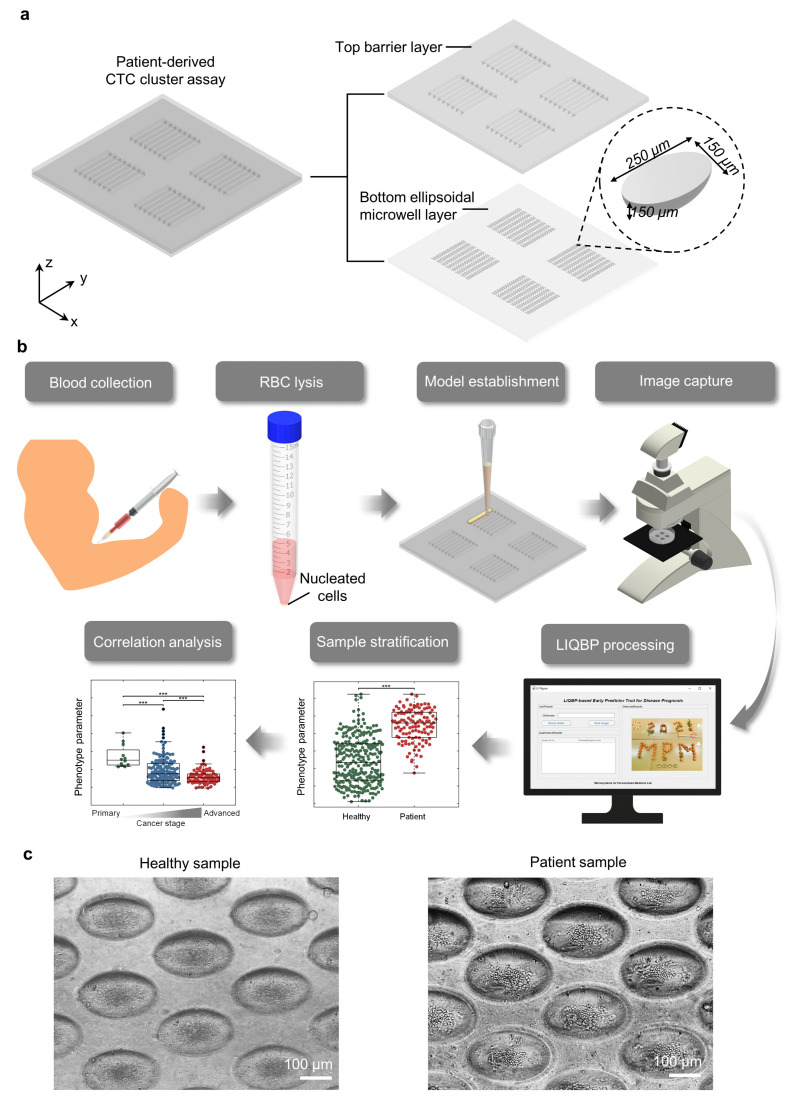
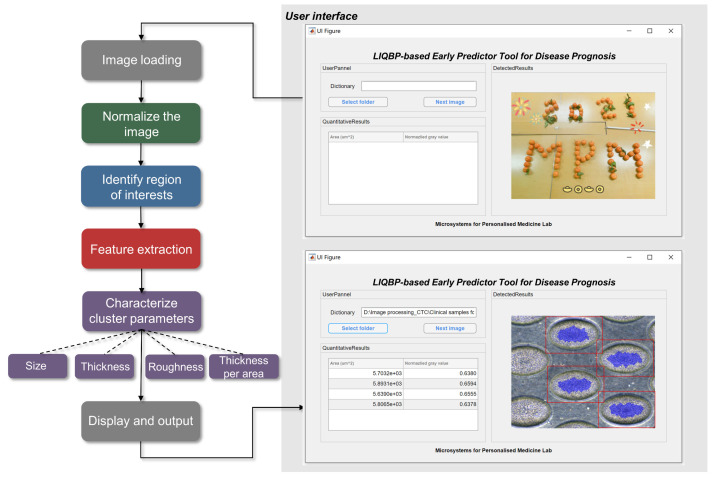
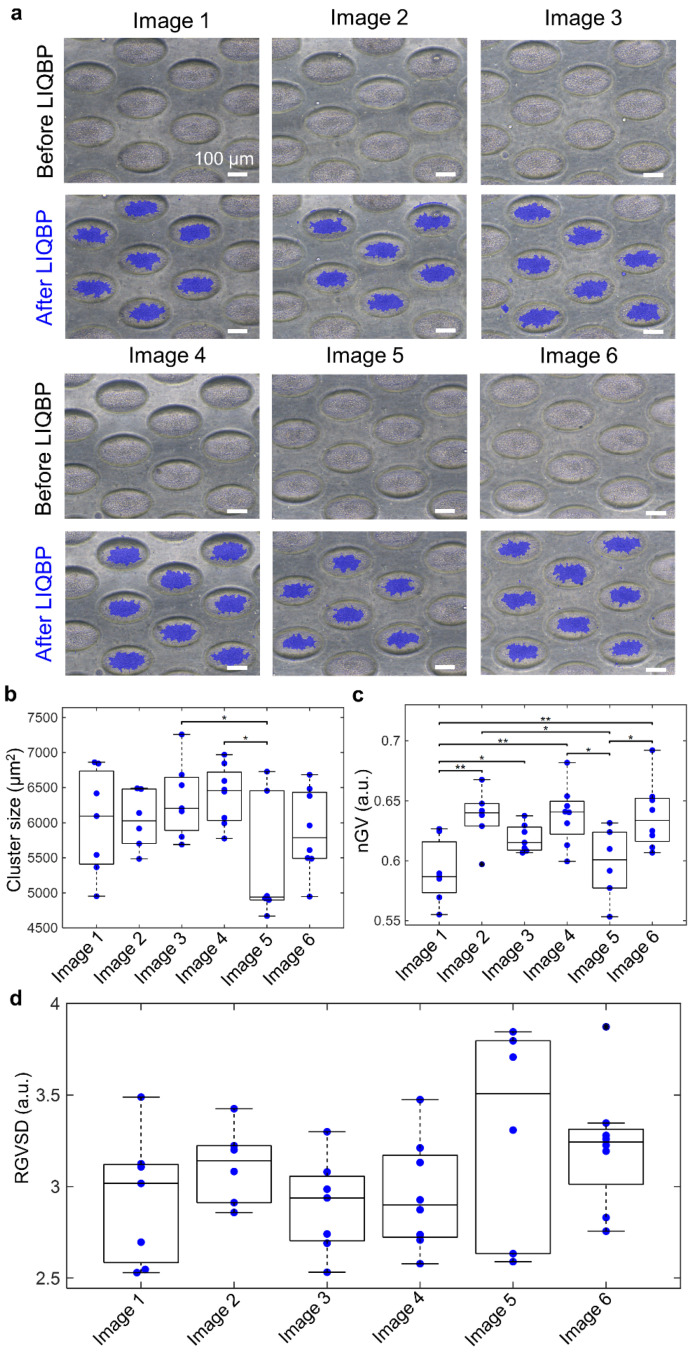
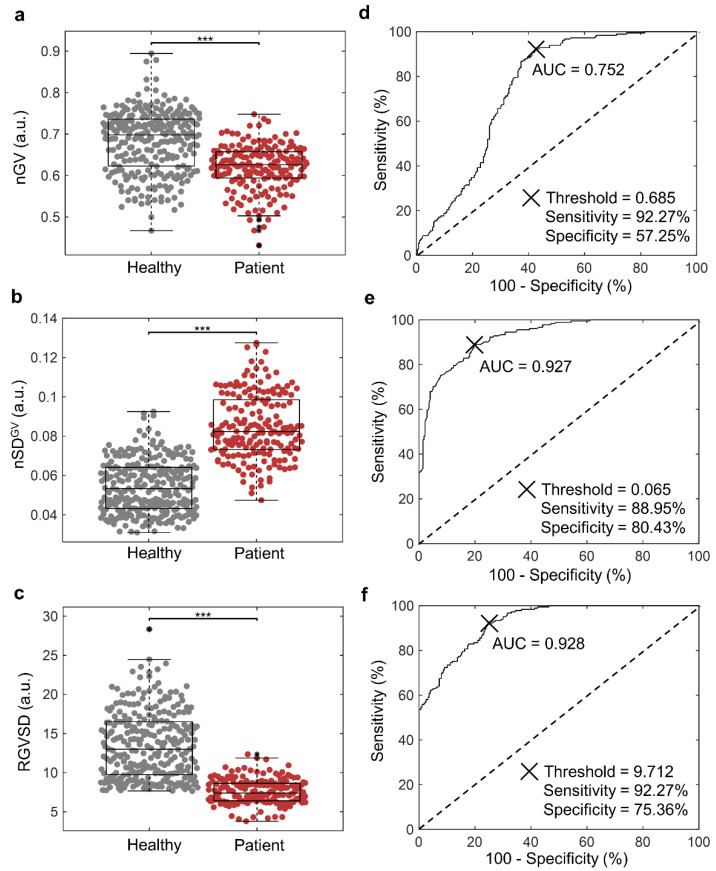
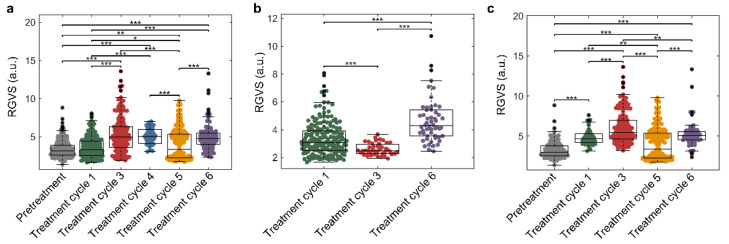
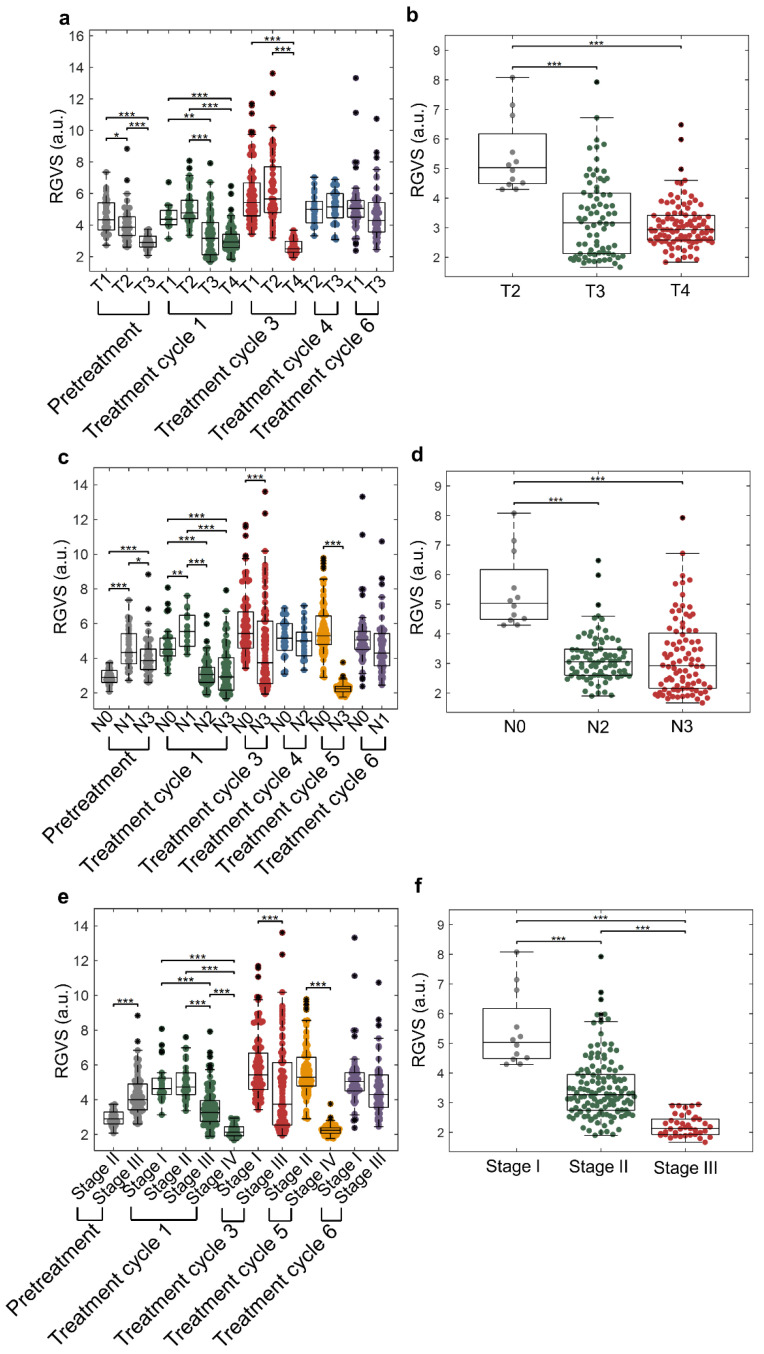
Cancer cells undergo phenotypic changes or mutations during treatment, making detecting protein-based or gene-based biomarkers challenging. Here, we used algorithmic analysis combined with patient-derived tumor models to derive an early prediction tool using patient-derived cell clusters from liquid biopsy (LIQBP) for cancer prognosis in a label-free manner. The LIQBP platform incorporated a customized microfluidic biochip that mimicked the tumor microenvironment to establish patient clusters, and extracted physical parameters from images of each sample, including size, thickness, roughness, and thickness per area (n = 31). Samples from healthy volunteers (n = 5) and cancer patients (pretreatment; n = 4) could be easily distinguished with high sensitivity (91.16 ± 1.56%) and specificity (71.01 ± 9.95%). Furthermore, we demonstrated that the multiple unique quantitative parameters reflected patient responses. Among these, the ratio of normalized gray value to cluster size (RGVS) was the most significant parameter correlated with cancer stage and treatment duration. Overall, our work presented a novel and less invasive approach for the label-free prediction of disease prognosis to identify patients who require adjustments to their treatment regime. We envisioned that such efforts would promote the management of personalized patient care conveniently and cost effectively.

Keywords: algorithmic analysis; disease prognosis; label free; patient-derived cell clusters; personalized patient care.


Conflict of interest statement

One or more authors have a patent related to this work.

Figures

Figure 1
Figure 1
Using a patient-derived tumour model from a liquid biopsy (LIQBP) with multiple phenotyping for label-free prediction of disease prognosis. (a) Schematic illustration of the multiplexed tumor model with four units. The model was established within a microfluidic device with a top barrier layer and a bottom ellipsoidal microwell layer. Each array had eight channels comprising 300 microwells each. (b) Workflow for the establishment of tumor models. Peripheral blood was collected from the vein of the patient. The blood sample was lysed to remove red blood cells, and the remaining nucleated cell fraction was seeded for culturing over 14 days. Images of cultured cells were captured by a phase-contrast microscope and analyzed via LIQBP for sample stratification, with a clear distinction between patient and healthy samples. The clusters could be classified as four core phenotypes, covering the parameters of cluster size, thickness, roughness, and TA. *** Represents p ≤ 0.001. (c) Representative grayscale images to demonstrate the distinct morphological differences between clusters established from healthy donors (left) and cancer patients (right). Scale bar, 100 μm.
Figure 2
Figure 2
Procedures of LIQBP with multiple phenotypes analysis. User interfaces and the workflow of LIQBP with label-free phenotyping analysis: the image was normalized by flat-field correction; regions of interest (ROI) were identified sequentially; cluster size and thickness were displayed and saved for further analysis.
Figure 3
Figure 3
Robustness validation of LIQBP. (a) Representative images before the LIQBP and their corresponding detected images after the LIQBP. These images are cell clusters cultured from one patient sample. Blue shades in the detected images represented the detected patient-derived cell cluster. Scale bar, 100 μm. (b) Boxplot of the size of patient-derived cell clusters. (c) Boxplot of nGV of patient-derived cell clusters. ** Represents p ≤ 0.01 and * represents p ≤ 0.05. (d) Boxplot of RGVS of patient-derived cell clusters. RGVS values across clusters of the same patient remained relatively constant.
Figure 4
Figure 4
Patient stratification of healthy and cancer patients with LIQBP. (ac): Boxplots illustrating correlation analysis of nGV (0.68 ± 0.07 and 0.62 ± 0.05), nSDGV (0.054 ± 0.013 and 0.085 ± 0.017) and RGVSD (13.50 ± 4.22 and 7.60 ± 1.57) for healthy and patient cohorts, respectively. *** Represents p ≤ 0.001. (df): Corresponding ROC analysis for (ac), respectively. The resultant AUC, threshold, sensitivity, and specificity analyses are as shown in the plots.
Figure 5
Figure 5
Clinical correlation between patient-derived cell cluster parameters and treatment cycle number. (a) Boxplot of RGVS against treatment cycle number, based on samples (Table 1; no. 6–22, 27–31; n = 22) obtained at pretreatment (3.45 ± 1.15), treatment cycle 1 (3.63 ± 1.31), treatment cycle 3 (5.29 ± 2.27), treatment cycle 4 (5.08 ± 1.02), treatment cycle 5 (4.02 ± 2.02), and treatment cycle 6 (4.97 ± 1.66). (b) Boxplots of RGVS against treatment cycle number, based on gastric cancer samples (n = 8) obtained at pretreatment (3.35 ± 1.21), treatment cycle 1 (2.61 ± 0.42), and treatment cycle 3 (4.67 ± 1.60). (c) Boxplots of RGVS against treatment cycle number, based on breast cancer samples (n = 10) obtained at pretreatment (3.26 ± 1.08), treatment cycle 1 (4.87 ± 1.01), treatment cycle 3 (6.04 ± 2.00), treatment cycle 5 (4.02 ± 2.02), and treatment cycle 6 (5.23 ± 1.68). *** Represents p ≤ 0.001, ** represents p ≤ 0.01, and * represents p ≤ 0.05.
Figure 6
Figure 6
Clinical correlation analysis of patient-derived cell clusters with cancer staging. (a,b) Boxplot of the RGVS of patient clusters versus T staging from 19 clinical samples (pretreatment (n = 3), treatment cycle 1 (n = 9), treatment cycle 3 (n = 3), treatment cycle 4 (n = 2), and treatment cycle 6 (n = 2)) and gastric cancer samples in treatment cycle 1 (Table 1; no. 6–9, 21–22; n = 6). (c,d) Boxplot analysis of patient clusters versus N staging from 21 clincal samples (pretreatment (n = 3), treatment cycle 1 (n = 9), treatment cycle 3 (n = 3), treatment cycle 4 (n = 2), treatment cycle 5 (n = 2), and treatment cycle 6 (n = 2)) and gastric cancer samples in treatment cycle 1 (n = 6). (e) Boxplots of the RGVS of patient clusters versus cancer stages (stage I to stage IV) from 19 clincial samples (pretreatment (n = 3), treatment cycle 1 (n = 9), treatment cycle 3 (n = 3), treatment cycle 5 (n = 2), and treatment cycle 6 (n = 2)). (f) Boxplots of the RGVS of patient clusters versus cancer stages (stage I and stage III) from gastric cancer patients (n = 6) in treatment cycle 1, respectively. *** Represents p ≤ 0.001, ** represents p ≤ 0.01, and * represents p ≤ 0.05.

Similar articles

Cited by

References

    1. Ferlay J., Colombet M., Soerjomataram I., Parkin D.M., Piñeros M., Znaor A., Bray F. Cancer statistics for the year 2020: An overview. Int. J. Cancer. 2021;149:778–789. doi: 10.1002/ijc.33588. - DOI - PubMed
    1. Vaidyanathan R., Soon R.H., Zhang P., Jiang K., Lim C.T. Cancer diagnosis: From tumor to liquid biopsy and beyond. Lab Chip. 2019;19:11–34. doi: 10.1039/C8LC00684A. - DOI - PubMed
    1. Chen C.K., Liao J., Li M.S., Khoo B.L. Urine biopsy technologies: Cancer and beyond. Theranostics. 2020;10:7872. doi: 10.7150/thno.44634. - DOI - PMC - PubMed
    1. Siravegna G., Marsoni S., Siena S., Bardelli A. Integrating liquid biopsies into the management of cancer. Nat. Rev. Clin. Oncol. 2017;14:531–548. doi: 10.1038/nrclinonc.2017.14. - DOI - PubMed
    1. Allan A.L., Keeney M. Circulating tumor cell analysis: Technical and statistical considerations for application to the clinic. J. Oncol. 2010;2010:1–10. doi: 10.1155/2010/426218. - DOI - PMC - PubMed

LinkOut - more resources