. 2022 Feb 6;14(3):821.
doi: 10.3390/cancers14030821.

Targeting Mitochondrial COX-2 Enhances Chemosensitivity via Drp1-Dependent Remodeling of Mitochondrial Dynamics in Hepatocellular Carcinoma

Affiliations

Targeting Mitochondrial COX-2 Enhances Chemosensitivity via Drp1-Dependent Remodeling of Mitochondrial Dynamics in Hepatocellular Carcinoma

Lin Che et al. Cancers (Basel). .

Abstract

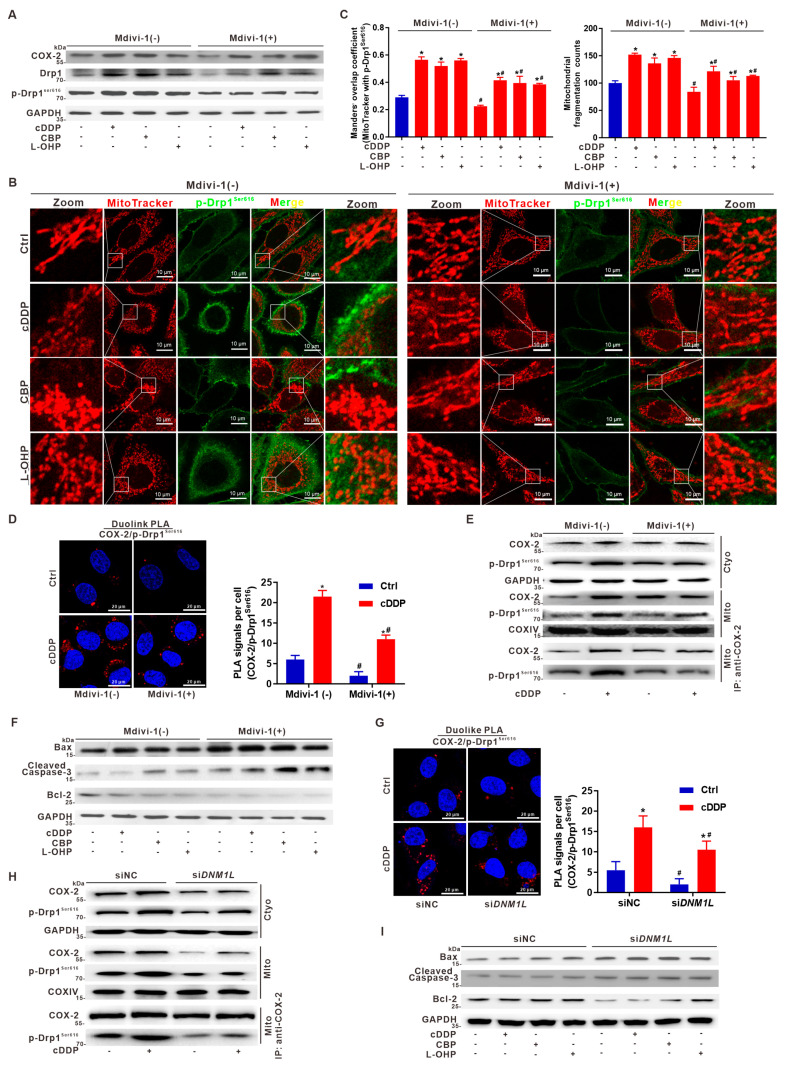
Mitochondria are highly dynamic organelles and undergo constant fission and fusion, which are both essential for the maintenance of cell physiological functions. Dysregulation of dynamin-related protein 1 (Drp1)-dependent mitochondrial dynamics is associated with tumorigenesis and the chemotherapeutic response in hepatocellular carcinoma (HCC). The enzyme cyclooxygenase-2 (COX-2) is overexpressed in most cancer types and correlates with a poor prognosis. However, the roles played by the translocation of mitochondrial COX-2 (mito-COX-2) and the interaction between mito-COX-2 and Drp1 in chemotherapeutic responses remain to be elucidated in the context of HCC. Bioinformatics analysis, paired HCC patient specimens, xenograft nude mice, immunofluorescence, transmission electron microscopy, molecular docking, CRISPR/Cas9 gene editing, proximity ligation assay, cytoplasmic and mitochondrial fractions, mitochondrial immunoprecipitation assay, and flow cytometry analysis were performed to evaluate the underlying mechanism of how mito-COX-2 and p-Drp1Ser616 interaction regulates the chemotherapeutic response via mitochondrial dynamics in vitro and in vivo. We found that COX-2 and Drp1 were frequently upregulated and confer a poor prognosis in HCC. We also found that the proportion of mito-COX-2 and p-Drp1Ser616 was increased in HCC cell lines. In vitro, we demonstrated that the enhanced mitochondrial translocation of COX-2 promotes its interaction with p-Drp1Ser616 via PTEN-induced putative kinase 1 (PINK1)-mediated Drp1 phosphorylation activation. This increase was associated with higher colony formation, cell proliferation, and mitochondrial fission. These findings were confirmed by knocking down COX-2 in HCC cells using CRISPR/Cas9 technology. Furthermore, inhibition of Drp1 using pharmacologic inhibitors (Mdivi-1) or RNA interference (siDNM1L) decreased mito-COX-2/p-Drp1Ser616 interaction-mediated mitochondrial fission, and increased apoptosis in HCC cells treated with platinum drugs. Moreover, inhibiting mito-COX-2 acetylation with the natural phytochemical resveratrol resulted in reducing cell proliferation and mitochondrial fission, occurring through upregulation of mitochondrial deacetylase sirtuin 3 (SIRT3), which, in turn, increased the chemosensitivity of HCC to platinum drugs in vitro and in vivo. Our results suggest that targeting interventions to PINK1-mediated mito-COX-2/p-Drp1Ser616-dependent mitochondrial dynamics increases the chemosensitivity of HCC and might help us to understand how to use the SIRT3-modulated mito-COX-2/p-Drp1Ser616 signaling axis to develop an effective clinical intervention in hepatocarcinogenesis.

Keywords: apoptosis; dynamin-related protein 1; hepatocellular carcinoma; mitochondrial cyclooxygenase-2; mitochondrial dynamics; sirtuin 3.


Conflict of interest statement

The authors declare no conflict of interest.

Figures

Figure 1
Figure 1
Upregulation of COX-2 and Drp1 is associated with a poorer prognosis of HCC patients. (AE) Twelve paired tumor and peritumor tissues from HCC patients were collected and analyzed. (A) Representative hematoxylins and eosin (HE) staining images of the paired peritumor (P) and tumor (T) tissues from the HCC samples of #1 and #2 (Left). Black asterisks indicate cancer nests. Scale bar, 50 μm. The number of cancer nests per field of view is quantified in the bar graph (Right). Data are shown as the mean ± SD, n = 12. ** p < 0.01 as compared to the peritumor (P) tissue group. (B) Representative IHC staining images for COX-2 and Drp1 expression in the paired peritumor (P) and tumor (T) tissues from the HCC samples of #1 and #2 (Left). Scale bar, 50 μm. The scatter plot graph for the quantitative analysis of COX-2 and Drp1 expression by IPP 6.0 is shown (Right). Data are shown as the mean ± SD, n = 12. ** p < 0.01 as compared to the peritumor (P) tissue group. (C) Serial sections of the paired peritumor (P) and tumor (T) tissues were subjected to immunofluorescence analysis to evaluate the co-expression of COX-2 (green) and Drp1 (red), and the co-localization (yellow) between COX-2 and Drp1 (Left). DAPI (Blue) was for nucleus staining. Fluorescence curves were generated using Zen 2010 software (Right). Scale bars, 10 μm. (D) Western blotting analysis for the protein levels of COX-2 and Drp1 expression in 12 pairs of peritumor (P) and tumor (T) tissues. Full Western Blot images can be found in Figures S9 and S10. (E) The scatter plot graph for the quantitative analysis of COX-2 and Drp1 expression (Left) and the trend relationship analysis of COX-2 and Drp1 expression (Middle), in the pairs of peritumor (P) and tumor (T) tissues. Correlation between the expression of COX-2 and Drp1 was calculated by Pearson’s correlation analysis (Right). Data are shown as the mean ± SD, n = 12. * p < 0.05, *** p < 0.001 as compared to the peritumor (P) tissue group. (FH) Gene expression analysis of RNA-seq dataset (accession no.: GSE104310) in tumor and normal tissues samples from HCC patients (n = 20). (F) Volcano plot of 13,548 genes in total. The DEGs with the fold change ≥1.5 or ≤−1.5, p < 0.05 are presented in the red plots (upregulated genes, n = 150) and green plots (downregulated genes, n = 358). Black plots represent the rest of the genes (n = 13,040) with no significant expression change. The upregulated PTGS2 gene is shown. (G) Heatmap for the relative expression levels of mitochondria-related DEGs. The significant increases of PTGS2 and DNM1L in HCC tumor samples are shown. * p < 0.05, compared to the normal group. (H) GSEA indicates significant correlations between PTGS2 and DNM1L genes’ expression and mitochondrial fission signatures. (I) Kaplan-Meier curve analysis of overall survival in HCC patients by the expression of PTGS2 and DNM1L using the Kaplan-Meier plotter.
Figure 2
Figure 2
Activation of Drp1 enhances mitochondrial fission and its interaction with COX-2 in HCC cells. (A) Transmission electron microscopy (TEM) photomicrographs of mitochondrial structure in L02, HepG2, and MHCC97H cells. Scale bar, 2 μm (Left), 1 μm (Middle), and 500 nm (Right). (B) Mitochondrial morphology was analyzed by confocal microscopy. (CE) The expression levels of indicated proteins in L02, HepG2, and MHCC97H cells were measured by western blot. (C) The levels of COX-2, Drp1, p-Drp1Ser616, and p-Drp1Ser637. (D) The levels of PKCα, p38 MAPK, CDK2, ERK, AKT, and PINK1. (E) Cytoplasmic (Cyto) and mitochondrial (Mito) fractions were prepared and analyzed the levels of COX-2, PINK1, Drp1, p-Drp1Ser616, and p-Drp1Ser637. (F) Schematic illustration of the primary sequence of human COX-2 and Drp1 and their predicted domains in molecular structures are displayed. Featured COX-2 conserved domains: SP, signal peptide; EGF, EGF domain; MBD, membrane-binding domain; CatD, catalytic domain; STEL, an inefficient ER retention signal. Featured Drp1 conserved domains: GTPase, G domain; MD, middle domain; VD, variable domain; GED, GTPase effector domain. (G) Protein-protein structures of the COX-2/Drp1 complex were predicted using I-TASSER. Potential binding areas are indicated by dashed boxes. (H) Mitochondrial fractions were immunoprecipitated with anti-COX-2 antibody, and the expressions of PINK1 and p-Drp1Ser616 were detected by western blot. IgG was used as the control. (I,J) HepG2-pBabe, HepG2-DNM1L, and HepG2-DNM1L(S>A) cells were constructed and treated with or without 20 μM CCCP for 4 h. (I) The levels of PINK1, Drp1, and p-Drp1Ser616 were detected by western blot. (J) Mitochondrial fractions were immunoprecipitated with anti-p-Drp1Ser616 antibody, and the levels of p-Drp1Ser616, COX-2, and PINK1 were detected by western blot. IgG was used as the control. Full Western Blot images can be found in Figures S9 and S10.
Figure 3
Figure 3
Mito-COX-2 modulates mitochondrial fission by stabilizing the activity of p-Drp1Ser616 in HCC cells. (AE) HepG2- and MHCC97H-pB-PTGS2 cells with COX-2-overexpression were established, together with HepG2- and MHCC97H-pBabe control cells. (A) Expression levels of COX-2, PINK1, and p-Drp1Ser616 proteins in cells were detected by western blot. (B) The self-renewal capacity of cells was measured by colony formation assay. Representative colony formation images (Left) and the efficiency of colony formation (Right) are shown. (C) Immunofluorescence images showing the co-localization of mitochondria (red), p-Drp1Ser616 (green), and COX-2 (blue) were captured by confocal microscopy (Left). Scale bars, 10 μm. Fluorescence curves were generated using Zen 2010 software (Middle). The mitochondrial fragmentation counts calculated by IPP 6.0 are shown in the bar graphs (Right). (D) Cytoplasmic (Cyto) and mitochondrial (Mito) fractions were prepared and subjected to western blot. (E) Representative PLA images show the interaction between COX-2 and p-Drp1Ser616 (Left). Scale bar: 20 μm. Quantification of COX-2/p-Drp1Ser616 PLA signals per cell is shown in the bar graph (Right). Data are expressed as the mean ± SD. ** p < 0.01, compared to the corresponding pBabe control cells. (FI) HepG2- and MHCC97H-MTS-PTGS2-Flag cells overexpressing mito-COX-2 were established, together with HepG2- and MHCC97H-pB-MTS-Flag control cells. (F) Construction of a pBabe-MTS-PTGS2-Flag plasmid driving the overexpression of mitochondria-targeted resident COX-2 (Upper). The mitochondrial targeting sequence (MTS) tagged to the N-terminal and a Flag tagged to the C-terminal of PTGS2. Schematic diagram detailing the mito-IP assay (Lower). (G) Mitochondrial fractions were immunoprecipitated (mito-IP) with an anti-Flag antibody, and the levels of the indicated proteins were detected to display the interaction between mito-COX-2, PINK1, and p-Drp1Ser616 in cells. IgG was used as the control. (H,I) Cell proliferation was evaluated by EdU incorporation assay (Left). Scale bar, 10 μm. Quantification of EdU-positive cells’ ratio is shown in the bar graph (Right). Data are expressed as the mean ± SD. ** p < 0.01, compared to the corresponding control cells. Full Western Blot images can be found in Figures S9 and S10.
Figure 4
Figure 4
Suppression of mito-COX-2 translocation decreases its interaction with p-Drp1Ser616 and modulates mitochondrial fission in HCC cells. (A) Schematic diagram of PTGS2-gRNAs’ design for CRISPR/Cas9-based gene editing targeted to PTGS2. (B) Construction of COX-2-knockdown lentiCRISPRv2-PTGS2 recombinant plasmid (Left), and confirmation by sequencing (Right). (CG) HepG2- and MHCC97H-Cas9-PTGS2 cells with COX-2-knockdown were established, together with HepG2- and MHCC97H-Cas9-NC control cells. (C) Expression levels of COX-2, PINK1, and p-Drp1Ser616 in total proteins of whole-cell lysates were detected by western blot. (D) Immunofluorescence images showing the co-localization of mitochondria (red), p-Drp1Ser616 (green), and COX-2 (blue) were captured by confocal microscopy (Left). Scale bars, 10 μm. Fluorescence curves were generated using Zen 2010 software (Middle). The mitochondrial fragmentation counts calculated by IPP 6.0 are shown in the bar graphs (Right). (E) Cytoplasmic (Cyto) and mitochondrial (Mito) fractions were prepared and subjected to western blot. (F) Representative PLA images showing the interaction between COX-2 and p-Drp1Ser616 (Left). Scale bar, 20 μm. Quantification of the COX-2/p-Drp1Ser616 PLA signals per cell is shown in the bar graph (Right). Data are expressed as the mean ± SD. * p < 0.05, ** p < 0.01, compared to Cas9-NC control cells. (G) Mitochondrial fractions were immunoprecipitated (mito-IP) with anti-COX-2 antibody, and the levels of proteins were detected to indicate the protein interaction between mito-COX-2, PINK1, and p-Drp1Ser616 in COX-2-knockdown HepG2- and MHCC97H-Cas9-PTGS2 cells. IgG was used as the control. (H) Schematic representation showing the impact of regulation of mito-COX-2 on the functional stability of p-Drp1Ser616-dependent mitochondrial fission in HCC cells. Full Western Blot images can be found in Figures S9 and S10.
Figure 5
Figure 5
Suppression of HCC xenograft growth via the inhibition of p-Drp1Ser616 by targeted intervention on mito-COX-2 translocation in vivo. Tumorigenicity was analyzed in BALB/c nude mice subcutaneously injected with HepG2-MTS-PTGS2-Flag or HepG2-Cas9-PTGS2 cells (1 × 10⁶/mouse). (A,B) Xenograft nude mouse model (Left), growth curves of the xenograft tumors’ volume (Middle-Left), representative images of the xenograft tumors’ size (Middle-Right), and tumor weights (Right) are shown. n = 5/group. * p < 0.05, compared to the corresponding HepG2-pB-MTS-Flag and HepG2-Cas9-NC group. (C,D) Serial sections of xenograft tumors were subjected to immunofluorescence analysis to evaluate the expression of COX-2 (green), p-Drp1Ser616 (red), and the co-localization (yellow) between COX-2 and p-Drp1Ser616 (Left). DAPI (Blue) was for nucleus staining. Fluorescence curves were generated using Zen 2010 software (Right). Scale bars, 10 μm. (E,F) Cytoplasmic (Cyto) and mitochondrial (Mito) fractions were prepared from xenografts where the tumors harbored mito-COX-2-overexpressing HepG2 cells (E) and the COX-2-knowndown HepG2 cells (F), and were subjected to western blot. Full Western Blot images can be found in Figures S9 and S10.
Figure 6
Figure 6
Targeted intervention on mito-COX-2 enhances chemosensitivity by inhibiting p-Drp1Ser616-driven mitochondrial fission in platinum drug-treated HCC cells. Three commonly used platinum chemotherapy drugs—cDDP, CBP, and L-OHP—were administered in HCC cells. (A) HepG2 and MHCC97H cells were treated with the indicated concentrations of platinum drugs for 12 h. The expression of COX-2, Drp1, and p-Drp1Ser616 was evaluated by western blot. HepG2 (B) and MHCC97H (C) cells were treated with platinum drugs (10 μM) for 12 h. Representative IF images of MitoTracker (red), COX-2 (green), and their co-localization (yellow) were produced using confocal microscopy (Upper). Scale bars, 10 μm. Manders’ overlap coefficients for co-localization of COX-2 with mitochondria and mitochondrial fragmentation counts were calculated using IPP 6.0, while their quantification is shown in the bar graphs (Lower). * p < 0.05, compared to the corresponding control groups. (D,E) MTS-directed mito-COX-2 overexpressing HepG2- and MHCC97H-MTS-PTGS2-Flag cells were treated with or without platinum drugs (10 μM) for 12 h. (D) Whole-cell lysates were subjected to western blotting to measure the levels of COX-2, PINK1, Drp1, and p-Drp1Ser616. (E) Cells were treated with or without cDDP (10 μM) for 12 h. Cells were stained with Annexin V-FITC/PI and the apoptosis rate was detected by flow cytometry. The representative analysis of apoptosis by flow cytometry is shown (Left). The quantification of apoptotic cells is shown in the bar graph (Right). * p < 0.05, compared to the corresponding control groups. (F,G) CRISPR/Cas9-based COX-2-knockdown HepG2- and MHCC97H-Cas9-PTGS2 cells were treated with or without platinum drugs (10 μM) for 12 h. (F) Whole-cell lysates were subjected to western blotting to measure the levels of COX-2, PINK1, Drp1, and p-Drp1Ser616. (G) Cells were treated with or without cDDP (10 μM) for 12 h. Cells were stained with Annexin V-FITC/PI and the apoptosis rate was detected by flow cytometry. The representative analysis of apoptosis by flow cytometry is shown (Left). The quantification of apoptotic cells is shown in the bar graph (Right). Data are expressed as the mean ± SD. ** p < 0.01, compared to the corresponding control groups. Full Western Blot images can be found in Figures S9 and S10.
Figure 7
Figure 7
Suppression of Drp1 promotes apoptosis via inhibition of mito-COX-2/p-Drp1Ser616 interaction in platinum drug-treated HCC cells. Three commonly used platinum chemotherapy drugs—cDDP, CBP, and L-OHP—were administered to HCC cells. (AF) HepG2 cells were pre-treated with or without Mdivi-1 (20 μM) for 12 h, followed by platinum drug treatment for 12 h. (A) Whole-cell lysates were subjected to western blotting to measure the indicated proteins. (B,C) Subcellular localization of p-Drp1Ser616 in cells was examined using a confocal microscope. (B) Representative images of mitochondria (red), p-Drp1Ser616 (green), and their co-localization (yellow) are shown. Scale bars, 10 μm. (C) Manders’ overlap coefficients for co-localization of p-Drp1Ser616 with mitochondria (Left) and mitochondrial fragmentation counts (Right) were calculated using IPP 6.0, while the quantification is shown in the bar graph. (D) Representative PLA images showing the interaction between COX-2 and p-Drp1Ser616 (Left). Scale bar, 20 μm. Quantification of COX-2/p-Drp1Ser616 PLA signals per cell is shown in the bar graph (Right). Data are expressed as the mean ± SD. * p < 0.05, compared to the corresponding control groups. # p < 0.05, compared to the corresponding Mdivi1(-) groups. (E) Cytoplasmic (Cyto) and mitochondrial (Mito) fractions were prepared and subjected to western blot analysis (Upper and Middle). Mitochondrial fractions were immunoprecipitated with anti-COX-2 antibody (Lower). The level and proportion of COX-2 and p-Drp1Ser616 were detected. (F) The levels of apoptosis-related proteins Bax, cleaved Caspase-3, and Bcl-2 were determined by western blotting. (GI) HepG2 cells were pre-treated with or without siDNM1L (50 nM) for 12 h, followed by cDDP treatment for 12 h. (G) Representative PLA images show the interaction between COX-2 and p-Drp1Ser616 (Left). Scale bar, 20 μm. Quantification of COX-2/p-Drp1Ser616 PLA signals per cell is shown in the bar graph (Right). Data are expressed as the mean ± SD. * p < 0.05, compared to the corresponding control groups. # p < 0.05, compared to the corresponding siNC groups. (H) Cytoplasmic (Cyto) and mitochondrial (Mito) fractions were prepared and subjected to western blotting (Upper and Middle). Mitochondrial fractions immunoprecipitated with anti-COX-2 antibody were subjected to detection of the level and proportion of COX-2 and p-Drp1Ser616 (Lower). (I) Levels of apoptosis-related proteins Bax, cleaved Caspase-3, and Bcl-2 were determined by western blotting. Full Western Blot images can be found in Figures S9 and S10.
Figure 8
Figure 8
Deacetylation of mito-COX-2 via SIRT3 activation mediates the sensitivity of HCC to cisplatin by inhibiting mito-COX-2/p-Drp1Ser616 interaction in vitro and in vivo. (AD) In our in vitro study, HepG2 and MHCC97H cells were pre-treated with or without RSV (50 μM) for 24 h, followed by cDDP treatment for 12 h. (A) Subcellular localization of COX-2 in HCC cells was examined by confocal microscopy. Representative immunofluorescence images of mitochondria (red) and COX-2 (green) were captured. Co-localization of COX-2 at mitochondria was examined. Scale bars, 10 μm. (B,C) Mitochondrial fractions were extracted to perform a mito-IP assay. Levels of SIRT3, COX-2 or ac-lysine COX-2, and p-Drp1Ser616 in mitochondrial complexes immunoprecipitated with indicated antibodies were determined. (D) The levels of apoptosis-related proteins Bax, cleaved Caspase-3, and Bcl-2 were determined by western blotting. (EH) In our in vivo study, BALB/c nude mice bearing HepG2 cells as primary xenografts were randomly assigned to four groups (n = 5 for each group) at day 10. Subcutaneous injection was conducted for treatment with normal saline (Ctrl), cDDP (1 mg/kg), RSV (50 mg/kg), or a combination of cDDP and RSV every three days, four times. (E) The overall diagram of the in vivo study design (Upper). Images show the size of xenograft tumors (Lower). (F) Cytoplasmic (Cyto) and mitochondrial (Mito) fractions were prepared from xenograft tumor tissues and subjected to western blotting. Levels of SIRT3, COX-2, and p-Drp1Ser616 proteins in representative tumor tissues are shown. (G) Serial section of xenograft tumors was subjected to immunofluorescence (IF) assay to evaluate the expression of COX-2 (green) and p-Drp1Ser616 (red), while the co-localization of COX-2 and p-Drp1Ser616 was revealed in Merge (Left). Fluorescence curves were generated using Zen 2010 software (Right). Scale bars, 10 μm. (H) Levels of apoptosis-related proteins Bax, cleaved Caspase-3, and Bcl-2 in representative xenograft tumor tissues were determined by western blotting. Full Western Blot images can be found in Figures S9 and S10.

References

    1. Llovet J.M., Castet F., Heikenwalder M., Maini M.K., Mazzaferro V., Pinato D.J., Pikarsky E., Zhu A.X., Finn R.S. Immunotherapies for hepatocellular carcinoma. Nat. Rev. Clin. Oncol. 2021 doi: 10.1038/s41571-021-00573-2. - DOI - PubMed
    1. Goh G.B., Chang P.E., Tan C.K. Changing epidemiology of hepatocellular carcinoma in Asia. Best Pract. Res. Clin. Gastroenterol. 2015;29:919–928. doi: 10.1016/j.bpg.2015.09.007. - DOI - PubMed
    1. Chu Y.J., Yang H.I., Wu H.C., Lee M.H., Liu J., Wang L.Y., Lu S.N., Jen C.L., You S.L., Santella R.M., et al. Aflatoxin B1 exposure increases the risk of hepatocellular carcinoma associated with hepatitis C virus infection or alcohol consumption. Eur. J. Cancer. 2018;94:37–46. doi: 10.1016/j.ejca.2018.02.010. - DOI - PMC - PubMed
    1. Chen J.H., Wang Y.Y., Lv W.B., Gan Y., Chang W., Tian N.N., Huang X.H., Liu L., Yu X.F., Chen S.D. Effects of interactions between environmental factors and KIF1B genetic variants on the risk of hepatocellular carcinoma in a Chinese cohort. World J. Gastroenterol. 2016;22:4183–4190. doi: 10.3748/wjg.v22.i16.4183. - DOI - PMC - PubMed
    1. Zucman-Rossi J., Villanueva A., Nault J.C., Llovet J.M. Genetic Landscape and Biomarkers of Hepatocellular Carcinoma. Gastroenterology. 2015;149:1226–1239.e4. doi: 10.1053/j.gastro.2015.05.061. - DOI - PubMed