

Functional Therapeutic Target Validation Using Pediatric Zebrafish Xenograft Models
- PMID: 35159116
- PMCID: PMC8834194
- DOI: 10.3390/cancers14030849
Functional Therapeutic Target Validation Using Pediatric Zebrafish Xenograft Models
Abstract
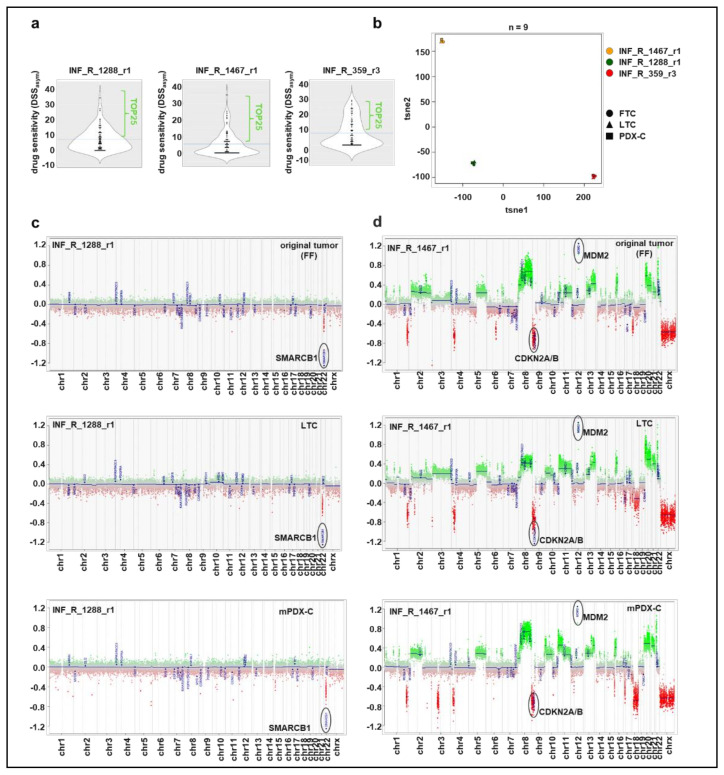
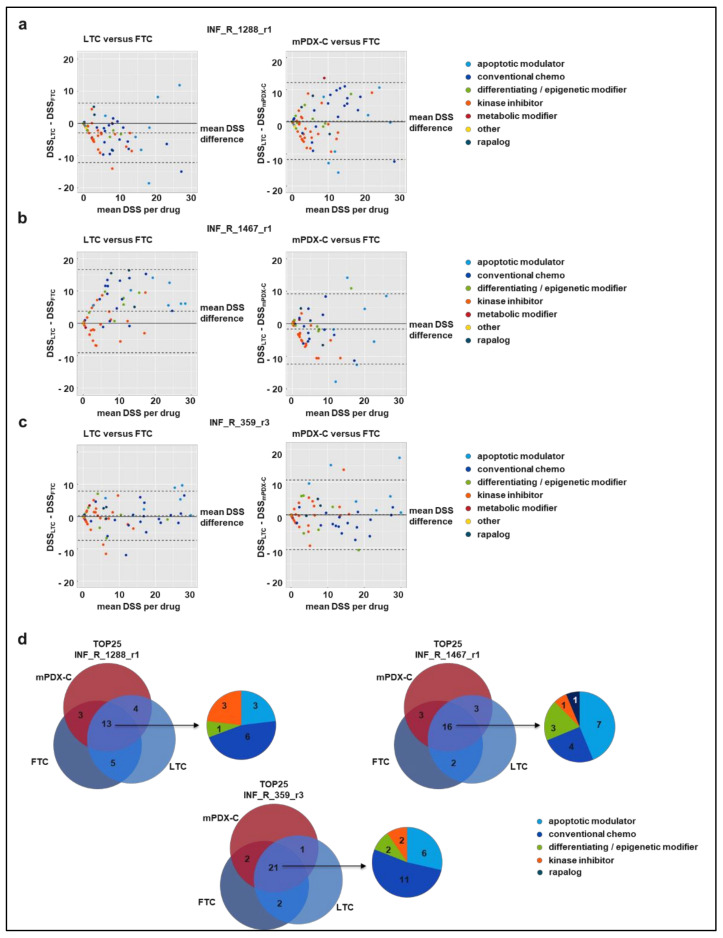
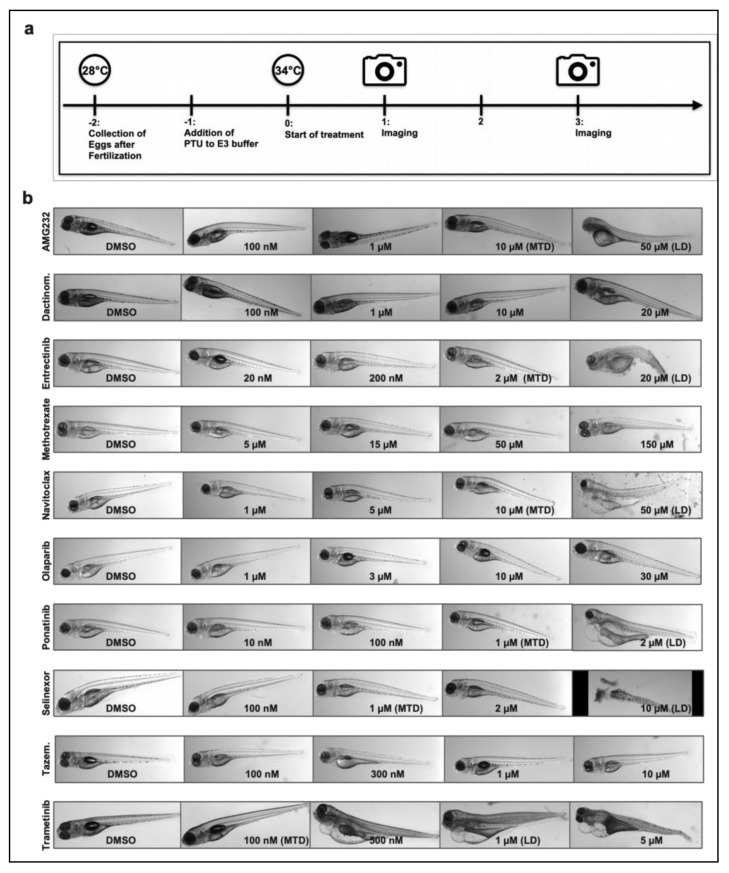
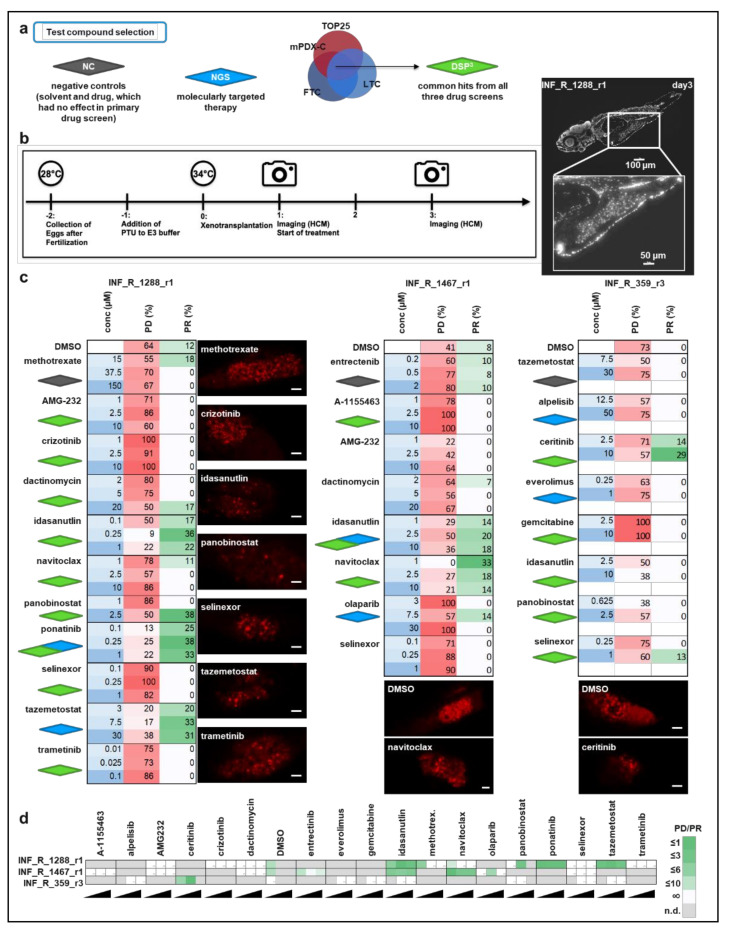
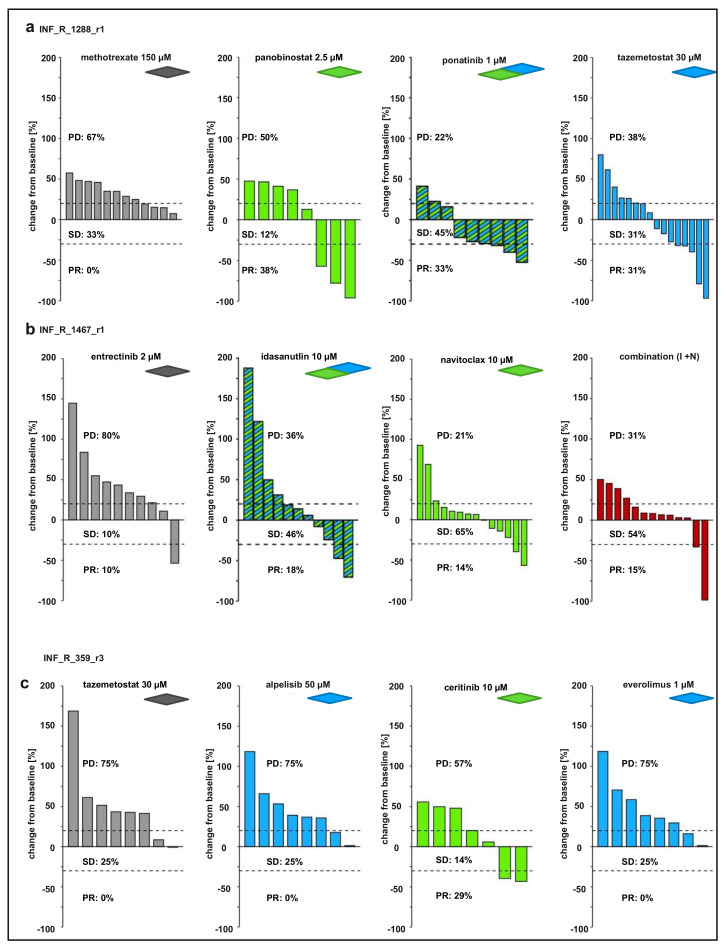
The survival rate among children with relapsed tumors remains poor, due to tumor heterogeneity, lack of directly actionable tumor drivers and multidrug resistance. Novel personalized medicine approaches tailored to each tumor are urgently needed to improve cancer treatment. Current pediatric precision oncology platforms, such as the INFORM (INdividualized Therapy FOr Relapsed Malignancies in Childhood) study, reveal that molecular profiling of tumor tissue identifies targets associated with clinical benefit in a subgroup of patients only and should be complemented with functional drug testing. In such an approach, patient-derived tumor cells are exposed to a library of approved oncological drugs in a physiological setting, e.g., in the form of animal avatars injected with patient tumor cells. We used molecularly fully characterized tumor samples from the INFORM study to compare drug screen results of individual patient-derived cell models in functional assays: (i) patient-derived spheroid cultures within a few days after tumor dissociation; (ii) tumor cells reisolated from the corresponding mouse PDX; (iii) corresponding long-term organoid-like cultures and (iv) drug evaluation with the corresponding zebrafish PDX (zPDX) model. Each model had its advantage and complemented the others for drug hit and drug combination selection. Our results provide evidence that in vivo zPDX drug screening is a promising add-on to current functional drug screening in precision medicine platforms.
Keywords: drug screen; functional precision oncology; mPDX; patient-derived spheroid culture; small molecule inhibitors; targeted therapy; zPDX.
Conflict of interest statement
The authors declare no conflict of interest.
Figures
Similar articles
-
Progress in building clinically relevant patient-derived tumor xenograft models for cancer research.Animal Model Exp Med. 2023 Oct;6(5):381-398. doi: 10.1002/ame2.12349. Epub 2023 Sep 7. Animal Model Exp Med. 2023. PMID: 37679891 Free PMC article. Review.
-
The application of zebrafish patient-derived xenograft tumor models in the development of antitumor agents.Med Res Rev. 2023 Jan;43(1):212-236. doi: 10.1002/med.21924. Epub 2022 Aug 27. Med Res Rev. 2023. PMID: 36029178 Review.
-
Zebrafish Cancer Avatars: A Translational Platform for Analyzing Tumor Heterogeneity and Predicting Patient Outcomes.Int J Mol Sci. 2023 Jan 24;24(3):2288. doi: 10.3390/ijms24032288. Int J Mol Sci. 2023. PMID: 36768609 Free PMC article. Review.
-
Zebrafish Patient-Derived Avatars from Digestive Cancers for Anti-cancer Therapy Screening.Curr Protoc. 2022 Apr;2(4):e415. doi: 10.1002/cpz1.415. Curr Protoc. 2022. PMID: 35436037
-
Single-cell functional and chemosensitive profiling of combinatorial colorectal therapy in zebrafish xenografts.Proc Natl Acad Sci U S A. 2017 Sep 26;114(39):E8234-E8243. doi: 10.1073/pnas.1618389114. Epub 2017 Aug 23. Proc Natl Acad Sci U S A. 2017. PMID: 28835536 Free PMC article.
Cited by
-
Synergy of retinoic acid and BH3 mimetics in MYC(N)-driven embryonal nervous system tumours.Br J Cancer. 2024 Sep;131(4):763-777. doi: 10.1038/s41416-024-02740-5. Epub 2024 Jun 28. Br J Cancer. 2024. PMID: 38942989 Free PMC article.
-
Zebrafish Models of Paediatric Brain Tumours.Int J Mol Sci. 2022 Aug 31;23(17):9920. doi: 10.3390/ijms23179920. Int J Mol Sci. 2022. PMID: 36077320 Free PMC article. Review.
-
A systematic review on the culture methods and applications of 3D tumoroids for cancer research and personalized medicine.Cell Oncol (Dordr). 2025 Feb;48(1):1-26. doi: 10.1007/s13402-024-00960-8. Epub 2024 May 28. Cell Oncol (Dordr). 2025. PMID: 38806997 Free PMC article.
-
Progress in building clinically relevant patient-derived tumor xenograft models for cancer research.Animal Model Exp Med. 2023 Oct;6(5):381-398. doi: 10.1002/ame2.12349. Epub 2023 Sep 7. Animal Model Exp Med. 2023. PMID: 37679891 Free PMC article. Review.
-
Optimizing preclinical pediatric low-grade glioma models for meaningful clinical translation.Neuro Oncol. 2023 Nov 2;25(11):1920-1931. doi: 10.1093/neuonc/noad125. Neuro Oncol. 2023. PMID: 37738646 Free PMC article.
References
-
- Howlader N., Noone A.M., Krapcho M., Miller D., Brest A., Yu M., Ruhl J., Tatalovich Z., Mariotto A., Lewis D.R., et al., editors. SEER Cancer Statistics Review, 1975–2018. National Cancer Institute; Bethesda, MD, USA: 2021. [(accessed on 15 April 2021)]. Available online: https://seer.cancer.gov/csr/1975_2018/
-
- Worst B.C., van Tilburg C.M., Balasubramanian G.P., Fiesel P., Witt R., Freitag A., Boudalil M., Previti C., Wolf S., Schmidt S., et al. Next-generation personalised medicine for high-risk paediatric cancer patients—The INFORM pilot study. Eur. J. Cancer. 2016;65:91–101. doi: 10.1016/j.ejca.2016.06.009. - DOI - PubMed
-
- Van Tilburg C.M., Pfaff E., Pajtler K.W., Langenberg K.P.S., Fiesel P., Jones B.C., Balasubramanian G.P., Stark S., Johann P.D., Blattner-Johnson M., et al. The pediatric precision oncology INFORM registry: Clinical outcome and benefit for patients with very high-evidence targets. Cancer Discov. 2021 doi: 10.1158/2159-8290.CD-21-0094. - DOI - PMC - PubMed
LinkOut - more resources
Full Text Sources
