. 2022 Jan 19;11(3):327.
doi: 10.3390/cells11030327.

Enhanced Loss of Retinoic Acid Network Genes in Xenopus laevis Achieves a Tighter Signal Regulation

Affiliations

Enhanced Loss of Retinoic Acid Network Genes in Xenopus laevis Achieves a Tighter Signal Regulation

Tali Abbou et al. Cells. .

Abstract

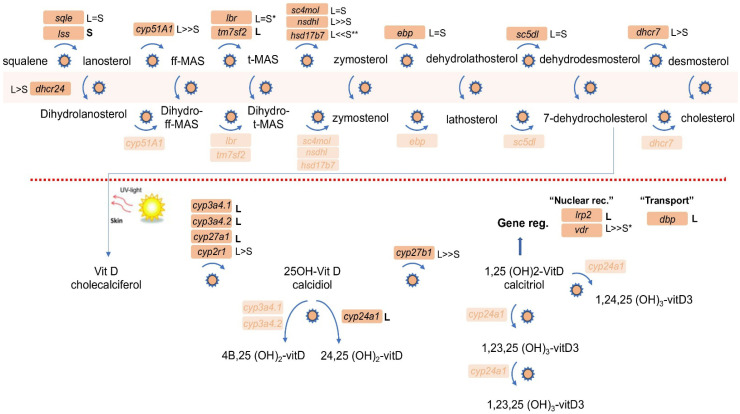
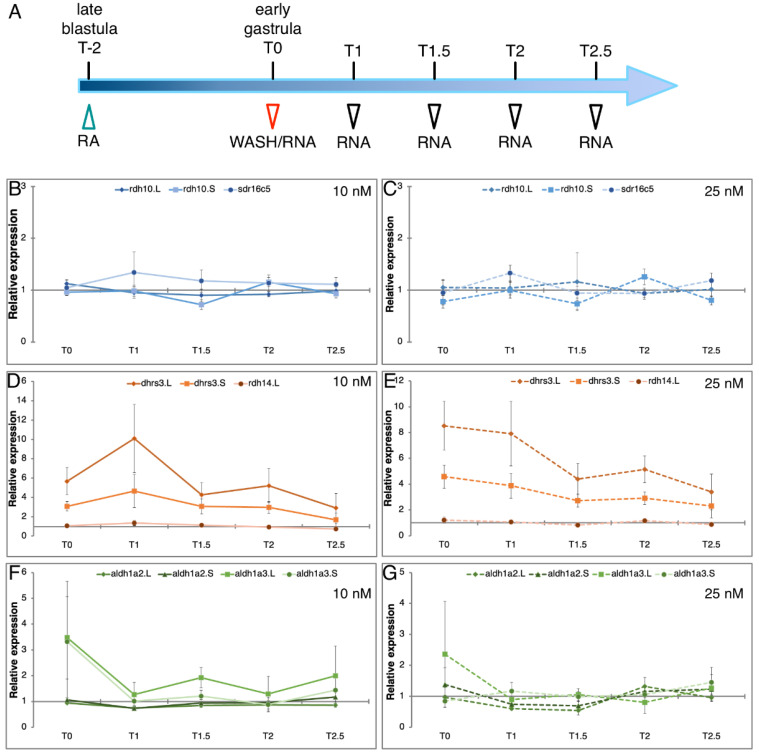
Retinoic acid (RA) is a major regulatory signal during embryogenesis produced from vitamin A (retinol) by an extensive, autoregulating metabolic and signaling network to prevent fluctuations that result in developmental malformations. Xenopus laevis is an allotetraploid hybrid frog species whose genome includes L (long) and S (short) chromosomes from the originating species. Evolutionarily, the X. laevis subgenomes have been losing either L or S homoeologs in about 43% of genes to generate singletons. In the RA network, out of the 47 genes, about 47% have lost one of the homoeologs, like the genome average. Interestingly, RA metabolism genes from storage (retinyl esters) to retinaldehyde production exhibit enhanced gene loss with 75% singletons out of 28 genes. The effect of this gene loss on RA signaling autoregulation was studied. Employing transient RA manipulations, homoeolog gene pairs were identified in which one homoeolog exhibits enhanced responses or looser regulation than the other, while in other pairs both homoeologs exhibit similar RA responses. CRISPR/Cas9 targeting of individual homoeologs to reduce their activity supports the hypothesis where the RA metabolic network gene loss results in tighter network regulation and more efficient RA robustness responses to overcome complex regulation conditions.

Keywords: Xenopus; gene duplication; gene regulation; genome evolution; homoeolog; retinoic acid; signaling robustness.


Conflict of interest statement

The authors declare no conflict of interest.

Figures

Figure 1
Figure 1
Evolutionary conservation of the RA metabolic and gene-regulatory network genes in Xenopus laevis. Composition of the RA metabolic and gene-regulatory network in the Xenopus laevis genome based on KEGG and Xenbase database analysis and literature searches [44,52]. Expression of the RA network components during gastrula stages was summarized from our own and published transcriptomic datasets. The relative expression shown (blue shades) during gastrula stages is based on Session et al. [32]. Dark blue, ≥10 TPM; middle blue, 0.5–10 TPM; light blue, ≤0.5 TPM; white, no data in the transcriptomic dataset. The homoeolog/singleton status of each gene is marked (L and/or S). The relative expression levels between homoeologs are summarized: =, similar expression levels; <, 3–6 fold difference; <<, more than 6 fold difference. Asterisks indicate whether temporal expression patterns of the homoeologs are similar (no asterisk), partially divergent (*), or highly divergent (**).
Figure 2
Figure 2
Homoeolog and singleton status of genes involved in vitamin D metabolism and signaling. KEGG analysis of the vitamin D metabolic and signaling network identified 21 genes in the X. laevis genome. The homoeolog/singleton status of each gene is marked (L and/or S). In the metabolic part of the pathway leading to cholesterol production (above the red dotted line), the pathway runs in parallel from lanosterol and dehydrolanosterol. The relative expression levels between homoeologs are summarized: =, similar expression levels; <, 3–6 fold difference; <<, more than 6 fold difference. Asterisks indicate whether temporal expression patterns of the homoeologs are similar (no asterisk), partially divergent (*), or highly divergent (**).
Figure 3
Figure 3
Genomic rearrangements involving RA network genes. Schematic examples of the types of genomic deletions and rearrangements observed in the deletion of homoeologs. The gene conserved, i.e., singleton, is marked in green. The flanking genes selected to determine the interval that was deleted are marked in red. Additional genes or putative coding sequences within the regions are marked in gray. (A) Generation of the sdr16c5.L singleton apparently involved the deletion of a small genomic region on chromosome 6S. (B) The deletion to create the rdh16.L singleton involved deleting about 100 Kb on chromosome 2S including multiple genes. (C) The genomic reorganization and deletion on chromosome 1 created the adh7.S singleton on chromosome 1S and singletons for adh1.L, adh4.L, and adh5.L on chromosome 1L.
Figure 4
Figure 4
Comparative temporal expression pattern of homoeologs and singletons. Embryos were collected at different developmental stages from blastula to mid-neurula. The temporal expression pattern of each gene was determined by qPCR. (A) Expression of the rdh10.L, rdh10.S, and sdr16c5.L genes (Producers 1). (B) Temporal expression pattern of dhrs3.L, dhrs3.S, and rdh14.L (Suppressors). (C) Expression pattern of aldh1a2.L, aldh1a2.S, aldh1a3.L, and aldh1a3.S (Producers 2).
Figure 5
Figure 5
Responsiveness of homoeologs and singletons to RA manipulations. Embryos were treated from late blastula with 10 or 25 nM RA. Samples were collected at early gastrula (st. 10.25) and analyzed by qPCR for the RA responsiveness of individual homoeologs and singletons using the primers listed in Table 1. Expression changes were normalized to transcript levels in control embryos.
Figure 6
Figure 6
Recovery of RA metabolic gene expression following transient RA manipulation. (A) Embryos were subjected to a two-hour (T-2–T0) RA treatment (10 or 25 nM) from late blastula (st. 9) to early gastrula (st. 10.25). At T0 the treatment was terminated (washed; green arrowhead) and the embryos were further incubated. Samples were collected at different times (red and black arrowheads) for expression analysis. (B,C) Kinetic analysis of rdh10.L, rdh10.S, and sdr16c5 expression changes. (D,E) qPCR analysis of the expression of dhrs3.L, dhrs3.S, and rdh14. (F,G) Analysis of the aldh1a2.L, aldh1a2.S, aldh1a3.L, and aldh1a3.S expression.
Figure 7
Figure 7
Gene expression changes in RA responsive genes as a result of homoeolog knockdown. RA network component gene specific knockdowns were induced by targeting genes with CRISPR/Cas9. The rdh10.L, rdh10.S, and sdr16c5 (A,C,E,G,I), and dhrs3.L and dhrs3.S (B,D,F,H,J) genes were targeted with specific sgRNAs. CRISPant embryos were treated with RA (10 nM) and sibling embryos were treated with RA only as controls. (A,B) Gene expression change analysis at T0 normalized to control expression. (CJ) Kinetic analysis of gene expression changes in CRISPant embryos normalized to RA-induced changes at each time point. Genes analyzed: (C,D) cyp26a1.L, (E,F) hoxd1.L/S, (G,H) hoxa1.L, (I,J) hoxa2.L/S.
Figure 8
Figure 8
Regulation tightness score of the RA-responsive genes in CRISPant embryos. To calculate the regulation tightness score (∑∆), the sum of the expression fold change was calculated for the RA-responsive genes: cyp26a1.L, hoxd1.L/S, hoxa1.L, hoxa1.S, hoxa2.L/S, hoxb4.S, hoxb1.L, and hoxb1.S. (A) Analysis in rdh10.L, rdh10.S, and sdr16c5 RA-treated CRISPants. (B) Analysis in dhrs3.L and dhrs3.S RA-treated CRISPants. *, p < 0.05; ns, not significant.

References

    1. Metzler M.A., Sandell L.L. Enzymatic metabolism of vitamin A in developing vertebrate embryos. Nutrients. 2016;8:812. doi: 10.3390/nu8120812. - DOI - PMC - PubMed
    1. le Maire A., Bourguet W. Retinoic acid receptors: Structural basis for coregulator interaction and exchange. Subcell. Biochem. 2014;70:37–54. doi: 10.1007/978-94-017-9050-5_3. - DOI - PubMed
    1. Nolte C., De Kumar B., Krumlauf R. Hox genes: Downstream “effectors” of retinoic acid signaling in vertebrate embryogenesis. Genesis. 2019;57:e23306. doi: 10.1002/dvg.23306. - DOI - PubMed
    1. Draut H., Liebenstein T., Begemann G. New Insights into the Control of Cell Fate Choices and Differentiation by Retinoic Acid in Cranial, Axial and Caudal Structures. Biomolecules. 2019;9:860. doi: 10.3390/biom9120860. - DOI - PMC - PubMed
    1. Blaner W.S. Vitamin A signaling and homeostasis in obesity, diabetes, and metabolic disorders. Pharmacol. Ther. 2019;197:153–178. doi: 10.1016/j.pharmthera.2019.01.006. - DOI - PMC - PubMed

Publication types

LinkOut - more resources