. 2022 Jan 26;11(3):425.
doi: 10.3390/cells11030425.

Epiregulin as an Alternative Ligand for Leptin Receptor Alleviates Glucose Intolerance without Change in Obesity

Affiliations

Epiregulin as an Alternative Ligand for Leptin Receptor Alleviates Glucose Intolerance without Change in Obesity

No-Joon Song et al. Cells. .

Abstract

The leptin receptor (LepR) acts as a signaling nexus for the regulation of glucose uptake and obesity, among other metabolic responses. The functional role of LepR under leptin-deficient conditions remains unclear. This study reports that epiregulin (EREG) governed glucose uptake in vitro and in vivo in Lepob mice by activating LepR under leptin-deficient conditions. Single and long-term treatment with EREG effectively rescued glucose intolerance in comparative insulin and EREG tolerance tests in Lepob mice. The immunoprecipitation study revealed binding between EREG and LepR in adipose tissue of Lepob mice. EREG/LepR regulated glucose uptake without changes in obesity in Lepob mice via mechanisms, including ERK activation and translocation of GLUT4 to the cell surface. EREG-dependent glucose uptake was abolished in Leprdb mice which supports a key role of LepR in this process. In contrast, inhibition of the canonical epidermal growth factor receptor (EGFR) pathway implicated in other EREG responses, increased glucose uptake. Our data provide a basis for understanding glycemic responses of EREG that are dependent on LepR unlike functions mediated by EGFR, including leptin secretion, thermogenesis, pain, growth, and other responses. The computational analysis identified a conserved amino acid sequence, supporting an evolutionary role of EREG as an alternative LepR ligand.

Keywords: EGFR; ERK; energy metabolism; epiregulin; glucose uptake; leptin receptor.


Conflict of interest statement

The authors declare no conflict of interest.

Figures
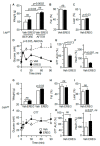
Figure 1
Figure 1
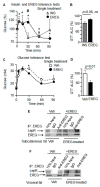
EREG improved glucose tolerance in the absence of leptin in Lepob mice and exhibited no effect in LepR-deficient Leprdb mice. (A) Body weight of Lepob male mice in groups before and after treatment with Veh (PBS, white bar) or EREG (50 ng/g body weight (BW), black bar) for 26 days. Mice were on regular chow diet. Unpaired t-test, n = 7/group. ns, not significant. (B,C) Fat (B) and lean body (C) composition in same groups of mice at the end of the study was measured by Echo-MRI. Fat and lean mass are shown as % of the total weight (100%). (D,E) Glucose tolerance test (GTT) was performed in fasted Lepob mice treated with PBS (Veh, open circles) or EREG (closed circles) (n = 7 per group). GTT kinetics (D) and area under the curve (AUC) (E) are shown. Statistical significance was examined by ANOVA (D) and Student’s t-test (E). (F) Insulin levels in plasma in both mouse groups were measured by ELISA. Unpaired student’s t-test. (G) Weight before and after treatment of Leprdb male mice with Veh (PBS, white bar) or EREG (50 ng/g body weight (BW), black bar) for 4 weeks (n = 6 per treatment). Mice were on regular chow. Unpaired Student’s t-test, n = 6/group. (H,I) Fat (H) and lean body (I) composition (% of total weight) in the same groups of mice at the end of the study were measured by Echo-MRI. (J,K) GTT kinetics (J) and AUC (K) were obtained from Leprdb mice treated with PBS (Veh, open circles) or EREG (closed circles). ANOVA (J) and Student’s t-test (K). (L) Insulin levels in plasma in both mouse groups were measured by ELISA. Unpaired student’s t-test.
Figure 2
Figure 2
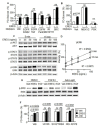
EREG regulated glucose uptake via binding with LepR in Lepob mice. (A) EREG and insulin tolerance test in Lepob mice (n = 5 per group) treated with a single intraperitoneal injection of insulin (0.012 IU/g BW, triangle dashed line) or EREG (80 ng/g BW, closed circles. Asterisks, significant (* p < 0.05) compared to glucose levels before EREG treatment. # Hashtag, significant difference in glucose levels 30 min after treatment with EREG or insulin. Unpaired Student’s t-test. (B) Area under the curve (AUC) quantification of insulin (hatched bar) and EREG (black bar) tolerance tests. Unpaired Student’s t-test, ns. (C) GTT kinetics were measured in Lepob mice (n = 5 per treatment) treated with a single injection of PBS (Veh, open circles) or EREG (closed circles). Student’s t-test. * p < 0.05 from comparison between control and EREG treated mice at each time point. (D) Area under the curve (AUC) quantification of insulin (hatched bar) and EREG (black bar) tolerance tests. Unpaired Student’s t-test. (E,F). Immunoprecipitation of LepR was performed with anti-EREG antibody using homogenates from subcutaneous fat (C) and visceral fat (D). Fat tissue was isolated from non-treated Lepob (Veh) as well as Lepob mice 15 min after injection of EREG (50 ng/mL).
Figure 3
Figure 3
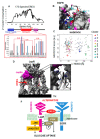
EREG-stimulated glucose uptake was dependent on LepR but independent of EGFR. (A,B) Fluorescently-labelled (FD) glucose uptake was measured in stromal vascular fraction (SVF) cells isolated from visceral tissues of Leprdb (A) or Lepob mice (B). Cells were treated with either Veh (PBS), mouse EREG (50 ng/mL), human insulin (Ins, 10 µg/mL), or mouse leptin (Lep, 200 ng/mL) for 80 min. For inhibition experiment, Lepob SVF cells were pre-treated with EGFR inhibitor (EGFR-I, AST-1306, 10 µM) or vehicle (Veh, DMSO) for 40 min. Data are shown as a percentage of Veh-treated control (100%, n = 8 per treatment). Unpaired Student’s t-test. (CE) FD-glucose uptake was measured in mouse 3T3-L3 preadipocytes. (C) Preadipocytes were treated with vehicle, human insulin (Ins, 10 µg/mL), and mouse EREG (50 ng/mL) for 30 min (mean ± SEM, n = 6, t-test). (D) Time-dependent uptake of FD-glucose in 3T3-L1 preadipocytes stimulated with human insulin (Ins, 10 µg/mL), mouse leptin (Lep, 200 ng/mL), and mouse EREG (50 ng/mL). Data are shown (mean ± SEM, n = 8, t-test) as % of glucose uptake compared to control cells at the same time point (Veh, 100%). (E) Concentration-dependent increase in FD-glucose uptake by 3T3-L1 preadipocytes stimulated with different concentrations of mouse EREG. Data are shown as a percentage of Veh-treated control (100%, n = 6 per concentration). * p < 0.05, significant differences compared to the vehicle group, one-way ANOVA). (F) NIH-3T3 preadipocytes were transiently transfected with pB-Glut4-7myc-GFP and stimulated with vehicle, Ins (10 µg/mL), EREG (50 ng/mL) for 60 min. Data show representative fluorescent images of GFP-labeled GLUT4 selected from three independent experiments. 10× magnification. Yellow arrow shows GFP-labeled GLUT4 that was translocated to the cellular membrane. (G) Quantification of GFP was performed in adipocytes of similar size (n = 10) in each group.
Figure 4
Figure 4
EREG mediates glucose uptake via PI3K with transient activation of ERK. (A) FD-glucose uptake in 3T3-L3 preadipocytes treated with or without EREG (50 ng/mL) and in the presence of inhibitors for EGFR-I (AG1478, 10 µM), EGFR and ErbB2 (AST-1306 or CI-1033 10 µM), dual IR/IGF-1R inhibitor (BMS 536924, 1 µM), and SRC-I, AZM475271, 1 µM) for 30 min. Cells were starved for 90 min before stimulation. Dashed line shows glucose uptake in the presence of insulin (Ins, 10 µg/mL). (B) FD-glucose uptake was measured in mouse 3T3-L1 preadipocytes with or without EREG (50 ng/mL) and inhibitors of MEK1/2 and PI3K (MEK1/2-I, U0126 10 μM, and PI3K-I, wortmannin 200 nM). Data (mean ± SD, n = 6) are shown as a percentage of control (Veh 100%). Unpaired Student’s t-test. (C) 3T3-L1 preadipocytes were stimulated with EREG at different concentrations (0–100 ng/mL) for 5 or 15 min. The total and phosphorylated levels of AKT, STAT3, STAT5, and ERK were measured by Western blot in duplicates. Data are shown in a representative Western blot. (D) The kinetics of pERK expression was quantified based on the Western blots. pAKT, p-STAT3, and p-STAT5 analysis are described in Figure S8. Pearson correlation analysis. (E) 3T3-L1 preadipocytes were stimulated with or without EREG or EGF (50 ng/mL, each) for 30 min in the presence and absence of EGFR inhibitor AST1306 (100 nM), and antibody against mouse LepR (Invitrogen, PA1-053, 10 μg/mL). For inhibition, cells were pre-treated 30 min before EREG and EGF stimulation. (F) FD-glucose uptake was measured in mouse 3T3-L3 preadipocytes pre-treated with either Veh (DMSO) or ERK inhibitors (U0126, SCH772984, or DEL 22379, each 10 µM in DMSO) for 40 min. Then, cells were treated with either Veh (PBS), mouse EREG (50 ng/mL), or mouse leptin (Lep, 200 ng/mL) for 80 min. Data are shown as a percentage of Veh-treated control (100%, n = 7 per group). Unpaired Student’s t-test. ns, not significant (p > 0.05).
Figure 5
Figure 5
Kinetics of the changes in LepR film thickness in the presence of leptin (A) or EREG (B). Film thickness was measured using QCM and quantified based on the binding kinetics to a gold sensor.
Figure 6
Figure 6
Evolutionary analysis of EREG binding to LepR. (AE) EREG docking to LepR. Evolutionary analysis of 175 open The dependence of EREG-mediated glucose uptake on the ERK phosphorylation cascade was examined using (1) a specific inhibitor of ERK1/2 SCH772984 [56], (2) an inhibitor of ERK dimerization DEL-22379 [57], and (3) a selective inhibitor of MEK1 and MEK2 U0126 [58]. All inhibitors increased basal glucose uptake, which was further increased by leptin (Figure 4F). The inhibition of ERK1/2 and MEK1/2 as well as ERK dimerization prevented stimulatory effect of EREG on FD-glucose uptake but did not decrease it beyond the levels seen in the control cells. Although transient ERK phosphorylation occurred in response to EREG stimulation, this pathway was dispensable for glucose uptake and dependent on PI3K and may be other pathways (Figure 4B and Figure S7B). (F) Hypothetic mechanism suggesting EREG as an alternative ligand for both EGFR and LepR. The canonic leptin/LepR response can induce JAK/STAT3 signaling and required the long form of LepR. The alternative binding of EREG to LepR can induce ERK and PI3K activation increasing GLUT4 translocation and glucose uptake, but not the other canonic effects of leptin, including the regulation of appetite and energy expenditure.

Similar articles

Cited by

References

    1. Fujikawa T., Berglund E.D., Patel V.R., Ramadori G., Vianna C.R., Vong L., Thorel F., Chera S., Herrera P.L., Lowell B.B., et al. Leptin Engages a Hypothalamic Neurocircuitry to Permit Survival in the Absence of Insulin. Cell Metab. 2013;18:431–444. doi: 10.1016/j.cmet.2013.08.004. - DOI - PMC - PubMed
    1. Friedman J.M. Leptin and the endocrine control of energy balance. Nat. Metab. 2019;1:754–764. doi: 10.1038/s42255-019-0095-y. - DOI - PubMed
    1. Myers M.G., Jr., Leibel R.L., Seeley R.J., Schwartz M.W. Obesity and leptin resistance: Distinguishing cause from effect. Trends Endocrinol. Metab. 2010;21:643–651. doi: 10.1016/j.tem.2010.08.002. - DOI - PMC - PubMed
    1. Wang B., Charukeshi Chandrasekera P., Pippin J.J. Leptin- and Leptin Receptor-Deficient Rodent Models: Relevance for Human Type 2 Diabetes. Curr. Diabetes Rev. 2014;10:131–145. doi: 10.2174/1573399810666140508121012. - DOI - PMC - PubMed
    1. Londraville R.L., Prokop J., Duff R.J., Liu Q., Tuttle M. On the Molecular Evolution of Leptin, Leptin Receptor, and Endospanin. Front. Endocrinol. 2017;8:58. doi: 10.3389/fendo.2017.00058. - DOI - PMC - PubMed

Publication types