. 2022 Jan 30;11(3):481.
doi: 10.3390/cells11030481.

Inhibition of Nigral Microglial Activation Reduces Age-Related Loss of Dopaminergic Neurons and Motor Deficits

Affiliations

Inhibition of Nigral Microglial Activation Reduces Age-Related Loss of Dopaminergic Neurons and Motor Deficits

Tzu-Feng Wang et al. Cells. .

Abstract

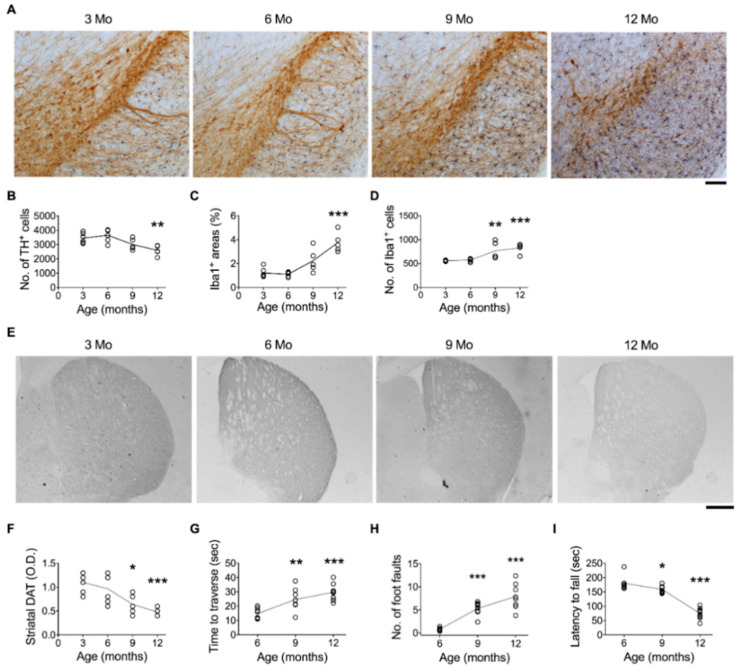
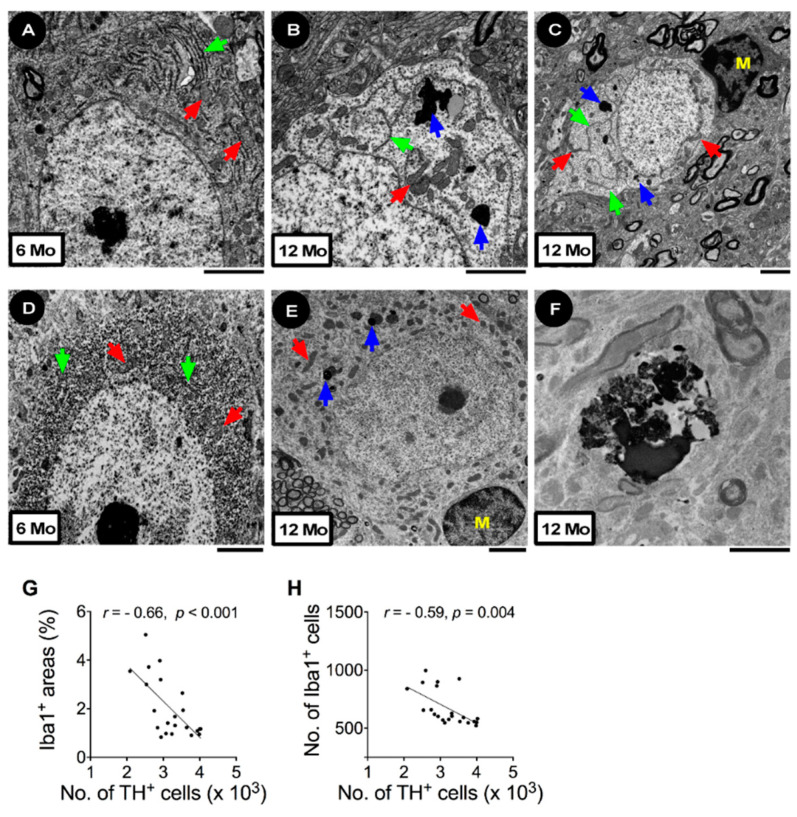
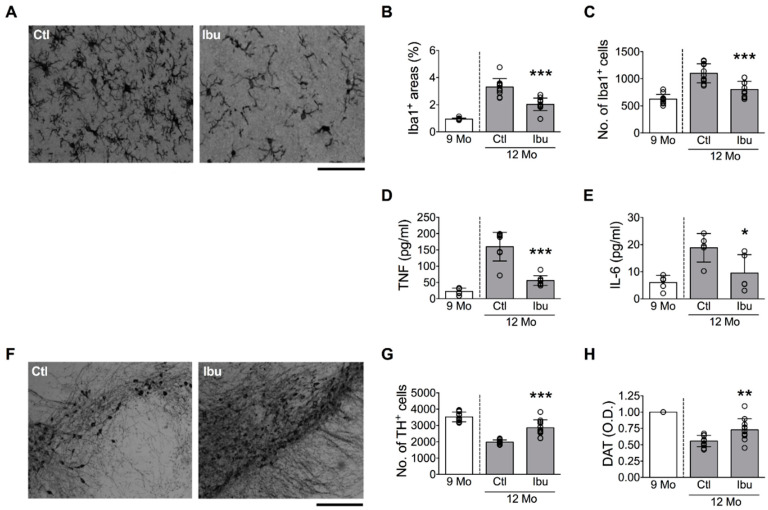
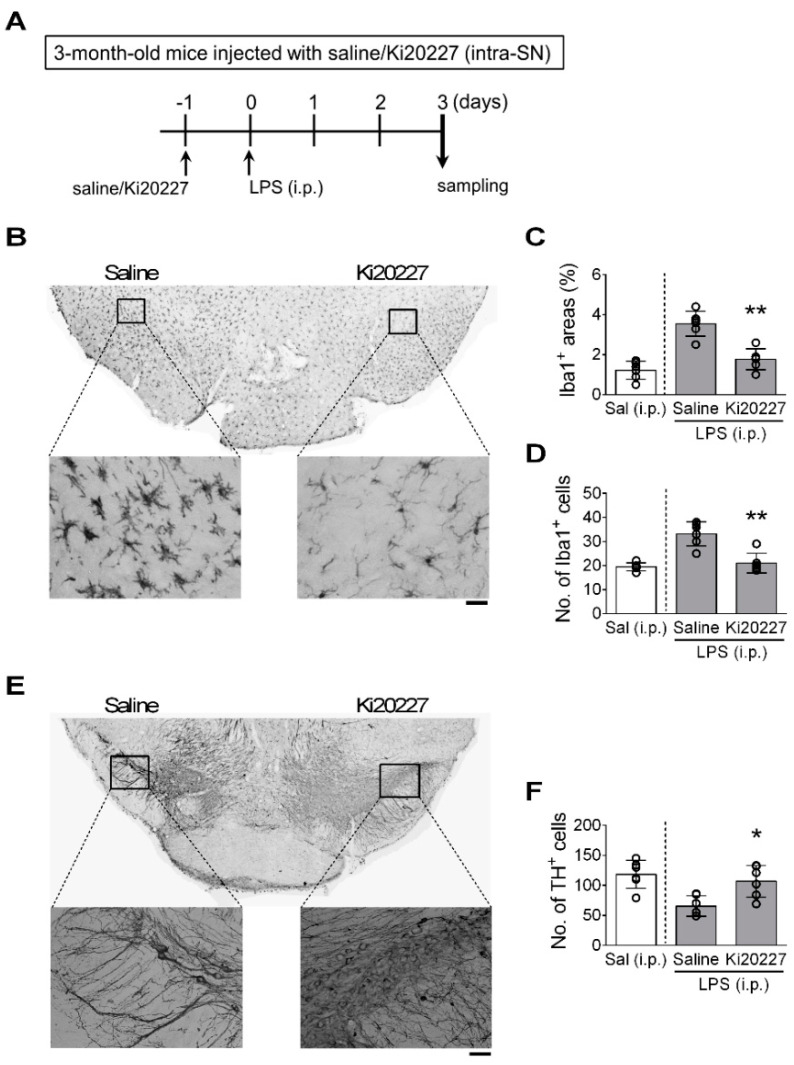
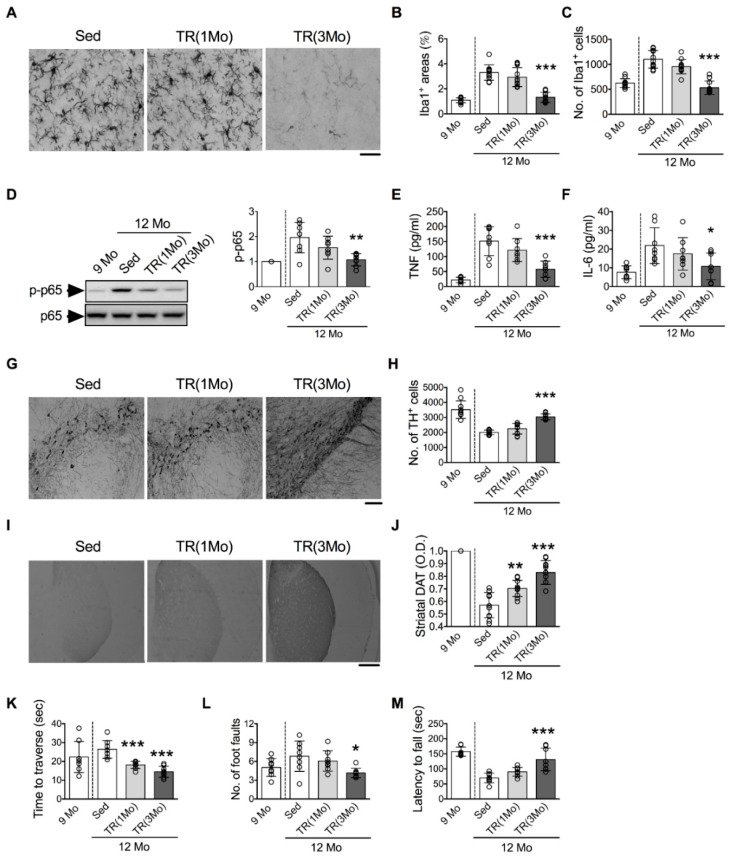
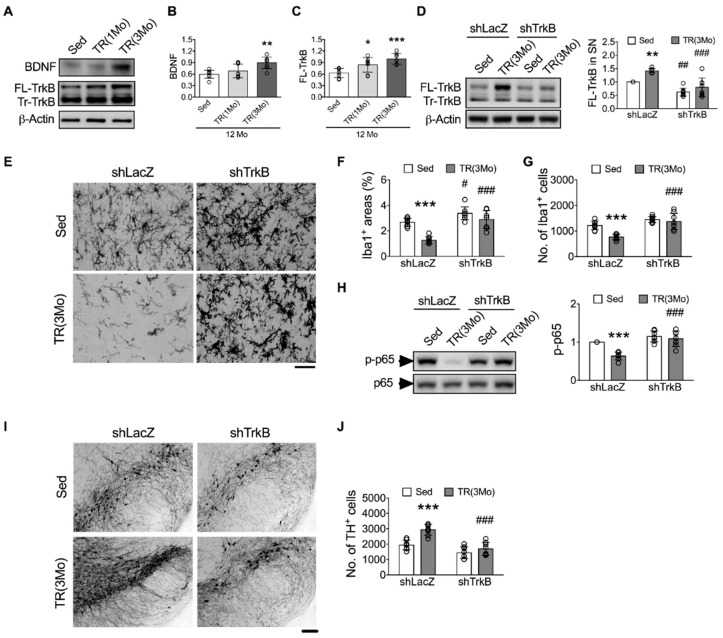
Parkinson's disease (PD) is an age-related neurodegenerative disease caused by a selective loss of dopaminergic (DA) neurons in the substantia nigra (SN). Microglial activation is implicated in the pathogenesis of PD. This study aimed to characterize the role of microglial activation in aging-related nigral DA neuron loss and motor deficits in mice. We showed that, compared to 3-month-old mice, the number of DA neurons in the SN and the expression of dopamine transporter (DAT) in the striatum decreased during the period of 9 to 12 months of age. Motor deficits and microglial activation in the SN were also evident during these months. The number of DA neurons was negatively correlated with the degrees of microglial activation. The inhibition of age-related microglial activation by ibuprofen during these 3 months decreased DA neuron loss in the SN. Eliminating the microglia prevented systemic inflammation-induced DA neuron death. Forcing mice to run during these 3 months inhibited microglial activation and DA neuron loss. Blocking the brain-derived neurotrophic factor (BDNF) signaling eliminated the exercise-induced protective effects. In conclusion, nigral DA neurons were susceptible to local microglial activation. Running exercise upregulated BDNF-TrkB signaling and inhibited microglial activation during aging. Long-term exercise can be considered as a non-pharmacological strategy to ameliorate microglial activation and related neurodegeneration.

Keywords: brain-derived neurotrophic factor; dopaminergic neurons; exercise; microglial activation.


Conflict of interest statement

The authors declare no conflict of interest.

Figures

Figure 1
Figure 1
Temporal profiles of the number of DA neurons and degrees of microglial activation in the SN, DAT+ signals in the striatum, and motor performance. (A) Representative dual immunohistochemical images of the TH+ neurons (brown) and Iba1+ (purple-blue) cells in the SNs of 3-, 6-, 9-, and 12-month-old mice. Bar = 100 μm. (B–D) Quantitative results of the number of TH+ neurons, Iba1+ areas, and numbers of Iba1+ cells. (E) Representative immunohistochemical images show DAT+ signals in the striata of 3-, 6-, 9-, and 12-month-old mice. Bar = 500 μm. (F) Quantitative results of DAT+ signals. (G) Time to traverse the beam. (H) The number of foot faults made while traversing the beam. (I) Tendency to fall off the rotarod. * p < 0.05, ** p < 0.01, *** p < 0.001 versus 3-month-old mice, one-way ANOVA, Bonferroni’s post hoc test. The numbers of mice used in the experiment are shown in Table S1. Details of statistics results are shown in Table S2.
Figure 2
Figure 2
Association between the loss of DA neurons and microglial activation in the SN during aging. Representative EM (AC) and TH+ immuno-EM (DF) images of neurons in the SN of 6- and 12-month-old mice. (A) A neuron of a 6-month-old mouse. (B) A neuron of a 12-month-old mouse. (C) A microglia-like cell next to a neuron of a 12-month-old mouse. (D) A TH+ immuno-EM micrograph shows abundant TH+ granules in the cytoplasm of a 6-month-old mouse. (E) A TH+ neuron of a 12-month-old mouse. (F) A degenerating TH+ neuron of a 12-month-old mouse. Green arrows: rough endoplasmic reticulum; red arrows: mitochondria; blue arrows: lipofuscin-like electron-dense bodies; yellow M: microglia-like cells. Bar = 2 μm. (G) Pearson correlation between Iba1+ areas and the number of TH+ neurons. (H) Pearson correlation between the number of Iba1+ cells and the number of TH+ neurons. Each dot represents one mouse. The numbers of mice used in the experiment are shown in Table S1. Details of the statistical results are shown in Table S2.
Figure 3
Figure 3
Suppression of age-related DA neuron loss in the SN by blocking microglial activation. Twelve-month-old mice were treated with (Ibu) or without (Ctl) ibuprofen for 3 months (from 9 to 12 months old). (A) Representative micrographs of Iba1+ cells in the SN. Bar = 50 μm. (B,C) Quantitative results of Iba1+ areas and numbers of Iba1+ cells. (D,E) Concentrations of TNF and IL-6 in the SN. (F) Representative micrographs of TH+ cells in the SN. Bar = 100 μm. (G) Quantitative results of TH+ cells in the SN. (H) Quantitative results of DAT+ signals in the striatum. The 9 Mo group was a reference group and was not included in the statistical analysis. * p < 0.05, ** p < 0.01, *** p < 0.001 versus Ctl group, unpaired two-tailed Student’s t-test. The numbers of mice used in the experiment are shown in Table S1. Details of statistics results are shown in Table S2.
Figure 4
Figure 4
Decreasing the number of microglia in the SN inhibited LPS-induced DA neuron loss. (A) The experimental timeline. Three-month-old mice were injected with Ki20227 into their right SN and saline into their left SN one day before LPS injection (i.p.). Mice were sacrificed three days after the LPS injection. (B) Representative micrograph of Iba1+ cells in a mouse brain. The two boxed regions are enlarged. Bar = 50 μm. (C,D) Quantitative results of Iba1+ areas and numbers of Iba1+ cells. (E) Representative micrographs of TH+ cells in a mouse brain. Bar = 100 μm. (F) Quantitative results of TH+ cells in the SN. Sal (i.p.), a group of 3-month-old mice given an intraperitoneal injection of saline but no intra-SN injection, was a reference group and was not included in the statistical analysis. * p < 0.05, ** p < 0.01 versus saline injection side, paired two-tailed Student’s t-test. The numbers of mice used in the experiment are shown in Table S1. Details of the statistical results are shown in Table S2.
Figure 5
Figure 5
TR decreased age-related microglial activation and DA neuron loss in the SN, DAT+ reduction in the striatum, and motor deficit of middle-aged mice. (A) Representative micrographs of Iba1+ cells. Bar = 50 μm. (B,C) Quantitative results of Iba1+ areas and numbers of Iba1+ cells. (D) Relative levels of p-p65. Left panels: representative Western blots; right panel: quantitative results. (E,F) Concentrations of TNF and IL-6. (G) Representative micrographs of TH+ cells. Bar = 100 μm. (H) Quantitative results of TH+ cells. (I) Representative micrographs of DAT+ signals in the striata. Bar = 500 μm. (J) Quantitative results of DAT+ signals. (KM) Performance of motor function. (K) Time to traverse the beam. (L) The number of foot faults made while traversing the beam. (M) Tendency to fall off the rotarod. The 9 Mo group was a reference group and was not included in the statistical analysis. * p < 0.05, ** p < 0.01, *** p < 0.001 versus Sed group, one-way ANOVA, Bonferroni’s post hoc test. The numbers of mice used in the experiment are shown in Table S1. Details of statistical results are shown in Table S2. Full-length blots are shown in Figure S2.
Figure 6
Figure 6
The downregulation of TrkB by shTrkB blocked the TR-induced inhibitions of age-related microglial activation and DA neuron loss in the SN. Mice were injected with shLacZ viruses into the left striata and shTrkB viruses into the right striata before and during (one injection each at 9-, 10-, and 11-month-old, respectively) the 3-month TR (TR(3Mo)). (A) Representative Western blots of BDNF and TrkB in the SN. (B,C) Quantitative results of BDNF and TrkB levels. * p < 0.05, ** p < 0.01, *** p < 0.001 versus Sed group, one-way ANOVA, Bonferroni’s post hoc test. (D) Relative levels of FL-TrkB. Left panels: representative Western blots; right panel: quantitative results. (E) Representative micrographs of Iba1+ cells in the SN. Bar = 20 μm. (F,G) Quantitative results of the areas and numbers of Iba1+ cells. (H) Relative levels of p-p65. Left panels: representative Western blots; right panel: quantitative results. (I) Representative micrographs of TH+ cells in the SN. Bar = 100 μm. (J) Quantitative results of TH+ cells. ** p < 0.01, *** p < 0.001 versus respective Sed group; # p < 0.05, ## p < 0.01, ### p < 0.001 versus respective shLacZ group, two-way ANOVA, Bonferroni’s post hoc test. The numbers of mice used in the experiment are shown in Table S1. Details of statistics results are shown in Table S2. Full-length blots are presented in Figure S2.

References

    1. Collier T.J., Kanaan N.M., Kordower J.H. Ageing as a primary risk factor for Parkinson’s disease: Evidence from studies of non-human primates. Nat. Rev. Neurosci. 2011;12:359–366. doi: 10.1038/nrn3039. - DOI - PMC - PubMed
    1. Block M.L., Hong J.S. Microglia and inflammation-mediated neurodegeneration: Multiple triggers with a common mechanism. Prog. Neurobiol. 2005;76:77–98. doi: 10.1016/j.pneurobio.2005.06.004. - DOI - PubMed
    1. Block M.L., Zecca L., Hong J.S. Microglia-mediated neurotoxicity: Uncovering the molecular mechanisms. Nat. Rev. Neurosci. 2007;8:57–69. doi: 10.1038/nrn2038. - DOI - PubMed
    1. Hirsch E.C., Hunot S. Neuroinflammation in Parkinson’s disease: A target for neuroprotection? Lancet Neurol. 2009;8:382–397. doi: 10.1016/S1474-4422(09)70062-6. - DOI - PubMed
    1. Ouchi Y., Yoshikawa E., Sekine Y., Futatsubashi M., Kanno T., Ogusu T., Torizuka T. Microglial activation and dopamine terminal loss in early Parkinson’s disease. Ann. Neurol. 2005;57:168–175. doi: 10.1002/ana.20338. - DOI - PubMed

Publication types

MeSH terms

Substances