. 2022 Jan 31;11(3):494.
doi: 10.3390/cells11030494.

GPR183 Is Dispensable for B1 Cell Accumulation and Function, but Affects B2 Cell Abundance, in the Omentum and Peritoneal Cavity

Affiliations

GPR183 Is Dispensable for B1 Cell Accumulation and Function, but Affects B2 Cell Abundance, in the Omentum and Peritoneal Cavity

Line Barington et al. Cells. .

Abstract

B1 cells constitute a specialized subset of B cells, best characterized in mice, which is abundant in body cavities, including the peritoneal cavity. Through natural and antigen-induced antibody production, B1 cells participate in the early defense against bacteria. The G protein-coupled receptor 183 (GPR183), also known as Epstein-Barr virus-induced gene 2 (EBI2), is an oxysterol-activated chemotactic receptor that regulates migration of B cells. We investigated the role of GPR183 in B1 cells in the peritoneal cavity and omentum. B1 cells expressed GPR183 at the mRNA level and migrated towards the GPR183 ligand 7α,25-dihydroxycholesterol (7α,25-OHC). GPR183 knock-out (KO) mice had smaller omenta, but with normal numbers of B1 cells, whereas they had fewer B2 cells in the omentum and peritoneal cavity than wildtype (WT) mice. GPR183 was not responsible for B1 cell accumulation in the omentum in response to i.p. lipopolysaccharide (LPS)-injection, in spite of a massive increase in 7α,25-OHC levels. Lack of GPR183 also did not affect B1a- or B1b cell-specific antibody responses after vaccination. In conclusion, we found that GPR183 is non-essential for the accumulation and function of B1 cells in the omentum and peritoneal cavity, but that it influences the abundance of B2 cells in these compartments.

Keywords: 7TM receptor; B-1 cell; B1 cell; EBI2; GPCR; GPR183; oxysterol.


Conflict of interest statement

The authors declare no conflict of interest. The funders had no role in the design of the study; in the collection, analyses, or interpretation of data; in the writing of the manuscript, or in the decision to publish the results.

Figures

Figure 1
Figure 1
GPR183 expression in and 7α,25-OHC-directed migration of peritoneal cavity B cell subsets; (A) gating scheme used to sort peritoneal cavity cells into B1a (B220low/÷CD5+), B1b (B220 low/÷CD5÷), and B2 (B220+CD5÷) cell subsets. Cells were gated on lymphocytes; (B) qPCR analysis of GPR183 mRNA levels relative to the control gene YWHAZ in the indicated B cell subsets sorted from peritoneal cavity cells by FACS, as shown in (A). Error bars represent mean ± SEM of data from 5 15–16 weeks old WT mice; (C) quantification of cells that migrated in vitro in response to varying concentrations of 7α,25-OHC, as indicated. Identification and quantification of the cells was performed after migration by flow cytometry. Cell counts were normalized to the average highest and lowest values in each dataset; (D) frequencies of B1 cells before migration and after migration in response to 10−7 M 7α,25-OHC or 10−7 M CXCL13. Error bars in (C,D) represent mean ± SEM of data from 10–12 WT mice at 15–16 weeks of age. ** p < 0.01 and *** p < 0.001 by one-way ANOVA.
Figure 2
Figure 2
Numbers of B cells in different body compartments of GPR183 KO mice. Numbers or frequencies of cells of the indicated B cell subsets, as determined by flow cytometry. Quantification of cells from; (A) spleen; (B) blood; (C) peritoneal cavity; and (D) omentum from 9–19 GPR183 KO and WT mice, which were 11–37 weeks of age. In (C) and (D), data were pooled from four independent experiments. Error bars represent mean ± SEM. * p < 0.05 and ** p < 0.01 by unpaired Student’s t-test.
Figure 3
Figure 3
Effects of lack of GPR183 expression or GPR183 signaling on peritoneal cavity B cell frequencies, proliferation, apoptosis, and function; (A) and (B) mice were given the GPR183 antagonist NIBR189, or vehicle alone, by gavage twice daily for one week. After one week, their peritoneal cavity cells were analyzed by flow cytometry; (A) percentages of the indicated B cell subsets in the peritoneal cavity of antagonist-treated WT mice and vehicle-treated WT and GPR183 KO mice; (B) percentages of cells of the indicated B cell subsets which are positive for the Ki-67 proliferation marker in antagonist- and vehicle-treated WT mice and vehicle-treated GPR183 KO mice. Error bars represent mean ± SEM of data from 4–5 mice of 17–39 weeks of age. * p < 0.05 by one-way ANOVA; (C) percentages of alive cells in B cell subsets from the peritoneal cavity of GPR183 KO and WT mice as determined by flow cytometry (living cells do not stain with Annexin V or PI). Error bars represent mean ± SEM of data from 8–9 mice of 11–15 weeks of age. * p < 0.05 by one-tailed unpaired t-test with Welch’s correction; (D) mice were vaccinated with 109 Ad5-VSV virus particles i.p., and 14 days later serum samples were taken and analyzed for Ad5-specific IgG by ELISA. Error bars represent mean ± SEM of data from 4 mice, aged 21–22 weeks. Pos = positive control serum sample known to have anti-Ad5 IgG antibodies. Neg = negative control serum sample from mouse vaccinated with unrelated antigen.
Figure 4
Figure 4
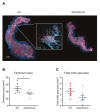
Omentum and milky spots in GPR183 KO mice; (A) whole omenta from WT (left) and GPR183 KO (right) mice stained with an anti-B220 antibody (red) and a Hoechst nuclear stain (blue) and imaged by fluorescence confocal microscopy. The insert shows a magnification of a single milky spot; (B) quantification of the total surface area of omenta from 7 10–14 weeks old WT and GPR183 KO mice; (C) quantification of the total area per omentum that constitutes milky spots, in the same omenta as in (B). The data were pooled from two independent experiments. Error bars represent mean ± SEM. * p < 0.05 by unpaired Student’s t-test.
Figure 5
Figure 5
Effects of intra-peritoneal (i.p.) LPS injection on oxysterol levels, and on B cell migration in GPR183 KO mice; (A) and (B) mice were i.p.-injected with 10 µg LPS in PBS or PBS alone, and tissues were analyzed after 6 h. The graphs show normalized amounts of the oxysterol 7α,25-OHC in total peritoneal lavage (A) and omentum (B) from 2–8 15 weeks old WT mice, as measured by mass spectrometry. There were 8 mice per group, but in some samples from the PBS-treated group, the amounts were below the detection limit, and these samples were left out. Error bars represent mean ± SEM. ** p < 0.01 and *** p < 0.001 by unpaired Student’s t-test; (C) GPR183 KO and WT mice were i.p.-injected with 10 µg LPS in PBS or PBS alone. The graph shows the total number of cells of the indicated B cell subsets in the omentum after 18 h, as determined by flow cytometry. Error bars represent mean ± SEM of data from 17–20 mice of 9–18 weeks of age. The data were pooled from two independent experiments. * p < 0.05 by one-way ANOVA.
Figure 6
Figure 6
Effects of indomethacin treatment on B cell accumulation in the peritoneal cavity of GPR183 KO mice. GPR183 KO and WT mice were given 10 mg/kg/day indomethacin in their drinking water for 7 days. The experiment was terminated on day 8 and different tissues were analyzed; (A) mouse weights during the course of the experiment, where day 1 is the first day of indomethacin treatment and day 8 is the day the experiment was terminated. One GPR183 KO mouse became too ill and was euthanized after day 4 and data for this mouse is included up until and including day 4; (B) spleen weights on day 8; (C) quantification of cells from different B cell subsets in the peritoneal cavity, as determined by flow cytometry. Error bars represent mean ± SEM of data from 5–6 mice, aged 28–53 weeks. ** p < 0.01 by unpaired Student’s t-test.
Figure 7
Figure 7
B1 cell antibody responses in GPR183 KO mice; (A) GPR183 KO and WT mice were vaccinated i.p. with 107 inactivated S. pneumoniae bacteria. Serum phosphorylcholine (PC)-specific IgM levels were determined before and 5 days after the vaccination by ELISA; (B) GPR183 KO and WT mice were vaccinated i.p. with 100 µg NP-Ficoll. Serum anti-NP IgM levels were determined before and 7 days after the vaccination by ELISA. Error bars represent mean ± SEM of data from 5–8 mice, aged 13–20 weeks.

References

    1. Hayakawa K., Hardy R.R., Parks D.R., Herzenberg L.A. The “Ly-1 B” cell subpopulation in normal immunodefective, and autoimmune mice. J. Exp. Med. 1983;157:202–218. doi: 10.1084/jem.157.1.202. - DOI - PMC - PubMed
    1. Baumgarth N. A Hard(y) Look at B-1 Cell Development and Function. J. Immunol. 2017;199:3387–3394. doi: 10.4049/jimmunol.1700943. - DOI - PMC - PubMed
    1. Hayakawa K., Hardy R.R., Herzenberg L.A. Peritoneal Ly-1 B cells: Genetic control, autoantibody production, increased lambda light chain expression. Eur. J. Immunol. 1986;16:450–456. doi: 10.1002/eji.1830160423. - DOI - PubMed
    1. Griffin D.O., Holodick N.E., Rothstein T.L. Human B1 cells in umbilical cord and adult peripheral blood express the novel phenotype CD20+ CD27+ CD43+ CD70. J. Exp. Med. 2011;208:67–80. doi: 10.1084/jem.20101499. - DOI - PMC - PubMed
    1. Rothstein T.L., Quach T.D. The human counterpart of mouse B-1 cells. Ann. N. Y. Acad. Sci. 2015;1362:143–152. doi: 10.1111/nyas.12790. - DOI - PubMed

Publication types

Substances

LinkOut - more resources