. 2022 Feb 4;11(3):547.
doi: 10.3390/cells11030547.

Cell Wall Properties Determine Genotype-Specific Response to Cold in Miscanthus × giganteus Plants

Affiliations

Cell Wall Properties Determine Genotype-Specific Response to Cold in Miscanthus × giganteus Plants

Anna Bilska-Kos et al. Cells. .

Abstract

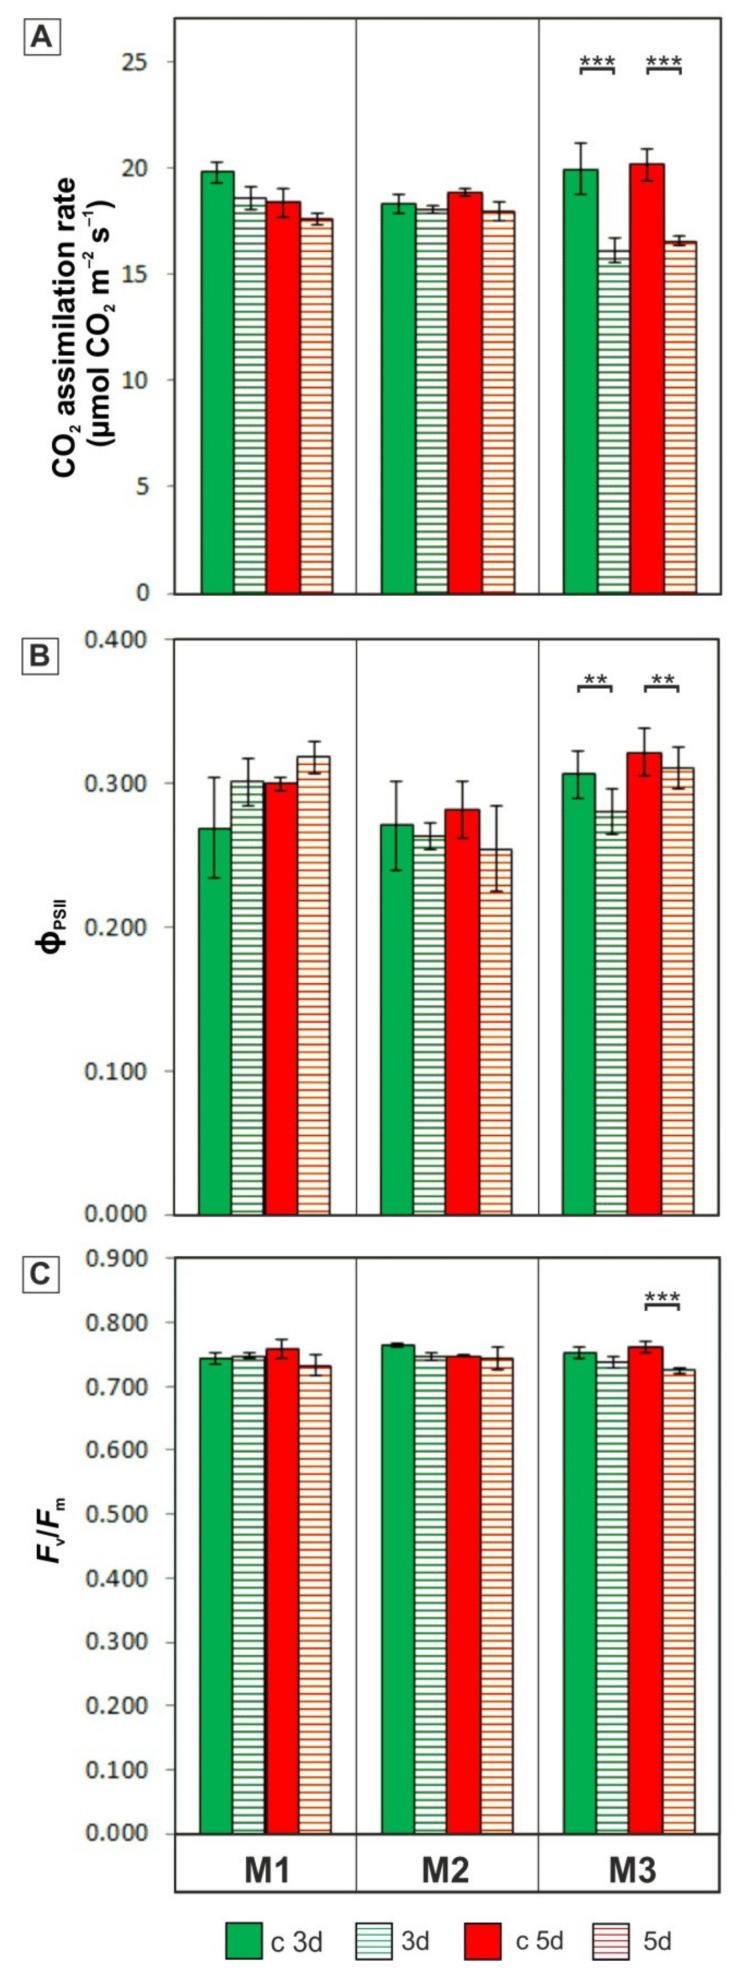
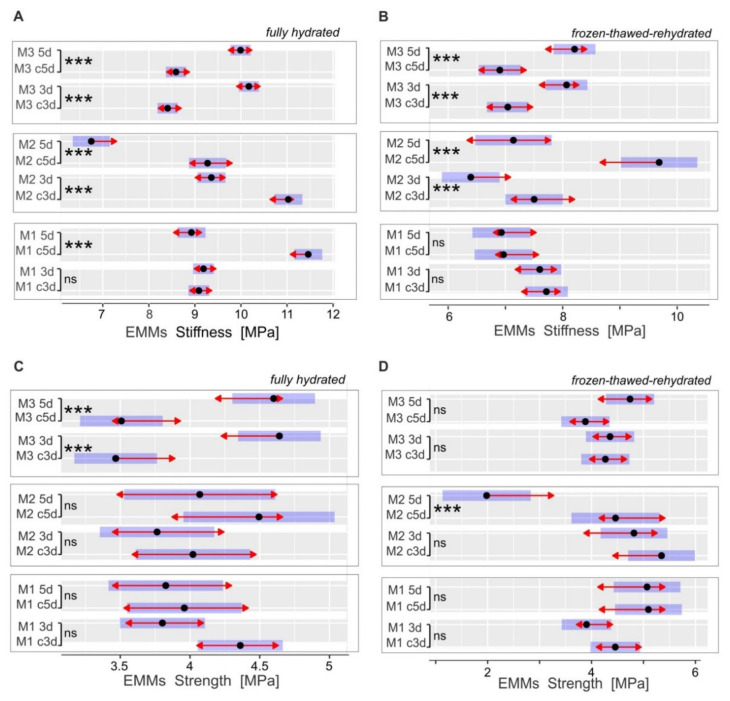
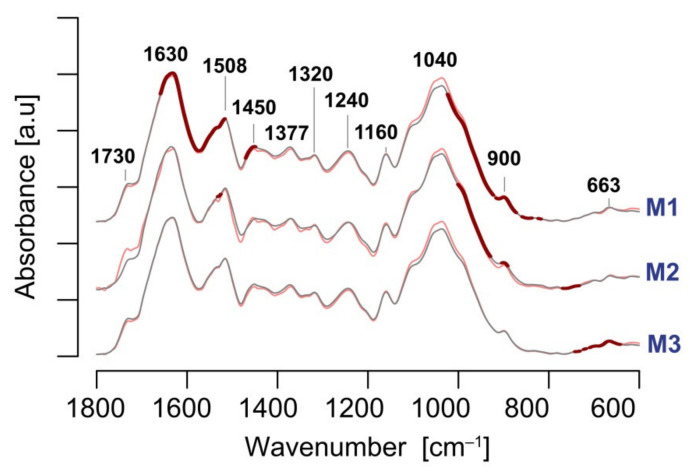
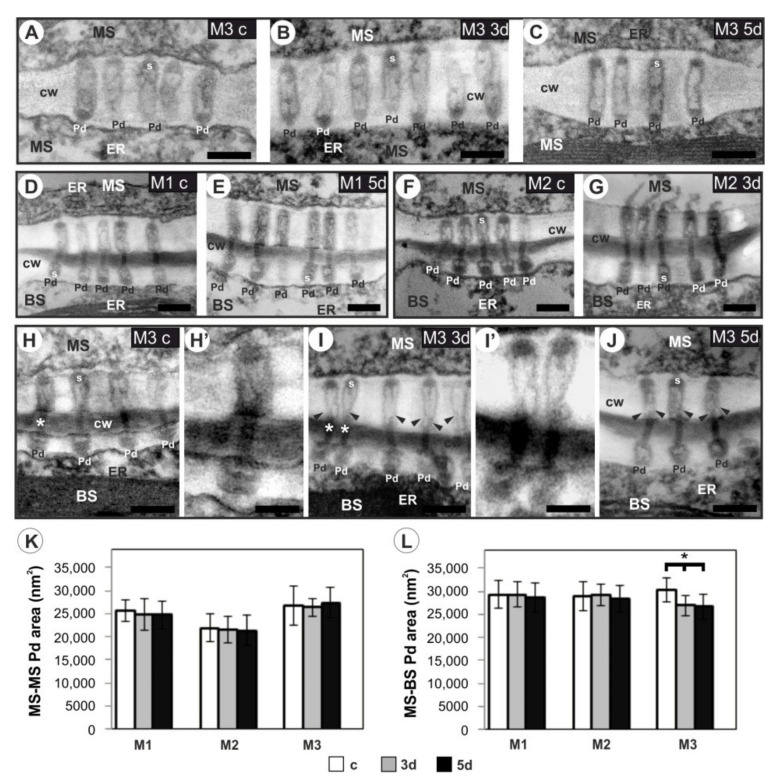
The cell wall plays a crucial role in plant growth and development, including in response to environmental factors, mainly through significant biochemical and biomechanical plasticity. The involvement of the cell wall in C4 plants' response to cold is, however, still poorly understood. Miscanthus × giganteus, a perennial grass, is generally considered cold tolerant and, in contrast to other thermophilic species such as maize or sorgo, can maintain a relatively high level of photosynthesis efficiency at low ambient temperatures. This unusual response to chilling among C4 plants makes Miscanthus an interesting study object in cold acclimation mechanism research. Using the results obtained from employing a diverse range of techniques, including analysis of plasmodesmata ultrastructure by means of transmission electron microscopy (TEM), infrared spectroscopy (FTIR), and biomechanical tests coupled with photosynthetic parameters measurements, we present evidence for the implication of the cell wall in genotype-specific responses to cold in this species. The observed reduction in the assimilation rate and disturbance of chlorophyll fluorescence parameters in the susceptible M3 genotype under cold conditions were associated with changes in the ultrastructure of the plasmodesmata, i.e., a constriction of the cytoplasmic sleeve in the central region of the microchannel at the mesophyll-bundle sheath interface. Moreover, this cold susceptible genotype was characterized by enhanced tensile stiffness, strength of leaf wall material, and a less altered biochemical profile of the cell wall, revealed by FTIR spectroscopy, compared to cold tolerant genotypes. These changes indicate that a decline in photosynthetic activity may result from a decrease in leaf CO2 conductance due to the formation of more compact and thicker cell walls and that an enhanced tolerance to cold requires biochemical wall remodelling. Thus, the well-established trade-off between photosynthetic capacity and leaf biomechanics found across multiple species in ecological research may also be a relevant factor in Miscanthus' tolerance to cold. In this paper, we demonstrate that M. giganteus genotypes showing a high degree of genetic similarity may respond differently to cold stress if exposed at earlier growing seasons to various temperature regimes, which has implications for the cell wall modifications patterns.

Keywords: C4 plants; FTIR spectroscopy; Miscanthus × giganteus; biomechanical tests; cell wall; cold tolerance; photosynthetic activity; plasmodesmata.


Conflict of interest statement

The authors declare no conflict of interest.

Figures

Figure 1
Figure 1
Monthly minimum and maximum temperatures for three localizations of M. giganteus plantations: Bydgoszcz (53°17′ N, 18°04′ E), Radzików (52°21′ N, 20°64′ E), and Majdan Sieniawski (50°29′ N, 22°72′ E), from which rhizomes were collected. Note the higher temperature values recorded in the location of Majdan Sieniawski (plantation with the M3 genotype rhizomes source) in contrast to the other two locations: Bydgoszcz (M1 genotype) and Radzików (M2 genotype), where relatively low values of monthly minimum temperatures were recorded. The data were obtained from meteorological stations owned by PBAI—NRI (Bydgoszcz, Radzików) and by IMWM—NRI (Majdan S.).
Figure 2
Figure 2
Electrophoresis banding patterns of PCR amplification products using ISSR primers 9 and 13 for five tested Miscanthus genotypes. Lane abbreviations: M, 100 bp DNA ladder (MBI Fermentas, Waltham, MA USA); M1, M. giganteus “Bydgoszcz”; M2, M. giganteus “Radzików”; M3, M. giganteus “Majdan Sieniawski”; M4, M. sacchariflorus; and M5, M. sinensis.
Figure 3
Figure 3
Genetic similarity between five genotypes of Miscanthus: M1, M. giganteus “Bydgoszcz”; M2, M. giganteus “Radzików”; M3, M. giganteus “Majdan Sieniawski”; M4, M. sacchariflorus; and M5, M. sinensis. The plot was constructed on the basis of ISSR data using the R package distantia package [59] and the Jaccard similarity index [54].
Figure 4
Figure 4
Net CO2 assimilation (A), the quantum yield of photosystem II, ϕPSII (B), and maximal photochemical efficiency of photosystem II; Fv/Fm (C) in the control (c 3d and c 5d) and chilled for 3 and 5 days (3d and 5d) for plants of three M. giganteus genotypes (M1, M2, and M3). Bars represent means ± SD; asterisks indicate a significant effect of chilling based on the planned contrasts for EMMs derived from a three-way ANOVA model. The “holm” adjustment was applied to control the multiple comparison. ** p ≤ 0.01, *** p ≤ 0.001. Data were collected from at least 10 plants in each of the three independent experiments.
Figure 5
Figure 5
Tensile mechanical parameters of leaves for control (c3d and c5d) and cold-treated (3d and 5d) plants of three Miscanthus genotypes (M1, M2, M3). Stiffness (A,B) and strength (C,D) were determined for fully hydrated (A,C) and frozen–thawed–rehydrated (B,D) samples (n = 18–24). The estimated marginal means EMMs (black dots) were derived using a three-way ANOVA model. Horizontal blue bars show 95% confidence in the means. The comparison arrows (red) are added to visualize the homogeneity of groups in the planned contrast test (the overlap of the lines indicates a lack of significant difference). The “holm” adjustment was applied to control the comparison multiplicity. *** p ≤ 0.001, ns—p > 0.05.
Figure 6
Figure 6
Mean infrared spectra of leaf cell wall material collected from the control (grey) and chilled (red) plants for three M. giganteus genotypes: M1 (“Bydgoszcz”), M2 (“Radzików”), and M3 (“Majdan Sieniawski”). Spectral regions indicating significant differences between the means (control vs. chilled plants) are depicted by thick red lines. The significance (p < 0.05) of the treatment was estimated using the planned contrasts after the three-way ANOVA and were calculated for each wavenumber within the 1800–600 cm−1 region (n = 8–10). The “holm” correction was used for the multiplicity adjustment.
Figure 7
Figure 7
Examples of typical electron microscope images of plasmodesmata (AJ) and the results of the plasmodesmata area analysis (K,L) at the interface of mesophyll–mesophyll, MS–MS (AC, K) and mesophyll–bundle sheath cells, MS–BS (DJ,L). The control, c (non-chilled) plants (A,D,F,H,H’), chilled plants for 3 days, 3d (B,G,I,I’) and for 5 days, 5d (C,E,J). Note electron-dense elements of the sphincters (s) in the neck regions on both sides of the plasmodesmata. Arrowheads indicate the clear constriction of the cytoplasmic sleeve in the central region of the MS–BS plasmodesmata in the leaves of the M3 genotype (I,J). Plasmodesmata marked with asterisks (H,I) are at higher magnification (H’,I’) for better visualization of the ultrastructure. Abbreviations: M1, M. giganteus “Bydgoszcz”; M2, M. giganteus “Radzików”; M3, M. giganteus “Majdan Sieniawski”; Pd, plasmodesmata; CW, cell wall; ER, endoplasmic reticulum; s, sphincter; Scale bar = 200 nm (AJ); = 100 nm (H’,I’). The Pd area (K,L) was measured from thirty individual Pd at the MS–MS or MS–BS interface for at least six plants and three independent experiments. Bars represent the means ± SD. *—significant effect of chilling (Tukey’s HSD test, p < 0.001).

References

    1. Anderson C.T., Kieber J.J. Dynamic Construction, Perception, and Remodeling of Plant Cell Walls. Annu. Rev. Plant Biol. 2020;71:39–69. doi: 10.1146/annurev-arplant-081519-035846. - DOI - PubMed
    1. Cosgrove D.J. Plant cell wall extensibility: Connecting plant cell growth with cell wall structure, mechanics, and the action of wall-modifying enzymes. J. Exp. Bot. 2015;67:463–476. doi: 10.1093/jxb/erv511. - DOI - PubMed
    1. Gall H.L., Philippe F., Domon J.-M., Gillet F., Pelloux J., Rayon C. Cell wall metabolism in response to abiotic stress. Plants. 2015;4:112–166. doi: 10.3390/plants4010112. - DOI - PMC - PubMed
    1. Houston K., Tucker M.R., Chowdhury J., Shirley N., Little A. The Plant Cell Wall: A Complex and Dynamic Structure As Revealed by the Responses of Genes under Stress Conditions. Front. Plant Sci. 2016;7:984. doi: 10.3389/fpls.2016.00984. - DOI - PMC - PubMed
    1. Zhang B., Gao Y., Zhang L., Zhou Y. The plant cell wall: Biosynthesis, construction, and functions. J. Integr. Plant Biol. 2021;63:251–272. doi: 10.1111/jipb.13055. - DOI - PubMed

Publication types

LinkOut - more resources