

Reduced Vessel Density in the Mid-Periphery and Peripapillary Area of the Superficial Capillary Plexus in Non-Proliferative Diabetic Retinopathy
- PMID: 35159984
- PMCID: PMC8836591
- DOI: 10.3390/jcm11030532
Reduced Vessel Density in the Mid-Periphery and Peripapillary Area of the Superficial Capillary Plexus in Non-Proliferative Diabetic Retinopathy
Abstract
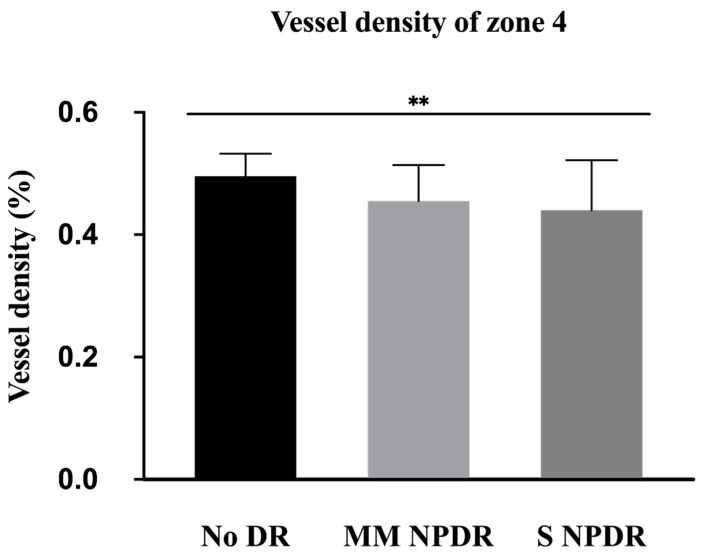
Our aim in this study was to assess the vessel density (VD) and vessel skeleton density (VSD) in the nasal area of the superficial capillary plexus (SCP) of diabetic subjects without diabetic retinopathy (DR), or in those with a non-proliferative diabetic retinopathy (NPDR), and to evaluate the relationship between the VD and VSD and the severity of DR. In this prospective study, the VD and VSD in the SCP were measured and analyzed on 6 × 6-mm macular and nasal optical coherence tomography angiography scans. The three concentric circles of the Early Treatment of Diabetic Retinopathy Study (ETDRS) grid were used and divided into zones numbered from 1 to 9 in the macular area and from 1 to 8 in the nasal area. The VD was significantly lower in the nasal peripapillary area (p = 0.0028), and both the VD and VSD were significantly lower in the macular area (p = 0.0131 and p = 0.0132, respectively) in patients with more severe DR. The SD was significantly lower in zones 5 (p = 0.0315) and 6 (p = 0.0324) in the nasal grid in patients with more severe DR. We showed a lower superficial capillary flow in the nasal periphery and peripapillary area in patients with more severe DR.
Keywords: diabetic retinopathy; optical coherence tomography angiography; retinal non-perfusion; skeleton density; vessel density.
Conflict of interest statement
The authors declare no conflict of interest regarding this manuscript.
Figures


References
-
- Kim A.Y., Chu Z., Shahidzadeh A., Wang R.K., Puliafito C.A., Kashani A.H. Quantifying Microvascular Density and Morphology in Diabetic Retinopathy Using Spectral-Domain Optical Coherence Tomography Angiography. Investig. Opthalmol. Vis. Sci. 2016;57:362–370. doi: 10.1167/iovs.15-18904. - DOI - PMC - PubMed
-
- Nesper P.L., Roberts P.K., Onishi A.C., Chai H., Liu L., Jampol L.M., Fawzi A.A. Quantifying Microvascular Abnormalities With Increasing Severity of Diabetic Retinopathy Using Optical Coherence Tomography Angiography. Investig. Ophthalmol. Vis. Sci. 2017;58:307–315. doi: 10.1167/iovs.17-21787. - DOI - PMC - PubMed
-
- Hirano T., Kitahara J., Toriyama Y., Kasamatsu H., Murata T., Sadda S. Quantifying vascular density and morphology using different swept-source optical coherence tomography angiographic scan patterns in diabetic retinopathy. Br. J. Ophthalmol. 2018;130:216–221. doi: 10.1136/bjophthalmol-2018-311942. - DOI - PubMed
-
- Lei J., Yi E., Suo Y., Chen C., Xu X., Ding W., Abdelfattah N.S., Fan X., Lu H. Distinctive Analysis of Macular Superficial Capillaries and Large Vessels Using Optical Coherence Tomographic Angiography in Healthy and Diabetic Eyes. Investig. Opthalmol. Vis. Sci. 2018;59:1937–1943. doi: 10.1167/iovs.17-23676. - DOI - PubMed
LinkOut - more resources
Full Text Sources
