. 2022 Jan 20;15(3):775.
doi: 10.3390/ma15030775.

Green Silver Nanoparticles Promote Inflammation Shutdown in Human Leukemic Monocytes

Affiliations

Green Silver Nanoparticles Promote Inflammation Shutdown in Human Leukemic Monocytes

Mariafrancesca Cascione et al. Materials (Basel). .

Abstract

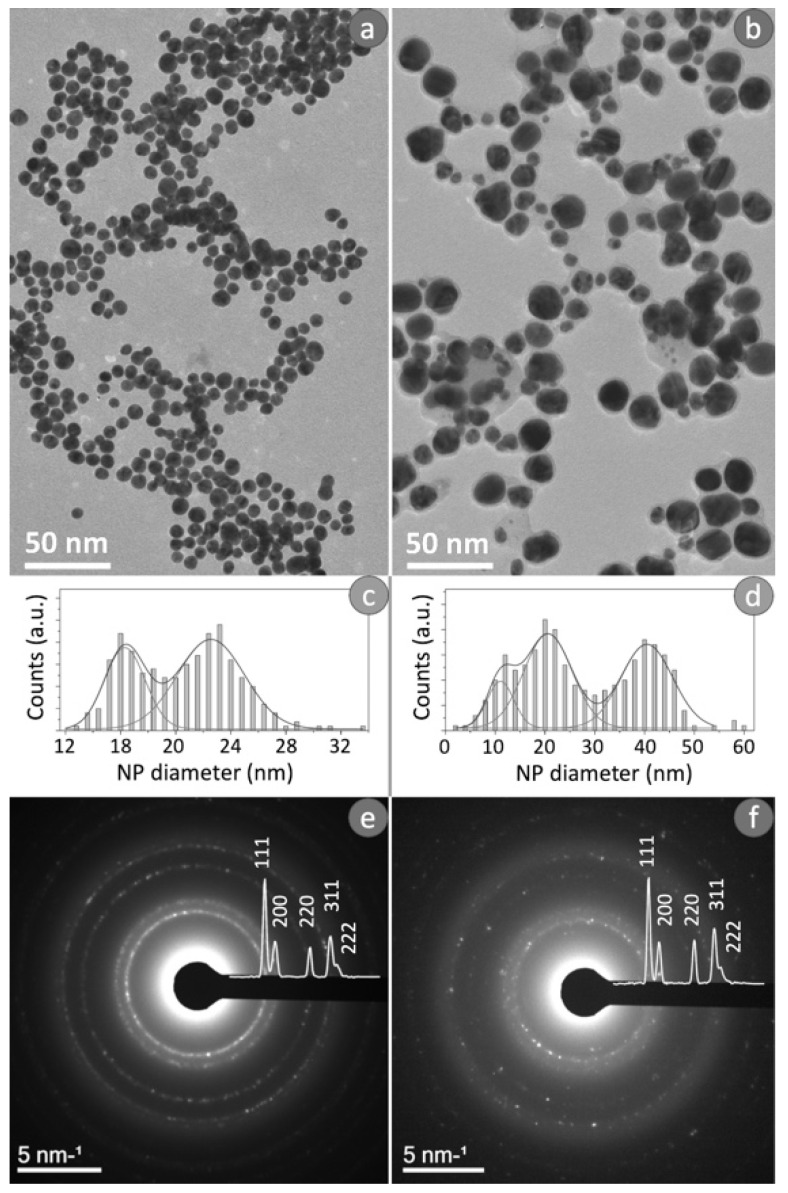
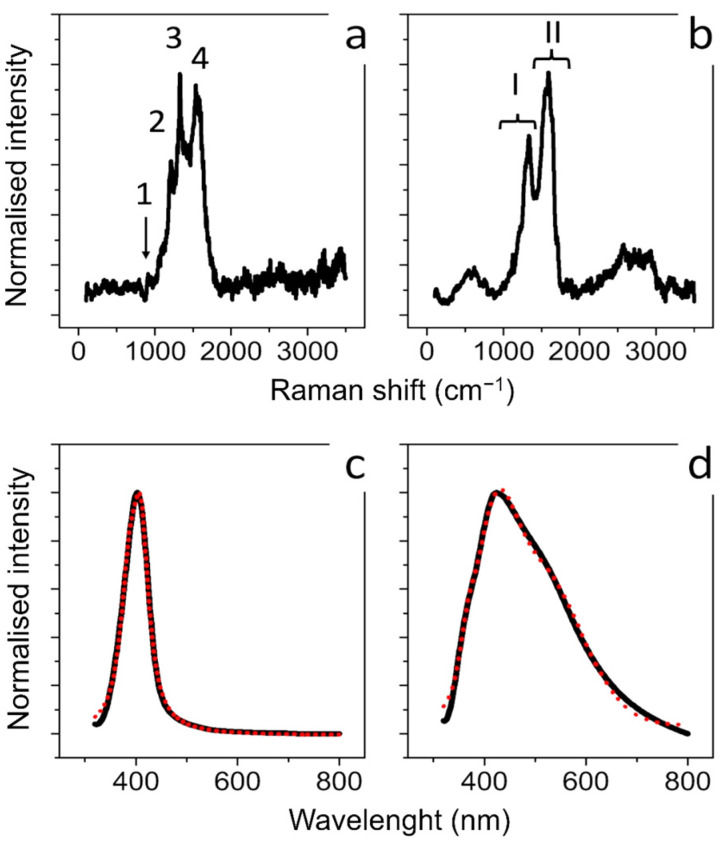
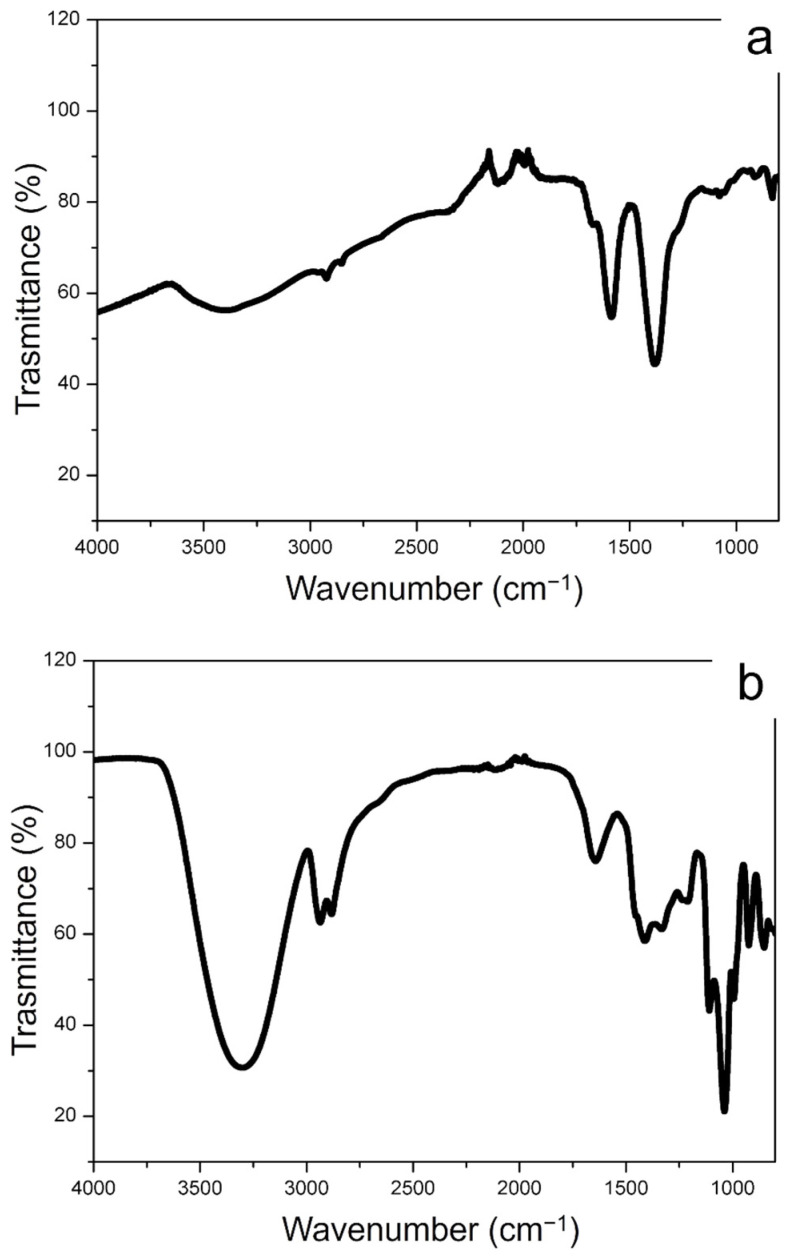
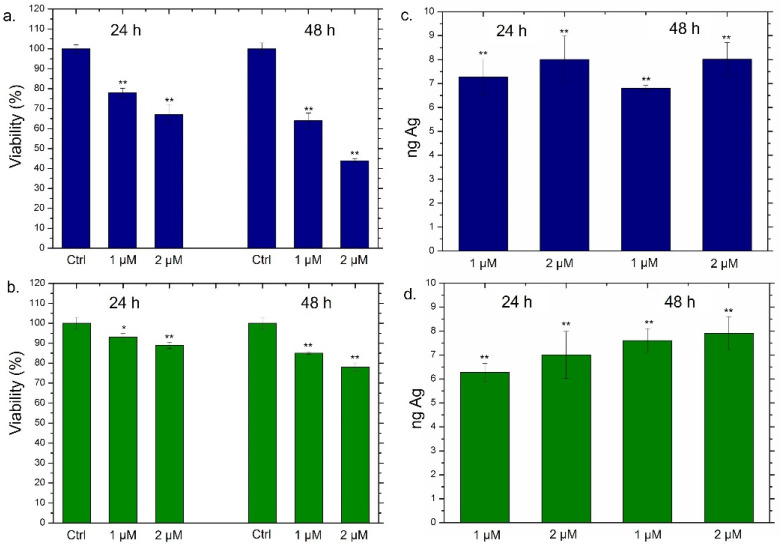
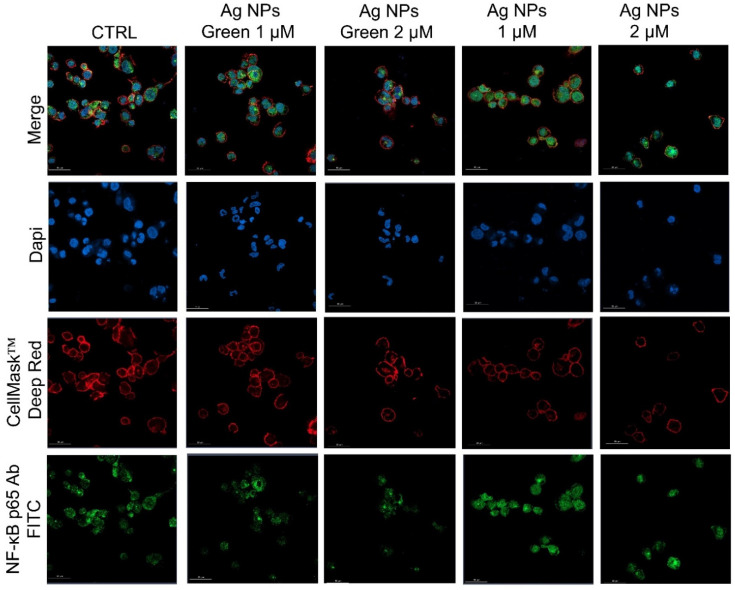
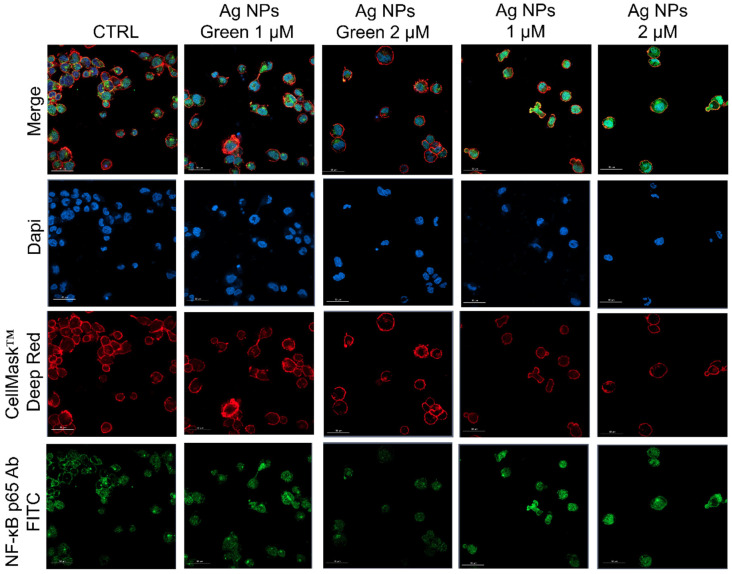
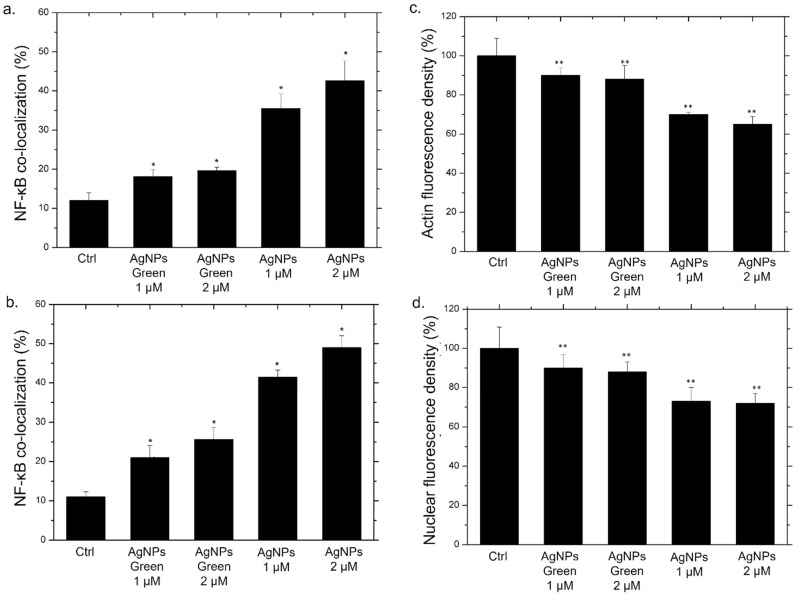
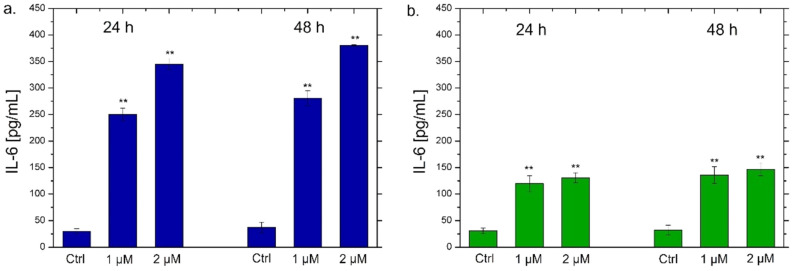
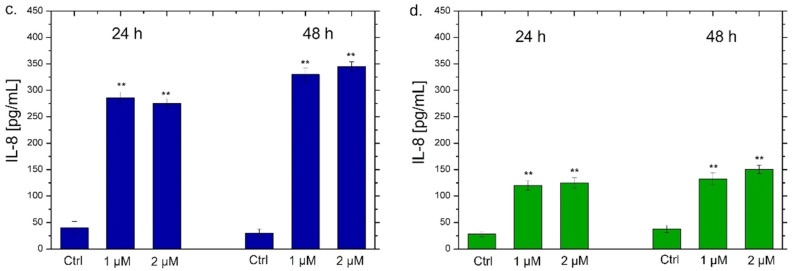
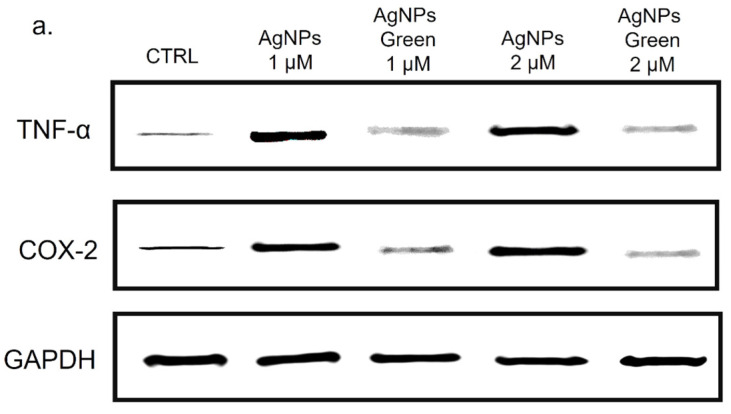
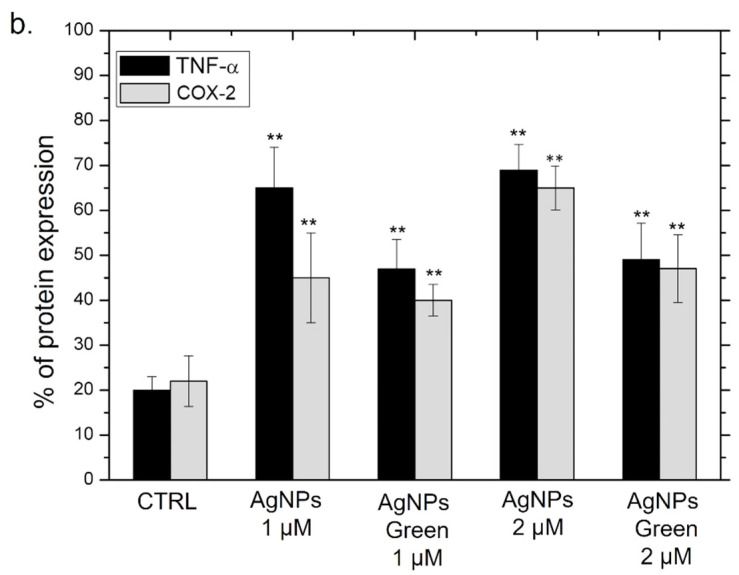
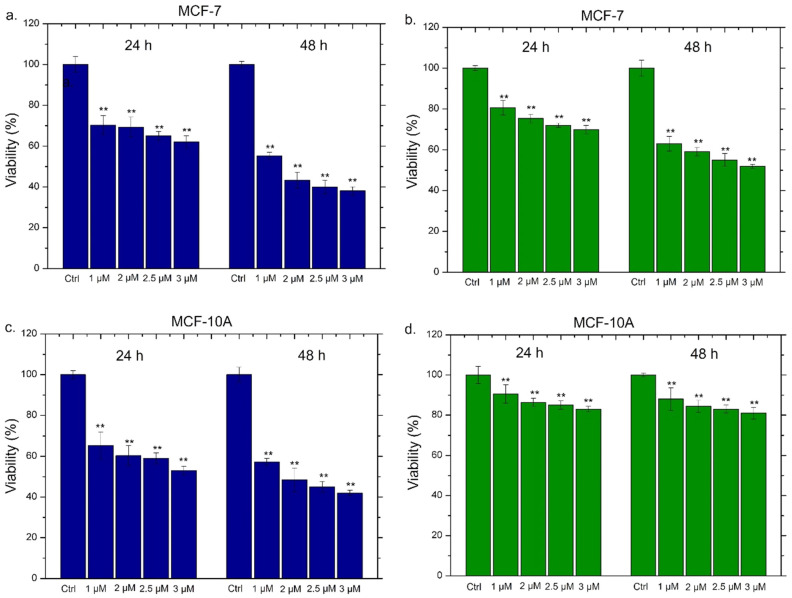
The use of silver nanoparticles (Ag NPs) in the biomedical field deserves a mindful analysis of the possible inflammatory response which could limit their use in the clinic. Despite the anti-cancer properties of Ag NPs having been widely demonstrated, there are still few studies concerning their involvement in the activation of specific inflammatory pathways. The inflammatory outcome depends on the synthetic route used in the NPs production, in which toxic reagents are employed. In this work, we compared two types of Ag NPs, obtained by two different chemical routes: conventional synthesis using sodium citrate and a green protocol based on leaf extracts as a source of reduction and capping agents. A careful physicochemical characterization was carried out showing spherical and stable Ag NPs with an average size between 20 nm and 35 nm for conventional and green Ag NPs respectively. Then, we evaluated their ability to induce the activation of inflammation in Human Leukemic Monocytes (THP-1) differentiated into M0 macrophages using 1 µM and 2 µM NPs concentrations (corresponded to 0.1 µg/mL and 0.2 µg/mL respectively) and two-time points (24 h and 48 h). Our results showed a clear difference in Nuclear Factor κB (NF-κb) activation, Interleukins 6-8 (IL-6, IL-8) secretion, Tumor Necrosis Factor-α (TNF-α) and Cyclooxygenase-2 (COX-2) expression exerted by the two kinds of Ag NPs. Green Ag NPs were definitely tolerated by macrophages compared to conventional Ag NPs which induced the activation of all the factors mentioned above. Subsequently, the exposure of breast cancer cell line (MCF-7) to the green Ag NPs showed that they exhibited antitumor activity like the conventional ones, but surprisingly, using the MCF-10A line (not tumoral breast cells) the green Ag NPs did not cause a significant decrease in cell viability.

Keywords: green route; inflammation response; physico-chemical properties; silver nanoparticles.


Conflict of interest statement

The authors declare no conflict of interest.

Figures

Figure 1
Figure 1
Typical bright field TEM images obtained from conventional Ag NPs (a), related size distribution (c) and SAED pattern (e). Typical bright field TEM image recorded from green Ag NPs (b), related size distribution (d) and SAED pattern (f).
Figure 2
Figure 2
Raman (a) and UV-V is absorbance spectra (c) obtained from conventional Ag NPs synthesized using citrate: 1, 2, 3, and 4 in (a) marked the peaks related to n(C–COO), n s(COO), n s(COO) and n as(COO) of citrate; Raman (b) and UV-VIS absorbance spectra (d) obtained from green Ag NPs. (I), (II) in (b) marked the peaks related to C=C and C=O bonds. In (c,d), the black lines represented the experimental optical absorption and the dashed red curve the experimental fit.
Figure 3
Figure 3
FTIR spectra obtained from conventional Ag NPs (a) and green Ag NPs (b).
Figure 4
Figure 4
(a,b) Viability assay performed on THP-1 cell lines exposed to 1 µM and 2 µM of conventional Ag NPs (a) and green Ag NPs (b) after 24 h and 48 h. The viability of cells exposed to NPs was normalized to control cells (untreated). As a positive control (P), 5% of DMSO was used (data not shown). Data reported as the mean ± SD from three independent experiments are considered statistically significant, compared with the control (n = 8) for p-value < 0.01 (<0.01 **) and < 0.05 (<0.05 *). (c,d) Uptake of conventional Ag NPs (c) and green Ag NPs (d) in THP-1 cell lines at concentrations of 1 µM and 2 µM for 24 h and 48 h. Untreated cells represented the controls (values = 0, data not shown). The data were reported as the mean ± SD from three independent experiments. Data were statistically significant in comparison to exposed cells vs. control cells (ag content is equal to 0) for p-value < 0.01 (<0.01 **).
Figure 5
Figure 5
Representative confocal images of untreated macrophages (M0, control) and macrophages exposed to the 1 µM and 2 µM of green Ag NPs and conventional Ag NPs for 24 h. The cells were fixed and then stained. The nuclei were labeled with DAPI (blue), Actin cytoskeleton with CellMask™ (red), and NF-κB with NF-κB p65 Antibody (F-6) FITC (green intensity signal). Scale bar is 50 µm.
Figure 6
Figure 6
Representative confocal images of untreated macrophages (M0, control) and M0 exposed to the 1 µM and 2 µM of green Ag NPs and conventional Ag NPs for 48 h. The cells were fixed and then labeled as described in Figure 5. Scale bar is 50 µm.
Figure 7
Figure 7
Co-localization analysis of the merged fluorescence signals on confocal images due to the NF-κB translocation from the cytoplasm to the nucleus (merged blue/green fluorescence intensity signal) after 24 h (a) and 48 h (b). The data are expressed as the mean SD (5 images for n = 2) and they were considered statistically significant for a * p < 0.01 (<0.01 **) and p < 0.05 (<0.05 *). Mean values and their respective standard deviation of actin density fluorescence (c) and nuclear density fluorescence (d) calculated on confocal acquisitions of THP-1-NPs treated for 48 h.
Figure 8
Figure 8
IL-6 (a,b) and IL-8 (c,d) levels expressed as pg/mL measured after exposure of THP-1 cells to conventional Ag NPs and green Ag NPs (1 µM and 2 µM) for 24 h and 48 h. The cytokine amount was detected in supernatants derived from the control and the treated cells by ELISA assay. The data were reported as the mean ± standard deviation of three separate experiments. p-value < 0.01 (<0.01 **) compared to the control of each time point.
Figure 8
Figure 8
IL-6 (a,b) and IL-8 (c,d) levels expressed as pg/mL measured after exposure of THP-1 cells to conventional Ag NPs and green Ag NPs (1 µM and 2 µM) for 24 h and 48 h. The cytokine amount was detected in supernatants derived from the control and the treated cells by ELISA assay. The data were reported as the mean ± standard deviation of three separate experiments. p-value < 0.01 (<0.01 **) compared to the control of each time point.
Figure 9
Figure 9
Western blot (a) and densitometric analysis (b) of TNF-α and COX-2 expression on THP-1, after 48 h of exposure to 2 µM of conventional and green Ag NPs. The reported data are estimated as an average of five independent experiments ± SD and they are considered statistically significant with p-value < 0.01 (<0.01 **).
Figure 9
Figure 9
Western blot (a) and densitometric analysis (b) of TNF-α and COX-2 expression on THP-1, after 48 h of exposure to 2 µM of conventional and green Ag NPs. The reported data are estimated as an average of five independent experiments ± SD and they are considered statistically significant with p-value < 0.01 (<0.01 **).
Figure 10
Figure 10
Viability assay performed on MCF-7 and MCF-10A cell lines exposed to 1 µM, 2 µM, 2.5 µM and 3 µM of conventional Ag NPs (a,c) and green Ag NPs (b,d) after 24 h and 48 h. The viability of cells exposed to NPs was normalized to untreated cells (control). The positive control was represented by cells incubated with 5% DMSO (data not shown). Data reported were the mean ± SD from three independent experiments compared with the control (n = 8) for p-value < 0.01 (<0.01 **).

Similar articles

Cited by

References

    1. Contado C. Nanomaterials in consumer products: A challenging analytical problem. Front. Chem. 2015;3:48. doi: 10.3389/fchem.2015.00048. - DOI - PMC - PubMed
    1. Rai M., Birla S., Ingle A.P., Gupta I., Gade A., Abd-Elsalam K., Marcato P.D., Durán N. Nanosilver: An inorganic nanoparticle with myriad potential applications. Nanotechnol. Rev. 2014;3:281–309. doi: 10.1515/ntrev-2014-0001. - DOI
    1. De Matteis V., Rizzello L., Di Bello M.P., Rinaldi R. One-step synthesis, toxicity assessment and degradation in tumoral pH environment of SiO2@Ag core/shell nanoparticles. J. Nanopart. Res. 2017;19:14. doi: 10.1007/s11051-017-3870-2. - DOI
    1. Amendola V., Bakr O.M., Stellacci F. A Study of the Surface Plasmon Resonance of Silver Nanoparticles by the Discrete Dipole Approximation Method: Effect of Shape, Size, Structure, and Assembly. Plasmonics. 2010;5:85–97. doi: 10.1007/s11468-009-9120-4. - DOI
    1. Govindappa M., Tejashree S., Thanuja V., Hemashekhar B., Srinivas C., Nasif O., Pugazhendhi A., Raghavendra V.B. Pomegranate fruit fleshy pericarp mediated silver nanoparticles possessing antimicrobial, antibiofilm formation, antioxidant, biocompatibility and anticancer activity. J. Drug Deliv. Sci. Technol. 2020;61:102289. doi: 10.1016/j.jddst.2020.102289. - DOI