. 2022 Jan 22;15(3):838.
doi: 10.3390/ma15030838.

Mineralization in a Critical Size Bone-Gap in Sheep Tibia Improved by a Chitosan-Calcium Phosphate-Based Composite as Compared to Predicate Device

Affiliations

Mineralization in a Critical Size Bone-Gap in Sheep Tibia Improved by a Chitosan-Calcium Phosphate-Based Composite as Compared to Predicate Device

Gissur Örlygsson et al. Materials (Basel). .

Abstract

Deacetylated chitin derivatives have been widely studied for tissue engineering purposes. This study aimed to compare the efficacy of an injectable product containing a 50% deacetylated chitin derivative (BoneReg-Inject™) and an existing product (chronOS Inject®) serving as a predicate device. A sheep model with a critical size drill hole in the tibial plateau was used. Holes of 8 mm diameter and 30 mm length were drilled bilaterally into the proximal area of the tibia and BoneReg-Inject™ or chronOS Inject® were injected into the right leg holes. Comparison of resorption and bone formation in vivo was made by X-ray micro-CT and histological evaluation after a live phase of 12 weeks. Long-term effects of BoneReg-Inject™ were studied using a 13-month live period. Significant differences were observed in (1) amount of new bone within implant (p < 0.001), higher in BoneReg-InjectTM, (2) signs of cartilage tissue (p = 0.003), more pronounced in BoneReg-InjectTM, and (3) signs of fibrous tissue (p < 0.001), less pronounced in BoneReg-InjectTM. Mineral content at 13 months postoperative was significantly higher than at 12 weeks (p < 0.001 and p < 0.05, for implant core and rim, respectively). The data demonstrate the potential of deacetylated chitin derivatives to stimulate bone formation.

Keywords: X-ray micro CT; bone defects; bone formation; bone implant; chitosan; degree of deacetylation; histology; sheep tibia.


Conflict of interest statement

Jóhannes Gíslason, Jón M. Einarsson and Chuen-How Ng are employees of Genis hf.

Figures
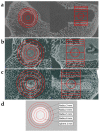
Figure 1
Figure 1
(ac) show micro CT constructs in two different planes of samples after 3 months in vivo. (a) Sample derived from the left tibia (negative control, empty hole) of an animal receiving BoneReg-Inject™ in right leg drill hole, still essentially void of mineralized tissue. A rim of increased density integrated with the adjacent trabeculum on the edge surrounding the drill hole. The figure shows how virtual cylinders were created, concentric to the drill hole and with different radiuses. (b) BoneReg-Inject™ treated sample from the right tibia. A rim of mineralized tissue, well integrated with the adjacent trabecular bone, surrounding the implant, islands of dense material are scattered within the body of the implant. (c) chronOS Inject® treated sample from the right tibia. High density granules, characteristic for chronOS Inject® are apparent in the images. Mineralized new tissue is less pronounced in the chronOS Inject® group compared to the BoneReg-Inject™ group. (d) Illustration of virtual cylinders created. Length of all cylinders was 8 mm. The largest cylinder has a radius of 6 mm, the smallest has a radius of 3 mm and in the center is a sphere with radius of 2 mm. The cylinder with radius of 4 mm (8 mm in diameter) shows the border of the drill hole.
Figure 2
Figure 2
(a) Mineral phase volume inside the composites ex vivo (before implantation) and after 3 months in vivo, measured in spheres (radius 2 mm). (b) Bars show mineral phase volume before implantation normalized to 100% for both composites and their relative reduction during 3 months in vivo. Mineral phase volume in BoneReg-Inject™ group (n = 15) is reduced by 21% and in chronOS Inject® (n = 14) by 10%. (Student’s t-test; p < 0.001). Means and SEM (BoneReg-Inject™ n = 15; chronOS Inject® n = 14).
Figure 3
Figure 3
Bars indicate the mean mineral volume ratio in one virtual cylinder and 3 tubes in both experimental groups and the empty holes (negative control). The empty holes in both groups were summed up into a single control group. Results for a cylinder with a 3 mm radius and 3 different tubes with fixed volume are shown; R4-R3, R5-R4, and R6-R5 (see Figure 1 and insert above for location and alignment). The BoneReg-Inject™ group shows a significantly higher mineral volume ratio in a 1 mm rim of the implant (R4-R3) compared to the chronOS Inject® group (Student’s t-test p < 0.001, indicated by three asterisks in the figure). Values are means and bars are standard error of the mean (SEM). R3 = radius 3 mm, R4 = radius 4 mm, etc. (BoneReg-Inject™ n = 15; chronOS Inject® n = 14).
Figure 4
Figure 4
Scoring of percentage closure of cortical entrance hole in the two test groups and the empty holes in both groups 3 months postoperatively shown as box plot based on results from ANOVA on ranks, and only showing a significant difference between BoneReg-Inject™ and empty hole (Empty), Dunn’s Method, p < 0.05. Boxes show a 50% confidence limit and bars show a 90% confidence limit. The median is indicated by the horizontal line within the boxes. (BoneReg-Inject™ n = 15; chronOS Inject® n = 14; Control n = 29).
Figure 5
Figure 5
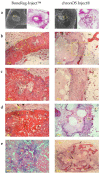
3 months postoperative. (a) An alignment of histological sections with two-dimensional cross-sections of micro CT constructs in a bone marrow/trabecular bone area in the right legs of sheep with BoneReg-Inject™ implant (left column) and chronOS Inject® implant (right column). The left images in each column show the two-dimensional micro CT cross sections in the plane aligned with the histological section in the right image. The scale bars are 2 mm. BoneReg-Inject™ column: (b) Histological section, a close up of the area of the yellow frame shown. (a). The rim of neo-osteoid covering the implant is clearly visible (yellow arrows). BM: Bone marrow, FL: Fibrous layer, IP: Implant. (c) A close up of the right yellow frame in (b). New bone, connected to the bone shell covering the implant, has grown into the implant (yellow arrows). Characteristic blue deposits seen on the interface between new bone and the implant indicate areas of calcification. Osteoblast-like cells (OB) visible on the outer layer of the new bone shell. (d) A close up of the left yellow frame in (b). The rim of neo-osteoid covering the implant is evident (BL) and individual osteocytes are visible (yellow arrows). Osteoblast-like cells (OB) are visible on the outer layer of the bone shell. (e) Trabecular-like neo-osteoid formation inside the BoneReg-Inject™ implant. Blue indicates regions of on-going calcification. chronOS Inject® column: (b) A close up of the yellow frame area shown in (a). The fibrous tissue covering the implant is characteristic of the chronOS Inject® group. The characteristic granules are apparent in the implant. FT: Fibrous tissue, TB: Trabecular bone. (c) A close up of the yellow framed area in (b) showing the implant surrounded by fibrous tissue and bone marrow. It is characteristic for the chronOS Inject® group to see this layer of fibrous tissue surrounding the implant (*). Blood vessels with red blood cells are evident both in the bone marrow and fibrous tissue layer (yellow arrows). (d) Implant surrounded by fibrous tissue. (e) Trabecular-like neo-osteoid (TB) formed inside the layer of fibrous tissue replacing the chronOS Inject® implant (IP), as it resolves. This formation of new bone was generally rare in the chronOS Inject® group and was poorly integrated with the existing surrounding trabecular bone.
Figure 6
Figure 6
Mineral volume ratio in a virtual cylinder (R3) and tubes R4-R3, R5-R4 and R6-R5 in BoneReg-Inject™ samples after 3 months (BoneReg 3) and 13 months (BoneReg 13) and in the empty control (Empty 3 and Empty 13). Mean and SEM (n = 15 for each treatment). Mineral content within the implanted scaffold at 13 months postoperatively was significantly higher than at 3 months postoperatively (R3 t-test, p < 0.001 and R4-R3 t-test, p < 0.05). In the empty drill holes, mineral content within R3 was significantly higher after 13 months (t-test, p < 0.001). A significant increase in mineral content was also observed in the trabecular bone outside the empty holes (R6-R5, t-test, p < 0.001), potentially reflecting a response to counteract weakening of the bone due to the drill hole.
Figure 7
Figure 7
BoneReg-Inject™. (a) Micro CT image (scale bar = 2 mm) and (b) a histological slide showing BoneReg-Inject™ implant at 13 months postoperative (scale bar = 2 mm). New bone is well integrated with the surrounding trabecular bone. Yellow frames on the histological slide refer to regions in focus in (c) (176) and (d) (177). In this animal, the micro CT image shows relatively well-developed colonization of mineralized tissue inside the implant. The histological slide indicates trabecular-like neo-osteoid replacing the resolved outer rim of the implant and integrating into the surrounding trabecular bone. (c,d) show neo-osteoid replacing the resolved surface of the implant and forming islands scattered inside the mass of the implant. Blue indicates calcification. Samples stained with hematoxylin and eosin.

References

    1. Dennis S.C., Berkland C.J., Bonewald L.F., Detamore M.S. Endochondral ossification for enhancing bone regeneration: Converging native extracellular matrix biomaterials and developmental engineering in vivo. Tissue Eng. Part B Rev. 2015;21:247–266. doi: 10.1089/ten.teb.2014.0419. - DOI - PMC - PubMed
    1. Oryan A., Alidadi S., Moshiri A., Maffulli N. Bone regenerative medicine: Classic options, novel strategies, and future directions. J. Orthop. Surg. Res. 2014;9:18. doi: 10.1186/1749-799X-9-18. - DOI - PMC - PubMed
    1. Dimitriou R., Jones E., McGonagle D., Giannoudis P.V. Bone regeneration: Current concepts and future directions. BMC Med. 2011;9:66. doi: 10.1186/1741-7015-9-66. - DOI - PMC - PubMed
    1. Collignon A.M., Lesieur J., Vacher C., Chaussain C., Rochefort G.Y. Strategies developed to induce, direct, and potentiate bone healing. Front. Physiol. 2017;8:927. doi: 10.3389/fphys.2017.00927. - DOI - PMC - PubMed
    1. Sheikh Z., Javaid M.A., Hamdan N., Hashmi R. Bone regeneration using bone morphogenetic proteins and various biomaterial carriers. Materials. 2015;8:1778–1816. doi: 10.3390/ma8041778. - DOI - PMC - PubMed

LinkOut - more resources