

Biodegradable Thermoplastic Starch/Polycaprolactone Blends with Co-Continuous Morphology Suitable for Local Release of Antibiotics
- PMID: 35161043
- PMCID: PMC8840403
- DOI: 10.3390/ma15031101
Biodegradable Thermoplastic Starch/Polycaprolactone Blends with Co-Continuous Morphology Suitable for Local Release of Antibiotics
Abstract
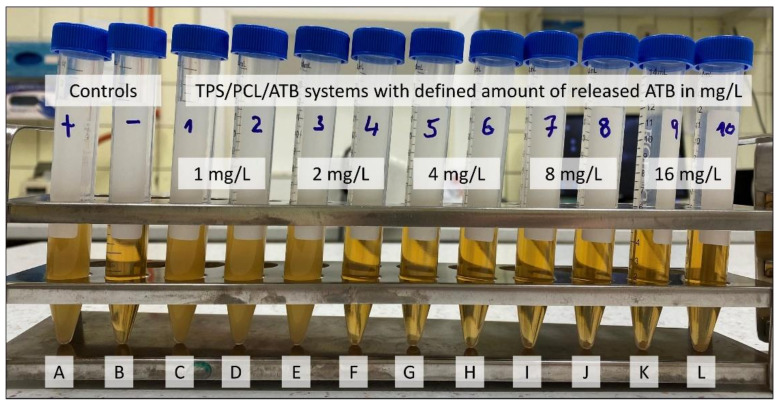
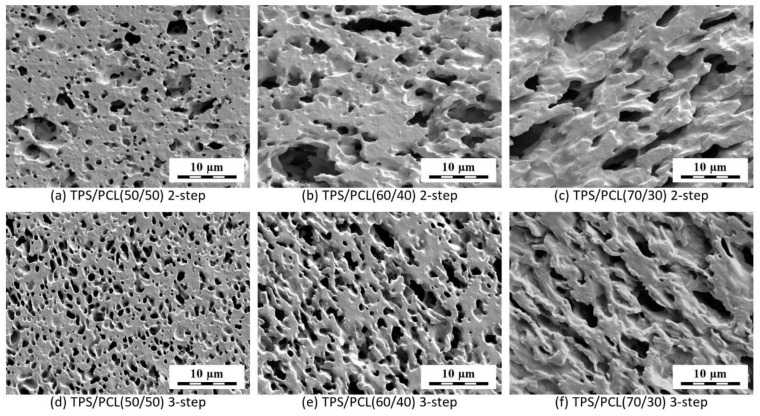
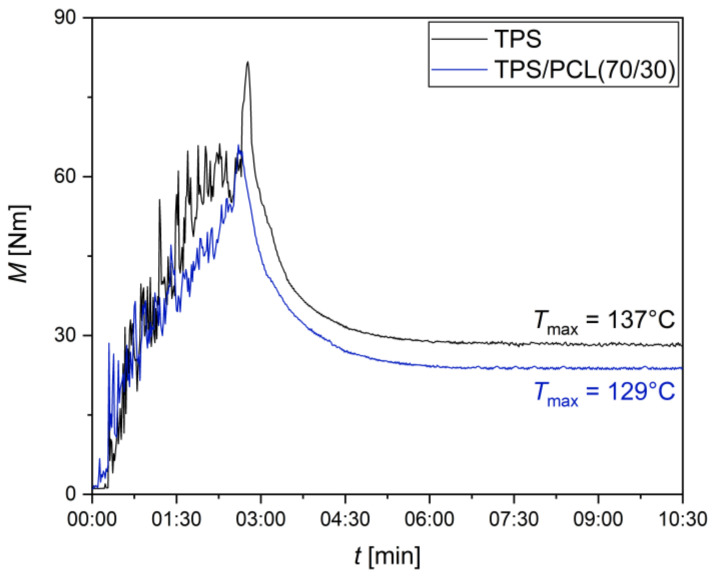
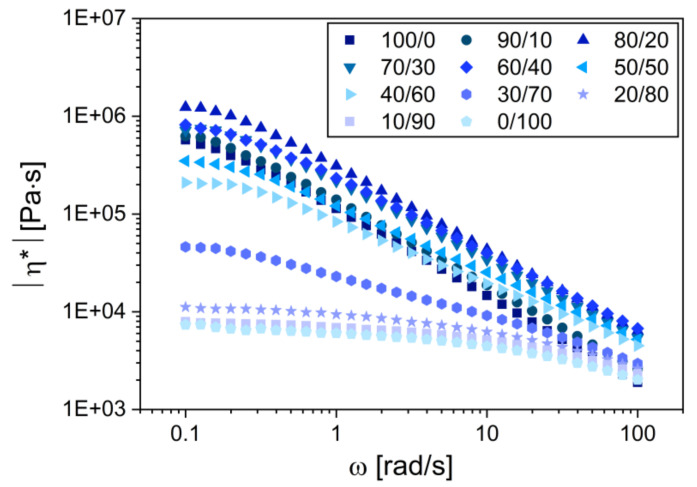
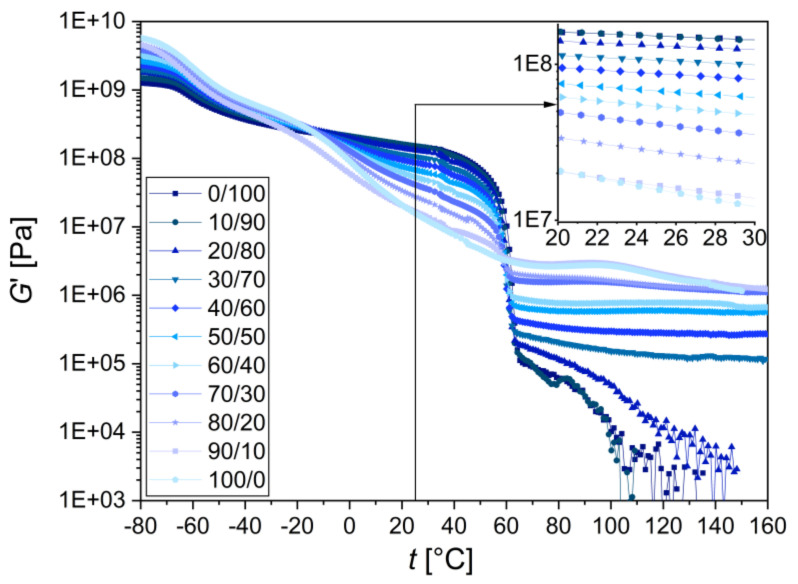
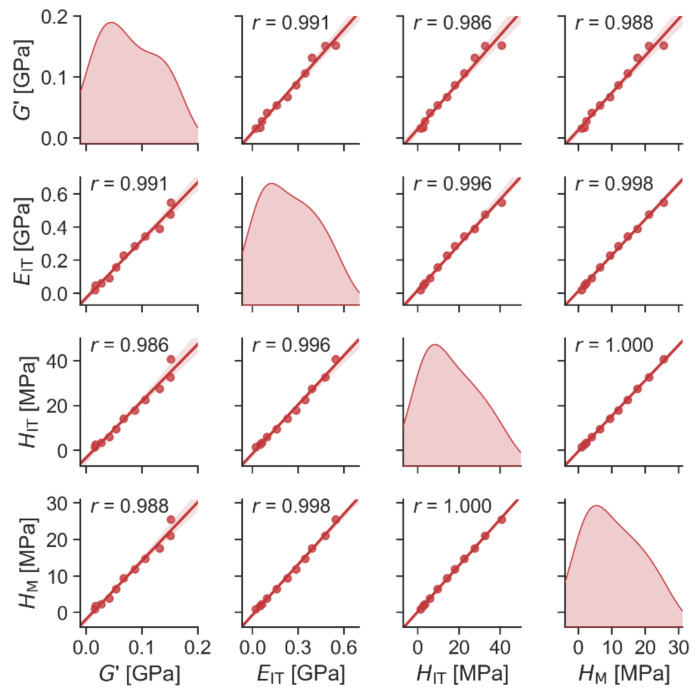
We report a reproducible preparation and characterization of highly homogeneous thermoplastic starch/pol(ε-caprolactone) blends (TPS/PCL) with a minimal thermomechanical degradation and co-continuous morphology. These materials would be suitable for biomedical applications, specifically for the local release of antibiotics (ATB) from the TPS phase. The TPS/PCL blends were prepared in the whole concentration range. In agreement with theoretical predictions based on component viscosities, the co-continuous morphology was found for TPS/PCL blends with a composition of 70/30 wt.%. The minimal thermomechanical degradation of the blends was achieved by an optimization of the processing conditions and by keeping processing temperatures as low as possible, because higher temperatures might damage ATB in the final application. The blends' homogeneity was verified by scanning electron microscopy. The co-continuous morphology was confirmed by submicron-computed tomography. The mechanical performance of the blends was characterized in both microscale (by an instrumented microindentation hardness testing; MHI) and macroscale (by dynamic thermomechanical analysis; DMTA). The elastic moduli of TPS increased ca four times in the TPS/PCL (70/30) blend. The correlations between elastic moduli measured by MHI and DMTA were very strong, which implied that, in the future studies, it would be possible to use just micromechanical testing that does not require large specimens.
Keywords: microindentation; micromechanical properties; poly(ε-caprolactone); polymer blends; structure–properties relations; thermoplastic starch.
Conflict of interest statement
The authors declare no conflict of interest.
Figures


Similar articles
-
Ductility and Toughness Improvement of Injection-Molded Compostable Pieces of Polylactide by Melt Blending with Poly(ε-caprolactone) and Thermoplastic Starch.Materials (Basel). 2018 Oct 30;11(11):2138. doi: 10.3390/ma11112138. Materials (Basel). 2018. PMID: 30380751 Free PMC article.
-
Biodegradable blends of urea plasticized thermoplastic starch (UTPS) and poly(ε-caprolactone) (PCL): Morphological, rheological, thermal and mechanical properties.Carbohydr Polym. 2017 Jul 1;167:177-184. doi: 10.1016/j.carbpol.2017.03.051. Epub 2017 Mar 18. Carbohydr Polym. 2017. PMID: 28433152
-
Effect of the Incorporation of Polycaprolactone (PCL) on the Retrogradation of Binary Blends with Cassava Thermoplastic Starch (TPS).Polymers (Basel). 2020 Dec 24;13(1):38. doi: 10.3390/polym13010038. Polymers (Basel). 2020. PMID: 33374197 Free PMC article.
-
Effect of thermoplastic starch/poly(lactic acid) weight fraction on phase morphology and performance of biodegradable blends and their jute fiber composites.Int J Biol Macromol. 2024 Dec;283(Pt 2):137705. doi: 10.1016/j.ijbiomac.2024.137705. Epub 2024 Nov 15. Int J Biol Macromol. 2024. PMID: 39549797
-
Polyaryletherketone Based Blends: A Review.Polymers (Basel). 2023 Sep 29;15(19):3943. doi: 10.3390/polym15193943. Polymers (Basel). 2023. PMID: 37835993 Free PMC article. Review.
Cited by
-
European Database of Explanted UHMWPE Liners from Total Joint Replacements: Correlations among Polymer Modifications, Structure, Oxidation, Mechanical Properties and Lifetime In Vivo.Polymers (Basel). 2023 Jan 21;15(3):568. doi: 10.3390/polym15030568. Polymers (Basel). 2023. PMID: 36771869 Free PMC article.
-
Antimicrobial Solid Starch-Iodine Complex via Reactive Extrusion and Its Application in PLA-PBAT Blown Films.Polymers (Basel). 2024 May 24;16(11):1487. doi: 10.3390/polym16111487. Polymers (Basel). 2024. PMID: 38891434 Free PMC article.
-
Biopolymeric Blends of Thermoplastic Starch and Polylactide as Sustainable Packaging Materials.Polymers (Basel). 2024 May 1;16(9):1268. doi: 10.3390/polym16091268. Polymers (Basel). 2024. PMID: 38732736 Free PMC article.
-
Impact of Acid Hydrolysis on Morphology, Rheology, Mechanical Properties, and Processing of Thermoplastic Starch.Polymers (Basel). 2025 May 11;17(10):1310. doi: 10.3390/polym17101310. Polymers (Basel). 2025. PMID: 40430606 Free PMC article.
-
Morphology, Micromechanical, and Macromechanical Properties of Novel Waterborne Poly(urethane-urea)/Silica Nanocomposites.Materials (Basel). 2023 Feb 21;16(5):1767. doi: 10.3390/ma16051767. Materials (Basel). 2023. PMID: 36902884 Free PMC article.
References
-
- Luckachan G.E., Pillai C.K.S. Biodegradable Polymers—A Review on Recent Trends and Emerging Perspectives. J. Polym. Environ. 2011;19:637–676. doi: 10.1007/s10924-011-0317-1. - DOI
-
- Colnik M., Knez-Hrncic M., Skerget M., Knez Z. Biodegradable Polymers, Current Trends of Research and Their Applications, a Review. Chem. Ind. Chem. Eng. Q. 2020;26:401–418. doi: 10.2298/CICEQ191210018C. - DOI
-
- European Bioplastics. [(accessed on 20 December 2021)]. Available online: https://www.european-bioplastics.org/bioplastics/materials/
-
- Mohammadi Nafchi A., Moradpour M., Saeidi M., Alias A.K. Thermoplastic Starches: Properties, Challenges, and Prospects. Starch/Stärke. 2013;65:61–72. doi: 10.1002/star.201200201. - DOI
-
- Liu H., Xie F., Yu L., Chen L., Li L. Thermal Processing of Starch-Based Polymers. Prog. Polym. Sci. 2009;34:1348–1368. doi: 10.1016/j.progpolymsci.2009.07.001. - DOI
Grants and funding
LinkOut - more resources
Full Text Sources
Molecular Biology Databases
