

Genome Mining and Gene Expression Reveal Maytansine Biosynthetic Genes from Endophytic Communities Living inside Gymnosporia heterophylla (Eckl. and Zeyh.) Loes. and the Relationship with the Plant Biosynthetic Gene, Friedelin Synthase
- PMID: 35161302
- PMCID: PMC8840412
- DOI: 10.3390/plants11030321
Genome Mining and Gene Expression Reveal Maytansine Biosynthetic Genes from Endophytic Communities Living inside Gymnosporia heterophylla (Eckl. and Zeyh.) Loes. and the Relationship with the Plant Biosynthetic Gene, Friedelin Synthase
Abstract
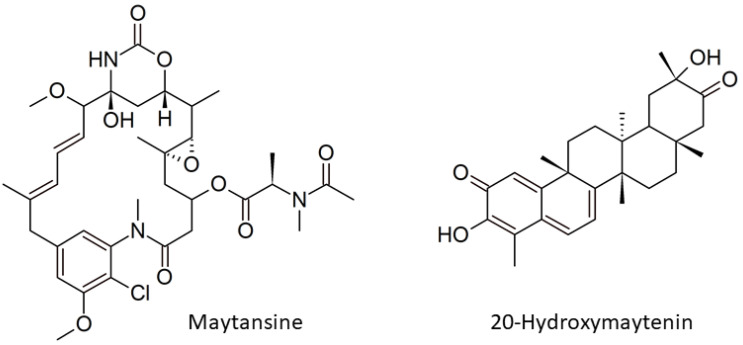
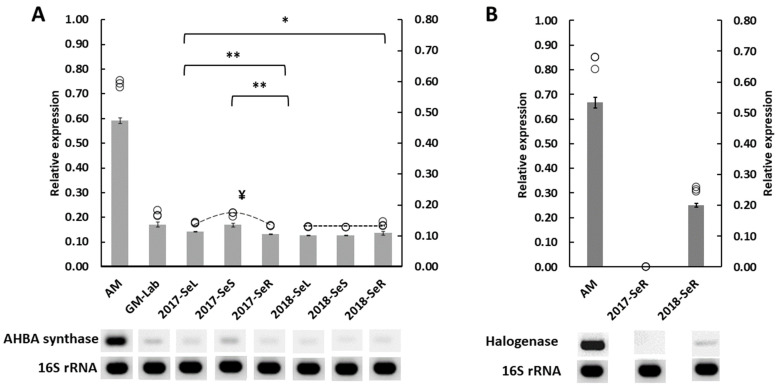
Even though maytansine was first discovered from Celastraceae plants, it was later proven to be an endophytic bacterial metabolite. However, a pure bacterial culture cannot synthesize maytansine. Therefore, an exclusive interaction between plant and endophytes is required for maytansine production. Unfortunately, our understanding of plant-endophyte interaction is minimal, and critical questions remain. For example: how do endophytes synthesize maytansine inside their plant host, and what is the impact of maytansine production in plant secondary metabolites? Our study aimed to address these questions. We selected Gymnosporia heterophylla as our model and used amino-hydroxybenzoic acid (AHBA) synthase and halogenase genes as biomarkers, as these two genes respond to biosynthesize maytansine. As a result, we found a consortium of seven endophytes involved in maytansine production in G. heterophylla, based on genome mining and gene expression experiments. Subsequently, we evaluated the friedelin synthase (FRS) gene's expression level in response to biosynthesized 20-hydroxymaytenin in the plant. We found that the FRS expression level was elevated and linked with the expression of the maytansine biosynthetic genes. Thus, we achieved our goals and provided new evidence on endophyte-endophyte and plant-endophyte interactions, focusing on maytansine production and its impact on plant metabolite biosynthesis in G. heterophylla.
Keywords: AHBA synthase gene; FRS gene; endophyte–endophyte interaction; halogenase gene; maytansine-producible endophytes; plant–endophyte interaction.
Conflict of interest statement
The authors declare no conflict of interest.
Figures


Similar articles
-
In Vitro Production and Exudation of 20-Hydroxymaytenin from Gymnosporia heterophylla (Eckl. and Zeyh.) Loes. Cell Culture.Plants (Basel). 2021 Jul 21;10(8):1493. doi: 10.3390/plants10081493. Plants (Basel). 2021. PMID: 34451538 Free PMC article.
-
Endophytes are hidden producers of maytansine in Putterlickia roots.J Nat Prod. 2014 Dec 26;77(12):2577-84. doi: 10.1021/np500219a. Epub 2014 Dec 5. J Nat Prod. 2014. PMID: 25478947
-
Effect of artificial reconstitution of the interaction between the plant Camptotheca acuminata and the fungal endophyte Fusarium solani on camptothecin biosynthesis.J Nat Prod. 2011 Apr 25;74(4):764-75. doi: 10.1021/np1008398. Epub 2011 Feb 24. J Nat Prod. 2011. PMID: 21348469
-
Molecular mechanisms in grass-Epichloë interactions: towards endophyte driven farming to improve plant fitness and immunity.World J Microbiol Biotechnol. 2020 Jun 19;36(7):92. doi: 10.1007/s11274-020-02868-5. World J Microbiol Biotechnol. 2020. PMID: 32562008 Review.
-
The invisible life inside plants: Deciphering the riddles of endophytic bacterial diversity.Biotechnol Adv. 2020 Nov 15;44:107614. doi: 10.1016/j.biotechadv.2020.107614. Epub 2020 Aug 25. Biotechnol Adv. 2020. PMID: 32858117 Review.
Cited by
-
Factors affecting the production of sugarcane yield and sucrose accumulation: suggested potential biological solutions.Front Plant Sci. 2024 May 13;15:1374228. doi: 10.3389/fpls.2024.1374228. eCollection 2024. Front Plant Sci. 2024. PMID: 38803599 Free PMC article. Review.
-
Interaction of Plants and Endophytic Microorganisms: Molecular Aspects, Biological Functions, Community Composition, and Practical Applications.Plants (Basel). 2023 Feb 6;12(4):714. doi: 10.3390/plants12040714. Plants (Basel). 2023. PMID: 36840062 Free PMC article.
-
Endophytic bacteria: a sustainable strategy for enhancing medicinal plant cultivation and preserving microbial diversity.Front Microbiol. 2024 Nov 18;15:1477465. doi: 10.3389/fmicb.2024.1477465. eCollection 2024. Front Microbiol. 2024. PMID: 39624715 Free PMC article. Review.
References
-
- Salvatore M.M., Andolfi A., Nicoletti R. The Thin Line between Pathogenicity and Endophytism: The Case of Lasiodiplodia theobromae. Agriculture. 2020;10:488. doi: 10.3390/agriculture10100488. - DOI
-
- Khan A.L., Gilani S.A., Waqas M., Al-Hosni K., Al-Khiziri S., Kim Y.-H., Ali L., Kang S.-M., Asaf S., Shahzad R., et al. Endophytes from Medicinal Plants and Their Potential for Producing Indole Acetic Acid, Improving Seed Germination and Mitigating Oxidative Stress. J. Zhejiang Univ. Sci. B. 2017;18:125–137. doi: 10.1631/jzus.B1500271. - DOI - PMC - PubMed
Grants and funding
LinkOut - more resources
Full Text Sources
Molecular Biology Databases
Research Materials
